Article Text

Abstract
Background The search for immunological markers with ability of predicting clinical outcome is a priority in lymphomas, and in cancer in general. It is well known that some immunomodulatory cells, such as myeloid derived suppressor cells (MDSCs) or regulatory T cells (Tregs), are recruited by tumors, jeopardizing antitumor immunosurveillance. In this work, we have studied blood levels of these immunosuppressive cells in patients with relapsed/refractory diffuse large B-cell lymphoma (R/R DLBCL), prior to and along the course of the experimental rituximab, gemcitabine, dexamethasone, and cisplatin (R2-GDP) schedule, as a translational substudy of the R2-GDP-GOTEL trial (EudraCT Number: 2014-001620-29), which included lenalidomide as an immunomodulator.
Methods Blood samples were taken before treatment, at cycle 3 and end of induction. Samples were analyzed by flow cytometry. Non-parametric tests were used. Mann-Whitney U test was used to compare basal cells distributions, and Wilcoxon test was considered to compare cells distribution at different times. Spearman test was performed to measure the degree of association between cell populations.
Results In this study, MDSC and Treg circulating concentration was found increased in all patients compared with a healthy control group and decreased after treatment only in patients with longest overall survival (>24 months), reaching the levels of the healthy group. Likewise, the number of inhibited T lymphocytes expressing Programmed Death-1 (PD-1) were increased in peripheral blood from patients and decreased on the treatment, whereas activated T lymphocytes increased after therapy in those with better overall survival.
Conclusions In conclusion, blood concentration of MDSCs and Treg cells may be good prognostic markers for overall survival after 2 years in R/R DLBCL. These results point to a possible role of these elements in the immunosuppression of these patients, as assessed by the circulating activated and inhibited T lymphocytes, and therefore, they may be considered as therapeutic targets in DLBCL.
- biomarkers
- tumor
- immunomodulation
- immunotherapy
- myeloid-derived suppressor cells
- immunity
- Cellular
Data availability statement
Data are available on reasonable request. Anonymised data are available on reasonable request.
This is an open access article distributed in accordance with the Creative Commons Attribution Non Commercial (CC BY-NC 4.0) license, which permits others to distribute, remix, adapt, build upon this work non-commercially, and license their derivative works on different terms, provided the original work is properly cited, appropriate credit is given, any changes made indicated, and the use is non-commercial. See http://creativecommons.org/licenses/by-nc/4.0/.
Statistics from Altmetric.com
Introduction
Diffuse large B-cell lymphoma (DLBCL) is the most common non-Hodgkin’s lymphoma, representing about 30%–40% of new cases.1 Approximately, one-third of DLBCL patients develops relapsed/refractory (R/R) disease after standard therapies, that include rituximab.2 The standard second-line treatment in R/R DLBCL is salvage chemotherapy (CT), followed by autologous stem cell transplantation (ASCT). In most cases, however, patients relapse after ASCT or are not eligible for transplantation due to ineffective salvage treatment.3
At this point, rituximab, gemcitabine, dexamethasone, and cisplatin (R2-GDP) schedule, which includes lenalidomide combined with R-GDP, was used in R/R DLBCL patients in the study ‘phase II clinical trial to evaluate the combination of lenalidomide with R-GDP in patients diagnosed with R/R DLBCL not candidates for high-dose CT and hematopoietic progenitor cell transplantation’ (EudraCT Number: 2014-001620-29), performed by the Spanish Lymphoma Oncology Group (GOTEL). Lenalidomide is an immunomodulatory drug derived from thalidomide and its functions have been extensively described, mainly increasing T cell immune responses against tumors4 and in combination with rituximab, overcoming its resistance in patients with indolent B-cell and mantle cell lymphomas who were previously rituximab resistant.5
Some studies have evaluated alternative schedules to ASCT or first-line treatments since the outcome of both R/R patients is poor. The largest retrospective research to characterize overall response rates (ORR) and overall survival (OS) in the refractory DLBCL subpopulation is the SCHOLAR-1 study that communicated an ORR of 26% (7% of complete responses) and OS of 6.3 months.6 Specifically, rituximab has been combined with other schedules,7 8 showing more than 60% of ORR and a good OS in elderly patients after three or more years. Lenalidomide combined with rituximab (R2) has already been tested in R/R DLBCL patients. Phase II clinical trials concluded that R2-CHOP could improve the response and outcome of patients after six cycles of treatment.9 10 R2 has also been tested alone,11 showing interesting activity. In addition, a phase 1b study from GELTAMO group showed an ORR of 78.9% and an OS of 63% after 2 years combining lenalidomide with R-ESHAP.12
Considering the heterogeneity of the disease, the dismal prognosis of elderly R/R DLBCL patients and the different clinical outcomes reached,13 the search for new biomarkers may be considered as a research priority. Some prognostic markers have been widely described and tested in DLBCL, such as the International Prognostic Index (IPI) or the most recent revised version in the rituximab era (R-IPI), the immunohistochemical or molecular findings as those defining double and triple hit DLBCL, among others. Furthermore, the immune system seems to play an important role in this disease.1 In this context, expansion of myeloid-derived suppressor cells (MDSCs) has been found in the tumor microenvironment (TME) and in peripheral blood (PB). MDSCs orchestrate potent immune effects favoring tumor escape and have been correlated with poorer clinical outcomes in many neoplastic diseases.14 15
Tumor cell-mediated suppression causes immune disruptions, including altered hematopoiesis. This results in a considerable expansion and accumulation of immature myeloid cells (IMCs) in the TME, in secondary lymphoid organs and tissues, driven by tumor-derived growth factors and others via STAT1, STAT3, STAT6, COX2 or the NF-κB pathway.15 As a consequence, tumor prevents IMCs to follow their differentiation to normal cells, such as neutrophils, monocytes, and dendritic cells, and induce their activation, which finally confer them immunosuppressive properties. For this reason, activated IMCs were proposed to be called as MDSCs by Gabrilovich et al.16 MDSCs consist of monocytic (M-MDSCs) and granulocytic (G-MDSCs) precursors that mainly inhibit T cell immune responses using different mechanisms such as reactive oxygen species or nitrogen oxide production. MDSCs also promote angiogenesis via VEGF and suppress innate immune responses by inhibiting maturation and functions of natural killer cells and inducing macrophages into their M2 phenotype by interleukin 10 (IL-10) and transforming growth factor (TGF)-β secretion.14 15 Moreover, MDSCs also contribute to tumorous dissemination by inducing regulatory T cells (Tregs).17 Tregs inhibit immune responses through different mechanisms such as IL-10, TGF-β and IL-35 production or IL-2 recruitment.17 18 Nevertheless, the prognostic role of Tregs in DLBCL remains controversial.19 20
In the last few years, immune activation and inhibitory checkpoint molecules have emerged as promising biomarkers in cancer. In this sense, OX40 promotes effector T cell expansion and functions after its binding to OX40L, induced on antigen-presenting cells (APCs) such as dendritic cells, B cells or macrophages.21 By contrast, Programmed Death-1 (PD-1) binds to PD-L1 or PD-L2, expressed on APCs and tumor cells, to generate inhibitory signals that downregulate T cell-mediated immune responses.22 In fact, the interaction between PD-1 and its ligands is being promising to develop checkpoint blockade immunotherapies in B-cell lymphomas.23
In this work, we aimed to analyze M-MDSCs, G-MDSCs and total MDSCs in PB, Tregs and activated OX40 +PD-1- and inhibited PD-1 +OX40 T cells, in R/R DLBCL patients treated with the R2-GDP schedule, paying special attention, and comparing the immune profile evolution in two groups, choosing the landmark of 24 months of OS as clinical outcome of interest (OS <24 months vs OS >24 months groups). We also compared this immune profile before starting treatment with healthy donors (HD). The results obtained here support the hypothesis that consider these immune cells as promising prognostic biomarkers in DLBCL and, even more, these data point to MDSCs and Tregs as potential therapeutic targets to overcome immunosuppression in R/R DLBCL.
Material and methods
Patients
We have studied immune cells of PB from 79 patients diagnosed of R/R DLBCL who were not high-dose CT and ASCT candidates recruited from 18 Spanish hospitals for the R2-GDP-GOTEL study (EudraCT Number: 2014-001620-29), between April 2015 and September 2018. Patients were treated with R2-GDP, based on lenalidomide +R GDP. In July 2020, an age-matched group of 10 women and 10 men was recruited as HD from the Virgen Macarena University Hospital.
Flow cytometry analysis in whole blood samples
Three PB analyses were carried out: basal, cycle 3 and end of induction. MDSCs, Tregs, OX40 +PD-1- and PD-1 +OX40+T cells were measured by flow cytometry using the FACSCanto II flow cytometry system (Becton Dickinson) from EDTA-K3 tubes and gated as shown in figure 1. M-MDSCs were gated as CD45+CD11b+CD33+HLA-DRlow/−CD14+CD15− and G-MDSCs as CD45+CD11b+CD33+HLA-DRlow/−CD14−CD15+. Tregs were determined as CD4+CD25highCD127low/-, activated T cells as CD3+CD4+OX40+PD-1− and CD3+CD8+OX40+PD-1− and inhibited T cells as CD3+CD4+PD-1+OX40−and CD3+CD8+PD-1+OX40−. The absolute number was calculated by multiplying the percentages obtained from flow cytometry with total leukocyte count obtained from hematologic count (Sysmex CS-1000). Total MDSCs were calculated as the sum of M-MDSC and G-MDSC counts, total activated T cells as the sum of CD3+CD4+OX40+PD-1− and CD3+CD8+OX40+PD-1− T cell counts, and total inhibited T cells as the sum of CD3+CD4+PD-1+OX40− and CD3+CD8+PD-1+OX40− T cell counts.
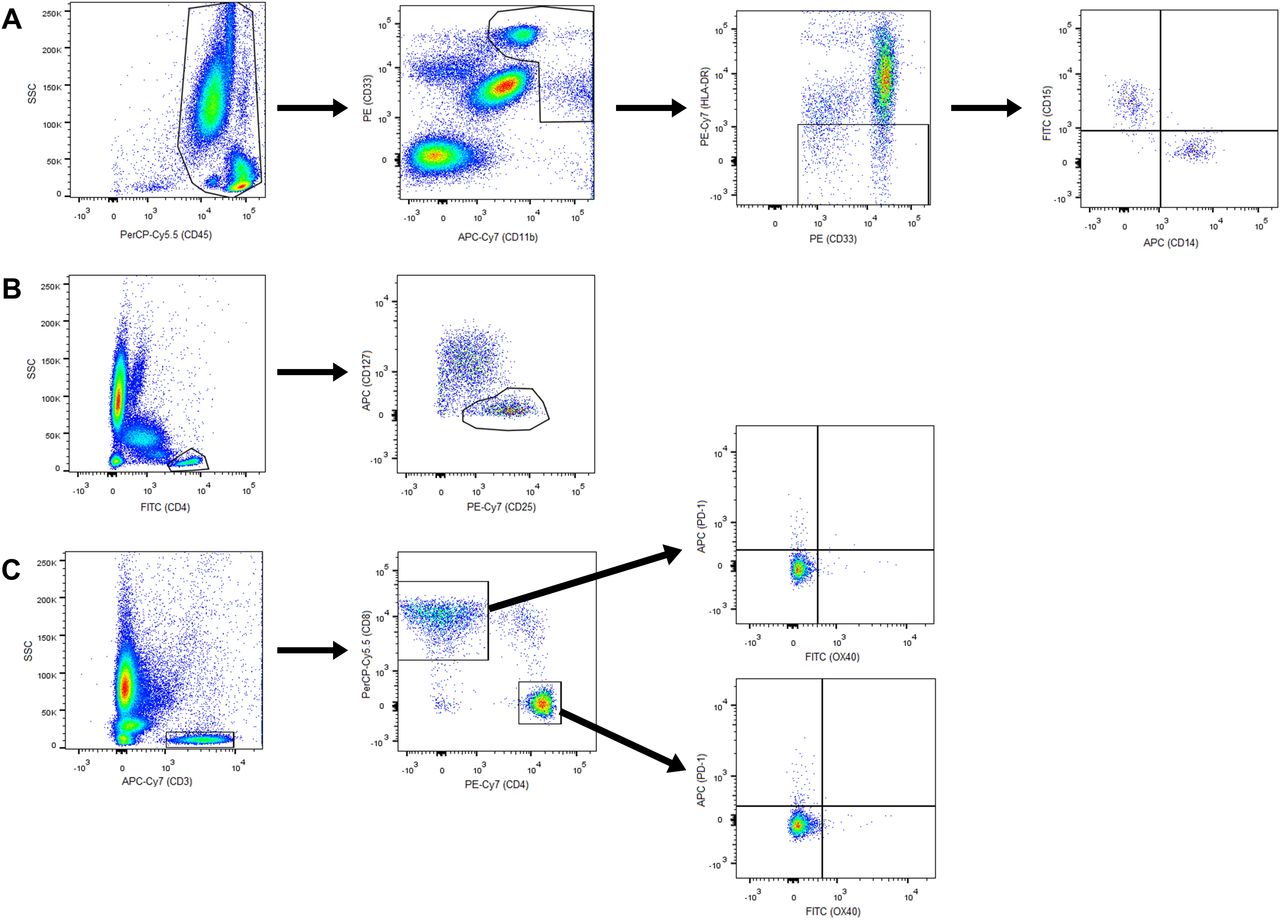
Gating of cell populations by flow cytometry. (A) M-MDSCs and G-MDSCs; (B) regulatory T cells; (C) CD4+ and CD8+, activated and inhibited T cells. APC, antigen-presenting cells; G-MDSCs, granulocytic myeloid derived suppressor cells; M-MDSCs, monocytic MDSCs.
Monoclonal antibodies
Antibodies were obtained from Becton Dickinson Immunocytometry Systems (San Jose, California, USA) and were used at the manufacturer’s recommended concentrations.
MDSCs: PerCP-Cy5.5 Mouse anti-human CD 45 (ref no. 564105), APC-Cy7 rat anti-CD11b (ref no. 557657), PE mouse anti-Human CD 33 (ref no. 555450), PE-Cy7 mouse anti-human HLA-DR (ref no. 560651), FITC mouse anti-human CD 14 (ref no. 555397) and APC mouse anti-human CD 15 (ref no. 551376).
Tregs: Human Treg cocktail (ref no. 560249), including PerCP Mouse Anti-Human CD4, PE mouse anti-Human CD127, and FITC anti-human CD25.
Activated and inhibited T cells: FITC Mouse anti-human OX-40 (CD134) (ref no. 555837), PerCP-Cy5.5 mouse anti-human CD8 (ref no. 565310), PE-Cy7 mouse anti-human CD4 (ref no. 557852), APC mouse anti-human PD-1 (CD279) (ref no. 558694), APC-H7 mouse anti-human CD3 (ref no. 560176).
Data analysis
Statistical analysis was performed by SPSS V.25.0 software package (SPSS). Normal distribution of analyzed variables was checked by watching histogram, box plot, Q-Q plot and the outcomes of normality tests of Shapiro-Wilk.
Due to absence of normality, non-parametric tests were used. Mann-Whitney U test was used to compare basal cells distributions of patients with HD, and CR with PD patients. Wilcoxon test was used to compare cells distribution of patients in basal with cycle 3, and basal with end of induction. Data shown are median and 95% CIs. Bivariate correlations among cell populations were carried out using Spearman coefficient. Statistically significant differences were considered at p≤0.05. Data are available on reasonable request.
Results
Clinical characteristics of R/R DLBCL patients
From April 2015 to September 2018, a total of 79 patients diagnosed of R/R DLBCL not candidates for ASCT were recruited from 18 Spanish hospitals. Patients had to have received previously an R-CHOP-like schedule and might have an ECOG ≤1. They were treated with the R2-GDP schedule, based on lenalidomide, R-GDP, and granulocyte colony-stimulating factor.
Information about OS included 24 patients with OS >24 months and 52 patients with OS <24 months. Their clinical characteristics are summarized in table 1. During July 2019, 20 subjects were recruited as HD from the Virgen Macarena University Hospital. Similar age (median) and sex ratio were found in HD: 68.2 years old and 50% male/female ratio.
Clinical characteristics of R/R DLBCL patients
Number of patients analyzed
Information about basal condition was not obtained in four patients from a total of 79. Thus, the number of patients analyzed before treatment was 75. In cycle 3, some patients had to be taken out from the trial due to adverse effects or death and 42 blood samples were analyzed in this cycle. Finally, 30 patients were analyzed at the end of the induction. All the HD subjects (20) were included in the analysis.
For the OS analysis, 3 patients of 79 were not included due to lack of data. For this reason, we focused this analysis in the 76 remaining patients (24 patients with OS >24 months and 52 with OS <24 months). Before treatment, all patients with OS >24 months and 48 of 52 patients with OS <24 months were analyzed (the four remaining patients corresponded to those in which basal information could not be retrieved). In cycle 3, 18 patients with OS >24 months and 21 patients with OS <24 months were studied. Finally, at the end of the induction, 12 patients with OS >24 months and 15 patients with OS <24 months were analyzed.
Blood MDSC number in R/R DLBCL patients before and after treatment
M-MDSC and G-MDSC subsets, and total MDSC levels were higher in R/R DLBCL patients before starting R2-GDP therapy compared with HD, as shown in figure 2A. P values were p=0.005 for M-MDSCs and p<0.001 in both G-MDSCs and total MDSCs.

M-MDSCs, G-MDSCs and total MDSCs in the R2-GDP-GOTEL clinical trial. (A) Cell concentrations before treatment compared with healthy donors (HD); (B) evolution of MDSCs during basal (B), cycle 3 (C3) and end of induction (EOI) involving all patients recruited; (C) evolution of M-MDSCs in patients with overall survival (OS) >24 months and OS <24 months during B, C3 and EOI; (D) evolution of G-MDSCs in patients with OS >24 months and OS <24 months during B, C3 and EOI; (E) evolution of total MDSCs in patients with OS >24 months and OS <24 months during B, C3 and EOI. All data shown are medians and 95% CIs of cells/L. #P≤0.05, ##p≤0.01, ###p≤0.001 comparing opposite subject groups, respectively; *p≤0.05, **p≤0.01 compared with basal, respectively. G-MDSCs, granulocytic myeloid derived suppressor cells; GOTEL, Spanish Lymphoma Oncology Group; M-MDSCs, monocytic MDSCs; R2-GDP, rituximab, gemcitabine, dexamethasone, and cisplatin; R/R DLBCL, relapsed/refractory diffuse large B-cell lymphoma.
Both M-MDSC and G-MDSC populations decreased considerably during treatment in PB (figure 2B). After induction, there were statistically significant differences compared with basal in M-MDSCs (p=0.026), G-MDSCs (p=0.007) and total MDSCs (p=0.007). Furthermore, there was a positive correlation between circulating M-MDSCs and G-MDSCs before (rS=0.289; p=0.015) and after the treatment (rS=0.520; p=0.005), as shown in figure 3A1,B1, respectively.
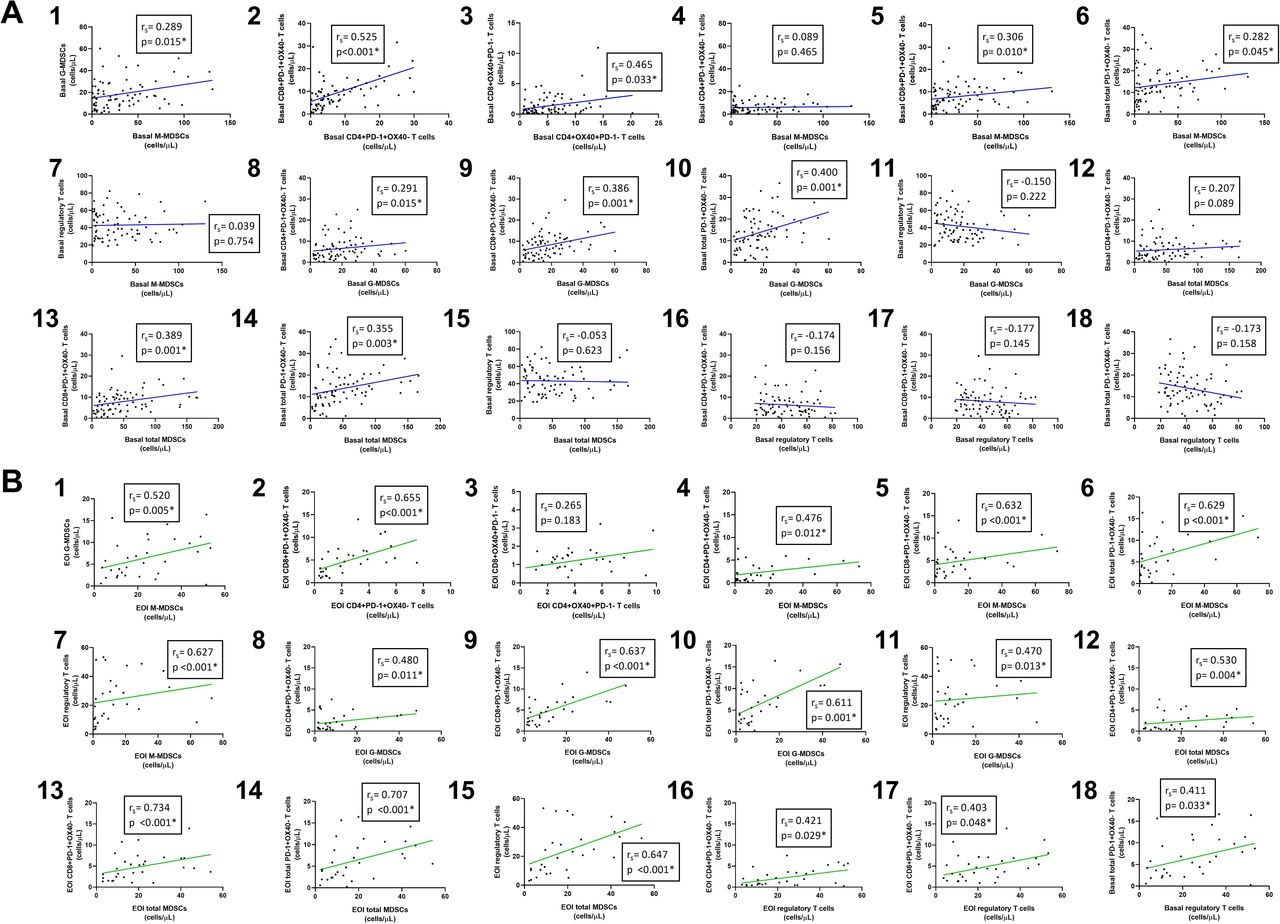
Correlations between cell populations using non-parametric Spearman test. (A) Correlations before treatment (blue lines); (B) correlations after treatment (green lines). EOI, end of induction; MDSCs, myeloid derived suppressor cells.
These changes in the number of MDSCs were due to the effect on patients with OS >24 months, since a significant low level of M-MDSC and G-MDSC subsets was found in these patients at the end of the induction compared with basal status (p=0.034 and p=0.005, respectively), while they were increased in those with OS <24 months. As a result, total levels of MDSCs were also significantly lower in the first group of patients (p=0.004), as shown in figure 2C–E. After treatment, statistically significant differences were found in M-MDSCs (p<0.001), G-MDSCs (p=0.009) and total MDSCs (p<0.001) between both groups.
Blood Treg number in R/R DLBCL patients before and after treatment
Concentration of Tregs was significantly higher in R/R DLBCL patients than that in healthy subjects (p=0.003), as shown in figure 4A. However, as observed in MDSCs, Treg levels were significantly reduced during the therapy when all patients were included in the analysis (p=0.002; figure 4B). Tregs in PB were remarkably reduced in patients with OS >24 months at cycle 3 (p=0.005) and at the end of the induction (p<0.001) but remained constant in those with lower OS (figure 4C). Statistically significant differences were also found between these groups at cycle 3 and the end of the induction (p=0.008 and p<0.001, respectively).
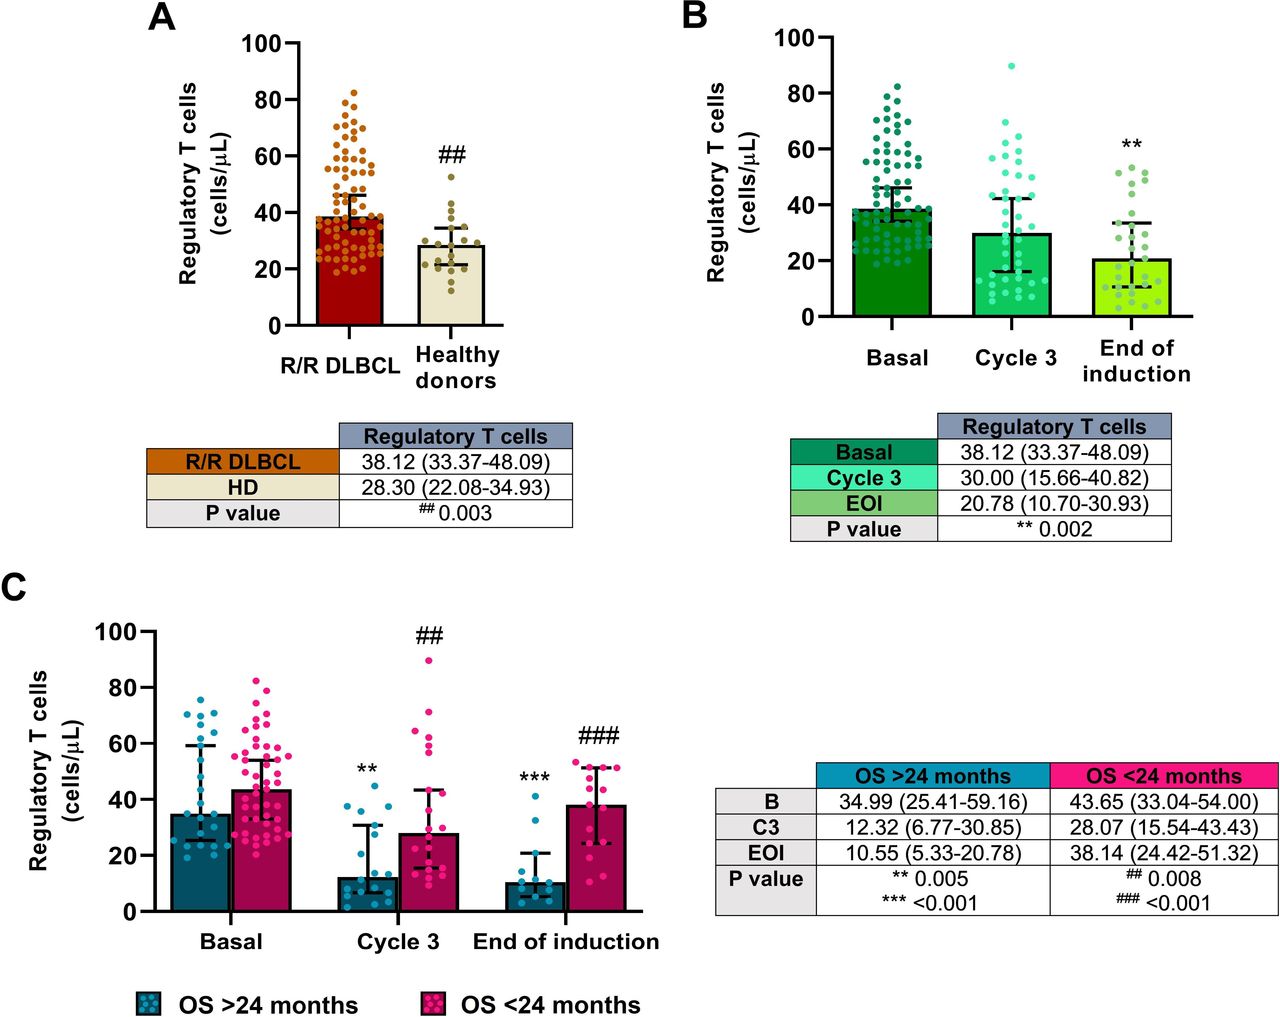
Tregs in the R2-GDP-GOTEL clinical trial. (A) Cell concentrations before treatment compared with HD; (B) evolution of Tregs during B, C3 and EOI involving all patients recruited; (C) evolution of Tregs in patients with OS >24 months and OS <24 months during B, C3 and EOI. All data shown are medians and 95% CIs of cells/L. ##P≤0.01, ###p≤0.001 comparing opposite subject groups, respectively; **p≤0.01, ***p≤0.001 compared with basal, respectively. EOI, end of induction; GOTEL, Spanish Lymphoma Oncology Group; HD, healthy donors; OS, overall survival; R2-GDP, rituximab, gemcitabine, dexamethasone, and cisplatin; R/R DLBCL, relapsed/refractory diffuse large B-cell lymphoma.
Blood inhibited T cell number in R/R DLBCL patients before-and-after treatment
Concentrations of CD4+, CD8+, and total inhibited (PD-1 +OX40-) T cells were notably higher in the patients before the induction compared with HD (p=0.004 in CD4+ and p<0.001 in both CD8+ and total inhibited T cells), as shown in figure 5A.
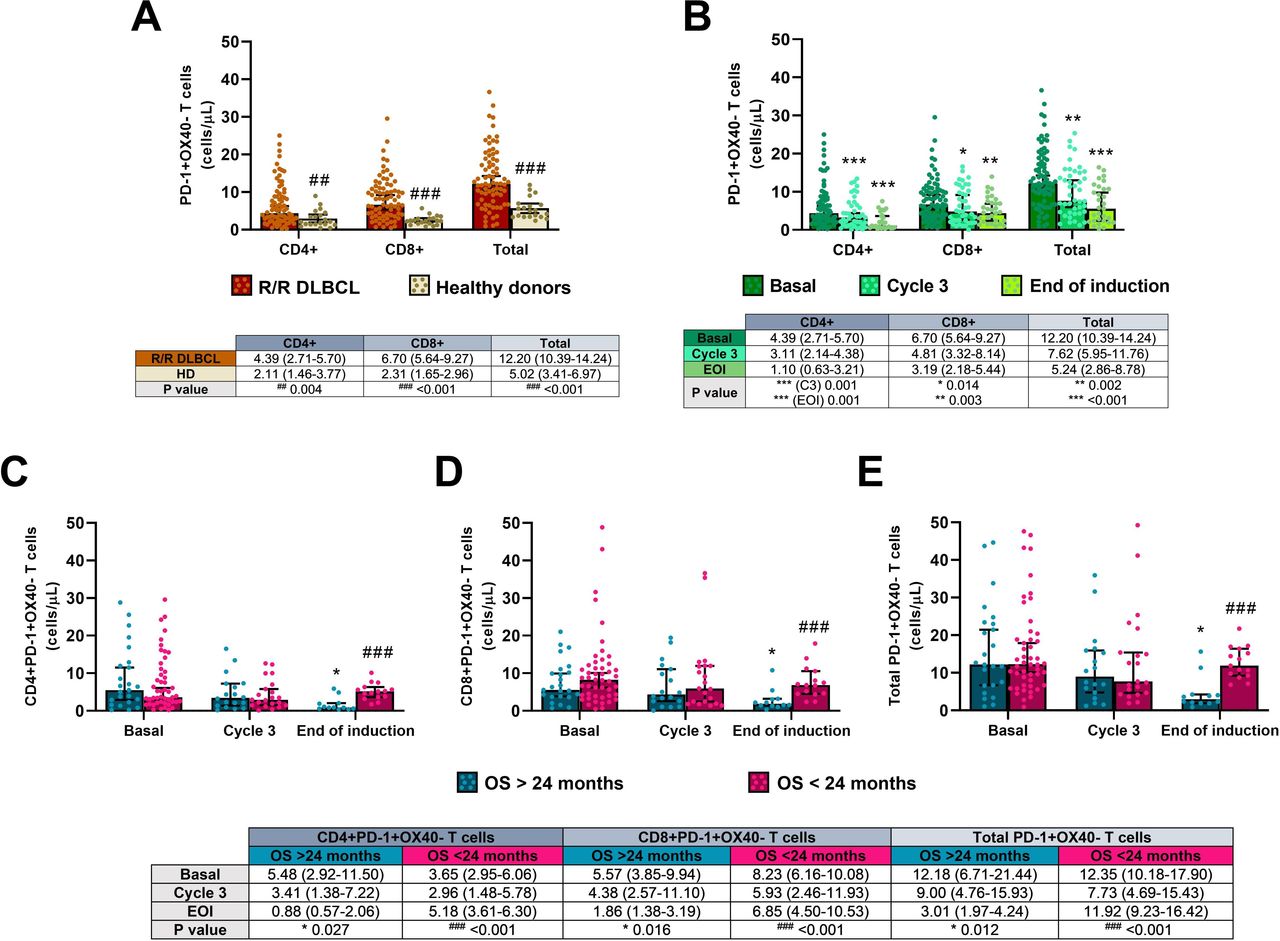
Inhibited PD-1 +OX40 T cells in the R2-GDP-GOTEL clinical trial. (A) Cell concentrations before treatment compared with HD; (B) evolution of inhibited T cells during B, C3 and EOI involving all patients recruited; (C) evolution of inhibited CD4+T cells in patients with OS >24 months and OS <24 months during B, C3 and EOI; (D) evolution of inhibited CD8+T cells in patients with OS >24 months and OS <24 months during B, C3 and EOI; (E) evolution of total inhibited T cells in patients with OS >24 months and OS <24 months during B, C3 and EOI. All data shown are medians and 95% CIs of cells/L. ##P≤0.01, ###p≤0.001 comparing opposite subject groups, respectively; *p≤0.05, **p≤0.01, ***p≤0.001 compared with basal, respectively. EOI, end of induction; GOTEL, Spanish Lymphoma Oncology Group; HD, healthy donors; OS, overall survival; R2-GDP, rituximab, gemcitabine, dexamethasone, and cisplatin; R/R DLBCL, relapsed/refractory diffuse large B-cell lymphoma.
All inhibited T cells dropped significantly after R2-GDP when recruited patients undertook the treatment collected for this analysis (figure 5B). Significant differences in PB cells between basal and the end of the induction were found in inhibited CD4+ (p=0.001), CD8+ (p=0.003) and total PD-1 +OX40+T cells (p<0.001), although statistical differences were also found between basal and cycle 3 in the three cell populations (p=0.001, p=0.014 and p=0.002, respectively). A positive correlation between circulating CD4+ and CD8+ inhibited T cells were also found before (rS=0.525, p<0.001) and after treatment (rS=0.655, p<0.001), as shown in figure 3A2,B2, respectively.
Levels of inhibited T cells were significantly diminished after treatment in patients with better OS (p=0.027 in CD4+, p=0.016 in CD8+, and p=0.012 in total inhibited T cells comparing the end of the induction with the basal condition), while cell concentrations remained constant during treatment in the group of worse OS, as shown in figure 5C–E. In this case, there were also statistically significant differences between the two groups of patients after treatment (p<0.001 in all CD4+, CD8+, and total inhibited cells).
Blood activated T cell number in R/R DLBCL patients before and after treatment
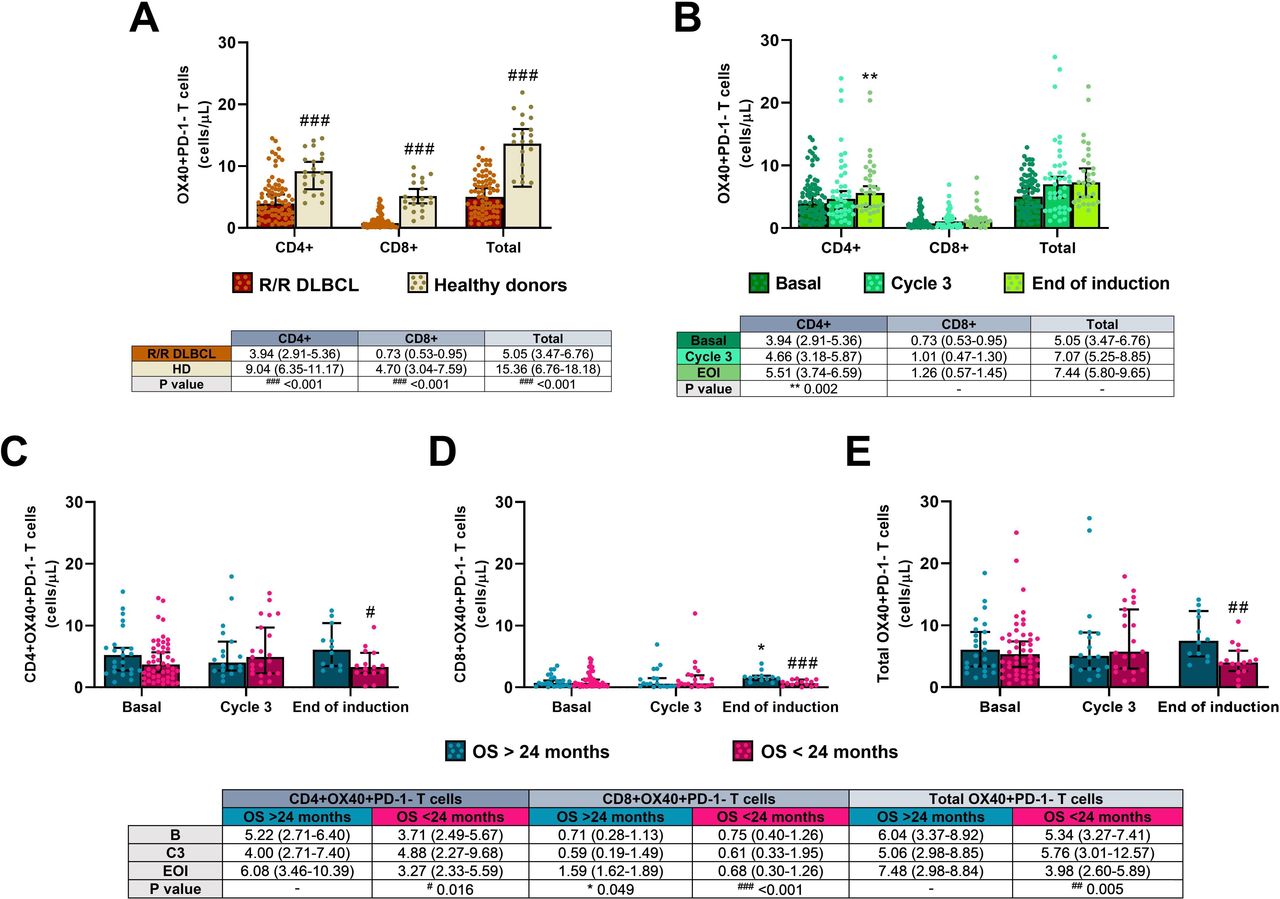
Concentrations of CD4+, CD8+, and total activated (OX40 +PD-1-) T cells were lower in all patients before starting treatment compared with the healthy cohort (p<0.001 in all three cases), as shown in figure 6A.

Activated OX40 +PD-1− T cells in the R2-GDP-GOTEL clinical trial. (A) Cell concentrations before treatment compared with HD; (B) evolution of activated T cells during B, C3 and EOI involving all patients recruited; (C) evolution of activated CD4+ T cells in patients with OS >24 months and OS <24 months during B, C3 and EOI; (D) evolution of activated CD8 +T cells in patients with OS >24 months and OS <24 months during B, C3 and EOI; (E) evolution of total activated T cells in patients with OS >24 months and OS <24 months during B, C3 and EOI. All data shown are medians and 95% CIs of cells/L. #P≤0.05, ##p≤0.01, ###p≤0.001 comparing opposite subject groups, respectively; *p≤0.05, **p≤0.01 compared with basal, respectively. EOI, end of induction; GOTEL, Spanish Lymphoma Oncology Group; HD, healthy donors; OS, overall survival; R2-GDP, rituximab, gemcitabine, dexamethasone, and cisplatin; R/R DLBCL, relapsed/refractory diffuse large B-cell lymphoma.
All activated T cells analyzed were increased throughout treatment when all recruited patients were included in the analysis (figure 6B). Significant differences in circulating cells between basal and the end of the induction were only found in CD4+ activated T cells (p=0.002), but not in CD8+ and total activated T cells (p=0.123 and p=0.088, respectively). Furthermore, there was a positive correlation between the levels of activated CD4+ and CD8+T cells before the treatment (rS=0.465; p=0.033), but not at the end (rS=0.265; p=0.183), as shown in figure 3A3,B3, respectively.
Concentrations of activated T cells increased during treatment in patients with OS >24 months, while a decrease trend was found in patients with OS <24 months. Significant differences between basal condition and the end of the treatment were only found in activated CD8+ T cells from the better OS group (p=0.049; figure 6D) and between the two groups at the end of the induction in CD4+, CD8+ and total activated T cells (p=0.016, p<0.001 and p=0.005 in figure 6C–E, respectively).
Discussion
In the last decades, the heterogeneity of DLBCL and its poor outcome, especially in the R/R setting, have led to seek different prognosis factors that may predict the clinical outcome of patients, such as IPI or R-IPI, immunohistochemical or molecular tools, micro-RNAs and even vitamin D determinations. Nevertheless, the composition of the TME also seems to be a promising prognostic factor. In this regard, the stromal signature composed by monocyte/macrophage infiltrates has been correlated with a good prognostic in DLBCL, while stromal signature composed by factors that promote angiogenesis and blood vessel density has been correlated with a worse prognosis.24 Although monocyte infiltrate is associated with a better outcome, monocytes with a low HLA-DR expression have been correlated with more aggressive DLBCLs and progression,25 like immunosuppressive CD14 +HLA DR low/- monocytes mediated by the arginine metabolism in PB of B-cell non-Hodgkin’s lymphoma patients, considered as a phenotypically different population of monocytes from MDSCs,26 that also express CD33 and CD11b, among others.15
Due to the high variety of monocytes, which give them plasticity, M-MDSCs show a close relationship with other monocyte subsets. Canè et al reviewed that common monocyte progenitors (CMPs) are differentiated into some types of cells, such as inflammatory monocytes, M-MDSCs or other immature monocytes. Particularly, CMPs can be differentiated into M-MDSCs via VEGF by upregulating ARG1 and iNOS through NF-kB and elements related to hypoxia, avoiding their maturation to normal monocytes, macrophages, or dendritic cells (although M-MDSCs could also become APCs by inflammation-induced activation of p53).27 In addition, M-MDSCs have a close connection with tumor-associated macrophages (TAMs), which are present in a high (M2 phenotype) and a low (M1 phenotype) proportion in the TME, while M1 macrophages are predominant in healthy individuals. In this sense, M-MDSCs can also prevent their differentiation to mature cells maintaining the STAT3 activity; however, because of the effects of hypoxia, STAT3 activity can be highly reduced in the TME, leading the differentiation from M-MDSCs to TAMs.15
In our work, R/R DLBCL patients from the R2-GDP-GOTEL trial showed increased baseline levels of M-MDSCs, G-MDSCs and, consequently, total MDSCs in PB compared with HD. Therefore, tumor escape and immunosuppression mediated by MDSCs seem evident before receiving treatment, as described in other studies.26 28–30 Azzaoui et al were the first authors to study both M-MDSCs and G-MDSCs in PB of DLBCL patients at diagnosis, and they also found higher levels of these subsets in comparison with HD.29 Their conclusions included an interest in monitoring these cell populations during the course of the treatment. Thus, we decided to monitor MDSCs in all patients and put the focus in the two main populations (M-MDSCs and G-MDSCs) with better (>24 months) and worse (<24 months) OS. To our knowledge, this is the first time that circulating MDSCs are monitored during the follow-up of patients in DLBCL. Patients with OS >24 months showed a significant reduction in all MDSC populations, whereas the group with the worse OS experienced an increase in MDSC levels. At the end of the induction, there were also significant differences between the two OS groups in all MDSCs levels. These findings confirm that a decrease of MDSC levels is correlated with a better OS, improving the clinical outcome.
As previously mentioned, MDSCs induce T cells to their regulatory phenotype. Nevertheless, the role of Tregs in cancer seems to be uncertain since they have been associated with both good and poor prognosis, possibly due to environmental factors, tumor-derived products, and cytokine production that may affect Treg generation, recruitment and survival.31 Specifically, in DLBCL, Treg levels can also vary due to the location (TME and PB) or the phenotype (germinal center B-cell like (GCB) and ABC/non-GCB).20 Furthermore, Tregs can be gated in different ways, but commonly CD4+CD25+ and CD127- or FOXP3 +must be included. Chang et al explained that Tregs gated as CD4+CD25+ in PB of DLBCL patients lead the tumor escape in the disease.20
In the R2-GDP-GOTEL study, we have found that immunosuppression may not be mediated only by MDSCs, but also by Tregs, as this T cell subset was also higher in PB of patients before starting therapy in comparison with healthy subjects. Baraka and Salem gated Tregs as CD4+CD25+FOXP3+ and obtained similar results between 45 B-cell non-Hodgkin’s lymphoma patients (including 15 with DLBCL) and 20 healthy subjects.32 Yin et al quantified CD4+CD25+CD127- Tregs from 56 patients with DLBCL and 26 healthy controls and obtained similar results.33 Chang et al measured CD3+FOXP3+Tregs and also found higher levels of cells in 77 patients with the disease compared with 30 HD.20 By contrast, low concentrations of CD4+CD25highFOXP3+ and CD4+CD25highCD127lowFOXP3+ Tregs in PB have also been observed in patients compared with healthy subjects,19 34–36 which has generated some controversy that still needs to be clarified.
In terms of response and OS, the role of Tregs in DLBCL also remains unclear and different conclusions have been extracted. Despite no differences have been found before and after treatment in some cases,19 35 other studies have elucidated an increase of Tregs.33 34 36 In our case, R2-GDP therapy induced a decrease of circulating Tregs in patients with OS >24 months, following a similar trend to that observed in MDSCs, while Tregs were found constant in the other group of patients throughout treatment. At the end of the therapy, significant differences between OS groups were also found. Based on these results, the immunosuppression caused by accumulation of Tregs in PB was diminished in patients with the best clinical outcome, reaching Treg values of HD. Pollari et al gated Tregs as CD4+FOXP3+ and FOXP3 +T-Bet+cells and only the last population was associated with a poor outcome in testicular DLBCL.37 In combination with rituximab, lenalidomide has caused the depletion of Tregs in responding patients with indolent B-cell and mantle cell lymhpomas5 and an increase irrespective of the response to the treatment in R/R primary DLBCL of the central nervous system.38
In addition to their regulatory functions, T cells can stimulate or inhibit the immune responses by inducing the expression of surface markers, such as OX40 and PD-1, respectively.39 In the R/R DLBCL patients from the R2-GDP-GOTEL study, we could establish that immunosuppression was also mediated by significant high levels of PD-1 +OX40 T cells and low levels of OX40 +PD-1- T cells compared with healthy subjects. The clinical outcome improved in patients when CD4+, CD8+, and total inhibited T cells significantly decreased and all activated T cell populations increased in PB, while a reverse trend was found in the group of patients with inferior OS. At the end of the induction, statistically differences were found between the groups in both activated and inhibited T cell levels, what represent quite promising results according to the clinical outcome. Although PD-1 +T cells in tissue seem to be favorable prognostic factors in DLBCL,40 41 higher concentrations of CD4+PD-1+T cells in PB have been associated with a low treatment efficacy and poor event-free survival and OS.42 43 Lenalidomide has also demonstrated to remarkably reduce PD-1 expression on T cells in patients with chronic lymphocytic leukemia.44 On the other hand, OX40 has been found in the TME of DLBCL patients in a low proportion compared with PD-1 and has been positively correlated with a better prognosis.45 Our results further support those results and highlight the importance of the findings in PB not only to monitor the OS, but also the clinical response. In fact, we previously reported preliminary results in which circulating MDSCs were reduced in R/R DLBCL patients with clinical benefit (CB) using the R2-GDP schedule46 and now we are showing similar results according to the 2 year-OS. In the same line, our group also reported the depletion of MDSCs in CB patients in advanced breast cancer.47 48 Those results suggest the importance of the drop in the levels of MDSCs irrespective of the therapy used.
The results we are discussing here are also supported by the positive correlations among MDSCs, Tregs and PD-1 +OX40 T cells in the R/R DLBCL patients (correlation data shown in figure 3), making clear that these cell populations have immunosuppressive functions and shape a complex network that could be dismantled by an active immune response. In this sense, tumor-infiltrating lymphocytes play an important role since their functions can be enhanced by immunotherapies, such as R2-GDP in R/R DLBCL. Currently, modern immunotherapy has definitely proved to be beneficial to oncohematological patients, since its efficacy in terms of OS impact has been demonstrated in a wide variety of tumors with different biological origin and clinical behavior.49
In conclusion, the research of this study has been focused on potential cell biomarkers found in PB of patients with R/R DLBCL monitoring the OS up to 24 months using R2-GDP as an immunotherapeutic schedule. We have demonstrated a significant depletion of MDSCs and Tregs in patients with OS >24 months. Consequently, both cell populations could be potential therapeutic targets to overcome immunosuppression in R/R DLBCL, especially in the case of MDSCs, since their role in cancer seems to be clearer. In fact, the decrease in MDSCs may contribute to the increase in activated OX40 +PD-1-, and the decrease in inhibited PD-1 +OX40 T cells in DLBCL.
Even though a limitation of this work could be the sample size of the study, it should be considered the high statistically significance found in the concentration of the different cell populations depending on the OS group. Nevertheless, additional studies are required to confirm these results.
In any case, our data support the hypothesis that MDSCs are good predictive markers of OS in R/R DLBCL patients and the consistent data of positive correlations of MDSCs with Tregs and inhibited T lymphocytes points to a possible immunoregulatory role of MDSCs in R/R DLBCL patients, that could therefore be considered as a target for immunotherapy.
Data availability statement
Data are available on reasonable request. Anonymised data are available on reasonable request.
Ethics statements
Acknowledgments
We thank the patients and their families for their commitment and the persons from the healthy cohort for their voluntariness. We also want to thank to Rosso-Fernández Clara M. and Borreguero Borreguero I. from the CTU-HUVR; Clinical Trials Unit, Hospital Universitario Virgen del Rocío. Spanish Clinical Research and Clinical Trials Platform (SCReN,PT13/PT17/0017/0012). Finally, we want to acknowledge the help and compromise of Armando Ortega Cejas (former Celgene medical advisor).
References
Footnotes
Twitter @Luis De la Cruz Merino
Contributors All authors contributed in obtaining data, analysis and revision of the manuscript.
Funding This study was sponsored by the Spanish Lymphoma Oncology Group (GOTEL) with support of Celgene.
Competing interests None declared.
Provenance and peer review Not commissioned; externally peer reviewed.