Article Text

Abstract
Background Programmed cell death ligand 1 (PD-L1) expressed on tumor and immune cells are both associated with the response to programmed cell death 1 (PD-1) pathway blockade therapy. Here, we examine the role of CD8+PD-L1+ tumor-infiltrating lymphocyte (Tils) in the tumor microenvironment of non-small cell lung cancer (NSCLC).
Methods Tumor tissue samples of a total of 378 patients from two NSCLC cohorts were collected retrospectively. Tumor genetic variations were measured by targeted next-generation sequencing of 543 oncogenes. Tils were assessed by multiplex immunohistochemistry assay. Correlations among Tils, tumor genetic variations, and clinicopathological characteristics were analyzed.
Results The levels of CD8+PD-L1+ Tils varied in NSCLC tumor tissues. Tumor samples with high CD8+PD-L1+ Tils had higher levels of CD8+ Tils, CD68+ macrophages, PD-L1+ tumor cells, PD-1+ Tils, and CD163+ M2-type macrophages, and also had a higher tumor mutation burden, all of which collectively constituted a typically hot but immunosuppressive tumor microenvironment. Therefore, in a non-immunotherapy cohort, we observed that the higher the CD8+PD-L1+ Tils level in the tumor tissue, the worse the prognosis (progression-free survival; cohort A, stage I–II tumor; p=0.005). Contrarily, in an immunotherapy cohort, where the immune suppression was blocked by anti-PD-1 treatment, the higher the CD8+PD-L1+ Tils level, the better the response to the anti-PD-1 treatment (complete response/partial response vs stable disease/progressive disease; cohort B; p=0.0337).
Conclusions CD8+PD-L1+ Tils may be an indicator of the hot but immunosuppressive tumor microenvironment which is related to a high tumor mutation burden. PD-1 pathway blockade therapy can help to mitigate this immunosuppression and obtain better curative effects.
- lymphocytes
- tumor-infiltrating
- tumor microenvironment
- lung neoplasms
Data availability statement
Data are available upon reasonable request.
This is an open access article distributed in accordance with the Creative Commons Attribution Non Commercial (CC BY-NC 4.0) license, which permits others to distribute, remix, adapt, build upon this work non-commercially, and license their derivative works on different terms, provided the original work is properly cited, appropriate credit is given, any changes made indicated, and the use is non-commercial. See http://creativecommons.org/licenses/by-nc/4.0/.
Statistics from Altmetric.com
Background
Tumor immunotherapy has been progressing rapidly in non-small cell lung cancer (NSCLC), especially those block the immunosuppressive programmed cell death 1 (PD-1) and programmed cell death ligand 1 (PD-L1) axis.1 Several clinical studies have shown that anti-PD-1/PD-L1 pathway therapies achieved durable clinical responses with unprecedented survival rates.2 3 However, only a fraction of patients benefits from this therapy. Clinical-relevant biomarkers which can predict the response to immunotherapies will allow early selection of responders and provide opportunity for timely intervention of treatment strategies.
Currently, criteria for the selection of patient for anti-PD-1/PD-L1 pathway therapy in clinical practice with NSCLC is majorly based on PD-L1 expression level on tumor cells (TC).4 5 More recently, in some tumor types like esophageal cancer and gastric cancer, the PD-L1 test has been evolved to a combined proportion score (CPS) that includes the expression of PD-L1 on both TC and immune cells.6 7
It is well known that PD-L1 can be expressed on a variety of tumor-infiltrating immune cells, such as T cells, B cells, NK cells, macrophages, and dendritic cells.8–11 However, in practice, these cells of different types are often collectively referred to as immune cells to calculate the CPS of PD-L1 expression, although their biological functions are divergent. In view of this, some studies have begun to dissect the clinical significance of different types of PD-L1 positive immune cells. In NSCLC, Liu et al reported that PD-L1 was highly expressed on macrophages in the tumor microenvironment, and elevated PD-L1 in macrophages was an independent predictor of better overall survival of anti-PD-1 therapy.12 In addition to macrophages, this study found that other immune cells also expressed PD-L1 at a high level, such as CD8+ tumor-infiltrating lymphocytes (Tils).12 While the expression of PD-1 (the receptor for PD-L1) by CD8+ Tils is more common and has been studied more thoroughly,13 the clinical significance of high PD-L1 expression on CD8+ Tils has not been evaluated so far.
In another study with mouse models of pancreatic cancer, Diskin et al found that the upregulation of PD-L1 expression on Tils may be related to the immune process of tumor antigen promotion and recognition.14 The engagement of PD-L1 on Tils will promote self-tolerance via the suppression of neighboring macrophages and effector Tils.14 Together, those new discoveries imply an important role of PD-L1 positive CD8+ Til in clinical practice, which is worthy of investigation. Here, in this study, first, we determined the frequency of PD-L1 positive CD8+ Tils in NSCLC tissue samples. Then, we analyzed the characteristics of the immune microenvironment where these cells were located and their association with tumor genome mutation status. Finally, we evaluated the impact of these cells on the outcomes of both non-immunotherapy and immunotherapy for NSCLC.
Methods
Patient cohorts and samples
This study included a total of 378 patients with NSCLC from two cohorts, who had received treatment at the First People’s Hospital of Yunnan Province from November 2011 to November 2019. Cohort A (328 cases) received non-immunotherapy (Surgery, EGFR-TKIs, chemotherapy, etc.), and cohort B (50 cases) received immunotherapy (anti-PD1, and anti-PD1 plus chemotherapy). Clinical and pathological data, including age at diagnosis, gender, smoking history, tumor pathological type, clinical stage, epidermal growth factor receptor (EGFR) mutation status, and therapy was collected in accordance with study protocol requirements (online supplemental table 1) and online supplemental table 2). Patients with ALK or ROS1 translocation were not included in this study. The workflow of this study was shown in online supplemental figure 1. Patient’s paraffin-embedded tumor tissue was collected to examine immune microenvironment by immunohistochemistry (IHC) staining and to identify tumor genetic variations by next-generation sequencing. The paraffin-embedded tissue blocks were stored at low temperature (−80°C) before use. All of the tissue sections were cut from paraffin-embedded tissue blocks just before starting the experiment.
Supplemental material
Supplemental material
Supplemental material
Immunohistochemical staining of PD-L1, CD8, PD-1, CD68, and CD163
Two tissue sections of each case were used for immunohistochemical staining of CD8, PD-L1, CD68, CD163, and PD-1. Section 1 was used for double fluorescence costaining of CD8 and PD-L1. Section 2 was used for traditional diaminobezidin (DAB) staining of PD-L1, and the staining result was also used as a reference and quality control for the fluorescent staining result of PD-L1 on section 1. An additional section 3 from samples in cohort A was used for multiplex fluorescence costaining of CD8, CD68, CD163, and PD-1. The sections were stained in multiple batches. The identification and control of batch-to-batch differences were based on quality control samples with known positive degrees of each marker derived from a lung adenocarcinoma tissue, a lung squamous cell carcinoma tissue, and a tonsil tissue from autopsy.
For multiplex fluorescence immunohistochemical staining, paraffin-embedded tissue blocks were serially sectioned into 3 µm sections. Subsequently, a series of processing and staining was performed on the slides according to the kit instruction (Opal 7-Color IHC Kit, NEL797B001KT, PerkinElmer) as described in our previous study,15 including epitope retrieval, endogenous peroxidase and protein blocking, antigen labeling, and tyramide signal amplification (TSA) visualization. CD8 antibody (clone 144B, ab17147, Abcam; dilution 1:25), PD-L1 antibody (clone SP142, Ventana; dilution 1:25), CD68 antibody (clone KP1, ZM-0060, Zsbio; dilution 1:400), CD163 antibody (clone 10D6, ZM0428, Zsbio; dilution 1:200), and PD-1 antibody (clone CAL20, ab237728, Abcam; dilution 1:100) were used as primary antibodies in this study. For section 1, TSA visualization was performed with the fluorophores DAPI (nucleus), Opal 540 (CD8), and Opal 690 (PD-L1). For section 3, the fluorophores were 4’,6-diamidino-2-phenylindole (DAPI) (nucleus), Opal 520 (CD8), Opal 570 (CD68), Opal 620 (CD163), and Opal 690 (PD-1). Slides were scanned using the PerkinElmer Vectra (Vectra V.3.0.5, PerkinElmer). Multispectral images were unmixed using spectral libraries built from images of single-stained tissue samples for each reagent using inForm Advanced Image Analysis software (inForm V.2.3.0, PerkinElmer). The “tumor mask” related function of inForm software was used to define the tumor compartment on the sections. 20 representative multispectral images were selected as training samples to build algorithm (tissue segmentation, cell segmentation, phenotyping tool, and positivity score) using inForm software. Then, the algorithm was applied to batch analysis of all the images. Next, the infiltration levels of CD8+, CD8+PD-L1+, PD-1+, CD8+, CD8+PD-1+, CD68+, CD68+PD-1+, CD68+CD163+, CD163+, and CD163+PD-1+ cells were determined by the proportion of positive cells to total cells in the tumor compartment. Two pathologists confirmed the quality and results of the experiment.
For traditional DAB immunohistochemical staining, paraffin-embedded tumor tissue samples were sectioned at a thickness of 4 µm and transferred to coated glass slides. For PD-L1 staining on section 2, the slides were stained with a Ventana GX automated system (Ventana, AZ, USA). The primary antibody specific for PD-L1 (clone SP142) was diluted 1:25 and incubated for 32 min at room temperature. The antibody was detected with the Ventana Amplification Kit and Ventana ultraView Universal DAB Detection Kit. Digital images were captured using an Aperio Scanscope AT Turbo slide scanner with 20× magnification. Scoring of PD-L1 expression was performed using a digital image analysis software, namely, Aperio Membrane V.9 and Aperio Genie Classifier. PD-L1 expression was reported as a continuous variable of the percentage of TC staining with any intensity. PD-L1 expression in each sample was classified as PD-L1 negative, low, or high. PD-L1 negative was defined as <1% of TC staining. PD-L1 high was defined as ≥50% of TC staining. PD-L1 low was defined as 1%–49% of TC staining. These scoring systems were based on previous studies using an SP142 assay.3 16 17
DNA extraction and targeted gene capture sequencing
DNA extraction from the formalin-fixed and parrffin-embedded (FFPE) tumor specimens and targeted gene capture sequencing for the tumor mutational burden (TMB) test were performed using the standard protocols mentioned previously.18 A total of 2 mL of whole blood was collected from each patient, and DNA from the peripheral blood lymphocytes was extracted as a normal control. DNA libraries were captured with a designed Genescope panel of 543 genes (Genecast, Beijing, China) which are mainly tumor-related genes and cover 1.7 Mb of the entire genome. The captured samples were subjected to Illumina NovaSeq 6000 platform using the pair-end sequencing method.
Bioinformatics pipeline
Paired-end reads generated from the NovaSeq 6000 platform were sorted, filtered, and indexed with sequence alignment/map (SAM) tools. To identify somatic single nucleotide polymorphism (SNP) and indel mutations, the obtained binary alignment/map (BAM) files from both tumor tissues and peripheral blood lymphocytes of each patient were processed for pairwise variant calling using VarScan (V.2.4.2)19 with the following parameters. (i) The minimum coverage for calling somatic variants in the peripheral blood lymphocyte samples was either 8×, or 6× for calling in tumor tissue samples; the p value threshold to call a somatic site was 0.05. (ii) Variants with <90% strand bias were kept for further study. The generated candidate mutations were annotated using Annovar software tools,20 and the database for nonsynonymous SNPs' functional predictions (dbNSFP) and Exome Aggregation Consortum (ExAC) database was used to filter out either the benign mutations with pp2_hdiv score <0.452 or the population polymorphic sites. Finally, the resulting non-synonymous mutations at the exonic regions were kept. During the software working procedure, three main sources of bias that induce the extraneous variability of the sequencing read depth, which included the guanine and cytosine (GC) content, target footprint size and spacing, and the repetitive sequences, were also evaluated and corrected.
Tumor mutation burden analysis
The TMB was defined as the number of somatic, coding, base substitutions, and indel mutations per megabases of the genome examined. Only the regions with sequencing depth larger than 100× after deduplication were taken into TMB calculation. All base substitutions and indels in the coding region of the targeted genes, including synonymous alterations, were initially counted before filtering as described above. Alterations that were predicted to be germline by the somatic-germline-zygosity algorithm were not counted. Known germline alterations in dbSNP were not counted. Germline alterations occurring with two or more counts in the ExAC database were not counted.21 To calculate the TMB per megabases, the total number of mutations counted was divided by the size of the coding region of the targeted territory. TMB was reported as a continuous variable. According to the TMB levels, the patients were divided into high, moderate, and low groups. The grouping criteria were based on the 75th percentile and 25th percentile of this batch of data. Then, TMB levels greater than or equal to the 75th percentile was defined as high. TMB levels less than the 25th percentile were defined as low, and the moderate levels occurred between the 25th and 75th percentiles.
Statistical analyses
Statistical analyses were conducted using GraphPad Prism (V.8.2.0, La Jolla, CA, USA), SPSS (V.22.0, SPSS, Chicago, IL, USA), and R software (V.3.5.1, http://www.r-project.org). Progression-free survival (PFS) was defined as the length of time from the date that therapy started to the date of disease progression, with 95% CIs calculated using the Kaplan-Meier method. Between-group comparisons in survival analysis were performed using the log rank test and further verified by the multivariate Cox analysis. The Mann-Whitney test was used to compare difference between two groups. The Kruskal-Wallis test was used to compare difference between multiple groups. All tests were two-sided and p<0.05 was considered significant unless otherwise specified.
Results
High infiltration of CD8+PD-L1+ Tils is related to a hot tumor-type but with an immunosuppressive microenvironment
The CD8+PD-L1+ Tils are common in NSCLC tissues. Figure 1A shows an example of adenocarcinoma tissues infiltrated by CD8+PD-L1+ Tils. The infiltration levels of those cells in cohort A ranged from a minimum of 0% to a maximum of 15%. The median frequency was 0.13% (IQR: 0.01%–0.77%). Only 23% of the NSCLC samples showed no such cells, which were reported as 0%. Correlation analysis showed that there was a weak positive correlation between the CD8+PD-L1+ Tils and the overall CD8+ Tils (Spearman r=0.5243, p<0.0001), as well as between the CD8+PD-L1+ Tils and the CD8+PD-L1− Tils (Spearman r=0.3114, p<0.0001) (online supplemental figure 2A,B). In contrast, the CD8+PD-L1− Tils had a strong positive correlation with the overall CD8+ Tils (Spearman r=0.9426, p<0.0001) (online supplemental figure 2C).
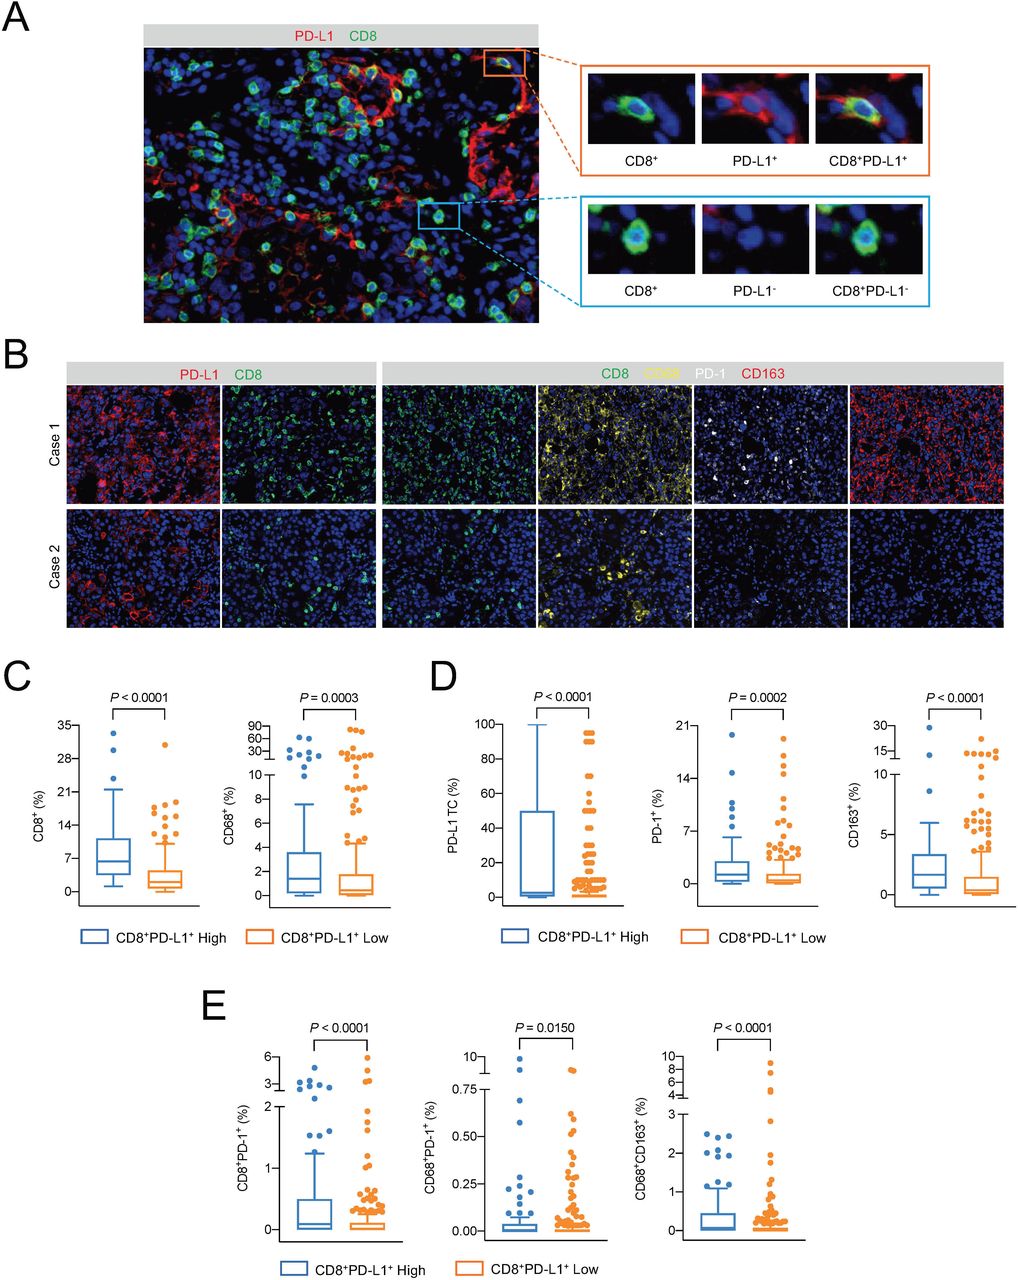
Evaluation of CD8+PD-L1+ Tils infiltration and related immune microenvironment. (A) Representative image of CD8+PD-L1+ Tils on a section from a lung adenocarcinoma sample by multiplex immunohistochemical staining. 20× (left) and 40× (right) magnification under the objective lens. (B) Representative images of the immune microenvironment of the CD8+PD-L1+ Tils high group (case 1) and low group (case 2). 10× magnification under the objective lens. (C and D). The differences in CD8+ cells (C), CD68+ cells (C), PD-L1+ tumor cells (D), PD-1+ cells (D), and CD163+ cells (D) between the high-level and low-level groups of CD8+PD-L1+ Tils, respectively. Mann-Whitney U test. (E) The differences in CD8+PD-1+ cells, CD68+PD-1+ cells, and CD68+CD163+ cells between the CD8+PD-L1+ Tils high and low groups, respectively. Mann-Whitney U test. TC, tumor cell.
According to the quartile values of the overall infiltration level, we classified the samples from cohort A into CD8+PD-L1+ Tils high (infiltration levels within the top 25%) and low (the rest samples) groups. Figure 1B shows representative images of the immune microenvironments of CD8+PD-L1+ Tils high group (case 1) and low group (case 2). The levels of total CD8+ cells and CD68+ (macrophage) cells in the CD8+PD-L1+ Tils high group were significantly higher than those in the CD8+PD-L1+ Tils low group (p<0.0001, p=0.0003) (figure 1C). However, the expression levels of immune checkpoint molecules PD-L1 and PD-1, as well as the level of CD163+ M2 macrophages, were also significantly higher in the environment of the CD8+PD-L1+ Tils high group than the low group (p<0.0001, p=0.0002, p<0.0001) (figure 1D). Based on the classification result of tumor PD-L1 expression by traditional IHC test, further analysis showed that the levels of total CD8+ Tils, CD8+PD-L1+ Tils, and CD8+PD-L1− Tils in the PD-L1 high group were higher than those in the PD-L1 negative group. However, only the level of CD8+PD-L1+ Tils in the PD-L1 low group was significantly higher than that in the PD-L1 negative group, the levels of total CD8+ Tils and CD8+PD-L1− Tils were not significantly different between the two groups (online supplemental figure 3).
A study of pancreatic cancer in mouse models found that the engagement of PD-L1 on CD8+ cells with PD-1 on the neighboring CD8+ cells can lead to a decrease in the antitumor ability of both cell types.14 Our results from cohort A showed that the level of CD8+PD-1+ Tils in the CD8+PD-L1+ Tils high group was significantly higher than that in the low group (p<0.0001) (figure 1E). Meanwhile, the level of CD68+PD-1+ cells in the CD8+PD-L1+ Tils high group was higher than that in the low group (p=0.0150) (figure 1E). CD68+PD-1+ macrophages would convert to the M2 type with impaired antigen producing ability when engaging with the PD-L1 molecule on CD8+PD-L1+ Tils.14 Indeed, we found in cohort A that the level of CD68+CD163+ M2 type macrophages was significantly higher in the CD8+PD-L1+ Tils high group than that in the low group (p<0.0001) (figure 1E).
High infiltration of CD8+PD-L1+ Tils is associated with high tumor mutation burden
Previous study reported that the expression of PD-L1 on Tils is modulated by tumor antigens.14 To investigate whether there is an association between the infiltration of CD8+PD-L1+ Tils and tumor antigens in NSCLC tumors, we performed deep sequencing with a panel of 534 tumor-related genes on 123 samples from cohort A and analyzed the tumor mutation spectrum and the total mutation burden. The landscape of tumor mutation spectrum, CD8+PD-L1+ Tils infiltration, and TMB levels was shown in figure 2A.
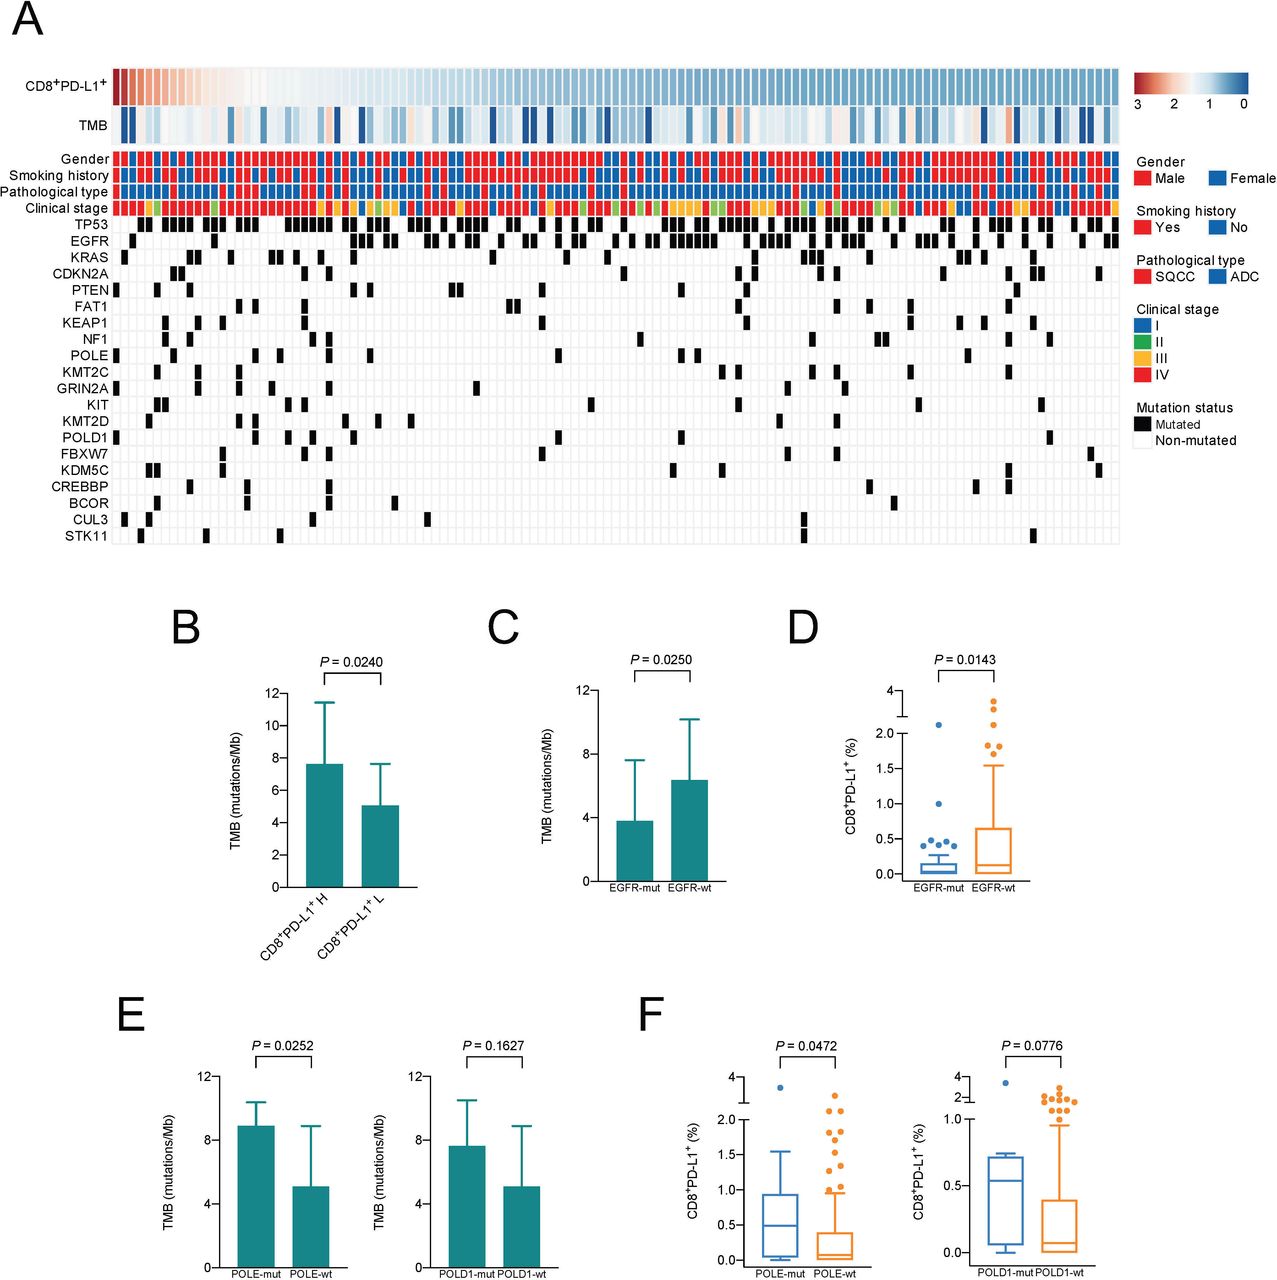
Association between CD8+PD-L1+ Tils infiltration and tumor neoantigen burden. (A) Landscape of the tumor mutation spectrum, CD8+PD-L1+ Tils infiltration, and the TMB levels of 123 cases. (B) Difference in TMB between the CD8+PD-L1+ Tils high and low groups. Mann-Whitney U test. (C–F) Differences in TMB (C, E) and CD8+PD-L1+ Tils infiltration (D, F) between the mutant and wild-type groups of EGFR, POLE, and POLD1, respectively. Mann-Whitney Utest.SQCC, squamous cell carcinoma; ADC, adenocarcinoma; H, high; L, low; Mut, mutation; Wt, wild type.
The CD8+PD-L1+ Tils high group has a significantly higher mutation burden than the low group (p=0.0240) (figure 2B). As shown in figure 2C and D, the levels of TMB and CD8+PD-L1+ Tils in the EGFR mutated group were significantly lower than those in the EGFR wild-type group (p=0.0250, p=0.0143) (figure 2C–D). On the other hand, mutations in DNA polymerase coding genes, DNA polymerase epsilon (POLE) and polymerase δ catalytic subunit gene 1 (POLD1), will cause a large number of genetic variations in tumors, which will in turn lead to the production of a large number of new antigens.22 23 In order to verify whether the neoantigen-related tumor gene mutations are associated with CD8+PD-L1+ Tils infiltration, we analyzed the levels of TMB and CD8+PD-L1+ Tils between POLE or POLD1 mutated group and wild-type group. TMBs of the POLE and POLD1 mutant groups were indeed higher than those of the wild-type group (p=0.0252 and p=0.1627, respectively) (figure 2E), and the level of CD8+PD-L1+ Tils of the POLE mutant group was also higher than that of the wild-type group (p=0.0472) (figure 2F). The difference in the levels of CD8+PD-L1+ Tils between POLD1 mutant and wild-type groups exhibited a similar trend, although not statistically significant (p=0.0776) (figure 2F).
High infiltration of CD8+PD-L1+ Tils is associated with poor clinical outcome of non-immunotherapy
To determine whether the infiltration of CD8+PD-L1+ Tils will affect the prognosis of patients receiving non-immunotherapy, we analyzed the prognostic difference between the CD8+PD-L1+ Tils high and low groups in patients diagnosed at different stages, including stage I–II patients treated with surgical resection, stage IV patients treated with EGFR-TKIs, and stage IV patients treated with chemotherapy in cohort A. Analysis on the relationship between CD8+PD-L1+ Tils infiltration and clinical characteristics revealed that the levels of CD8+PD-L1+ Tils infiltration were higher in patients younger than 61 years old and in stage IV patients (online supplemental figure 4A,C), but it was not associated with gender, smoking history, or tumor pathological type (online supplemental figure 4E). In order to determine whether the EGFR mutation status affected the age-related result, we divided the ≥61 group and the <61 group into four groups. There was no significant difference in the levels of CD8+PD-L1+ Tils between the “≥61, EGFR mut” group and the “≥61, EGFR wt” group (p>0.9999), as well as between the “<61, EGFR mut” group and “<61, EGFR wt” group (p>0.9999) (online supplemental figure 4B). Similar results were found in the groups related to clinical stage (online supplemental figure 4D). In stage I–II patients treated with surgical resection, the PFS time of patients in the CD8+PD-L1+ Tils high group was significantly shorter than that of patients in the low group (HR=2.09, p=0.0198) (figure 3A). Multivariate analysis incorporating clinical characteristics showed that a high level of CD8+PD-L1+ Tils is an independent predictor of a short PFS time (HR=3.24, p=0.005) (figure 3B). However, there was no significant difference in the PFS time between CD8+PD-L1+ Tils high and low groups of stage IV patients receiving either targeted therapy or chemotherapy (p=0.4709 and p=0.4727, respectively) (online supplemental figure 5A,B).

CD8+PD-L1+ Tils infiltration related survival analysis in patients receiving non-immunotherapy. (A) Kaplan-Meier survival graph comparing differences in progression-free survival time of stage I–II patients after surgery between the CD8+PD-L1+ Tils high and low groups. Log rank test. (B) The forest plot of multivariate survival analysis of progression-free survival time of stage I–II patients after surgery. H, high; L, low; SQCC, squamous cell carcinoma; ADC, adenocarcinoma.
High infiltration of CD8+PD-L1+ Tils is associated with a good response to anti-PD-1 therapy
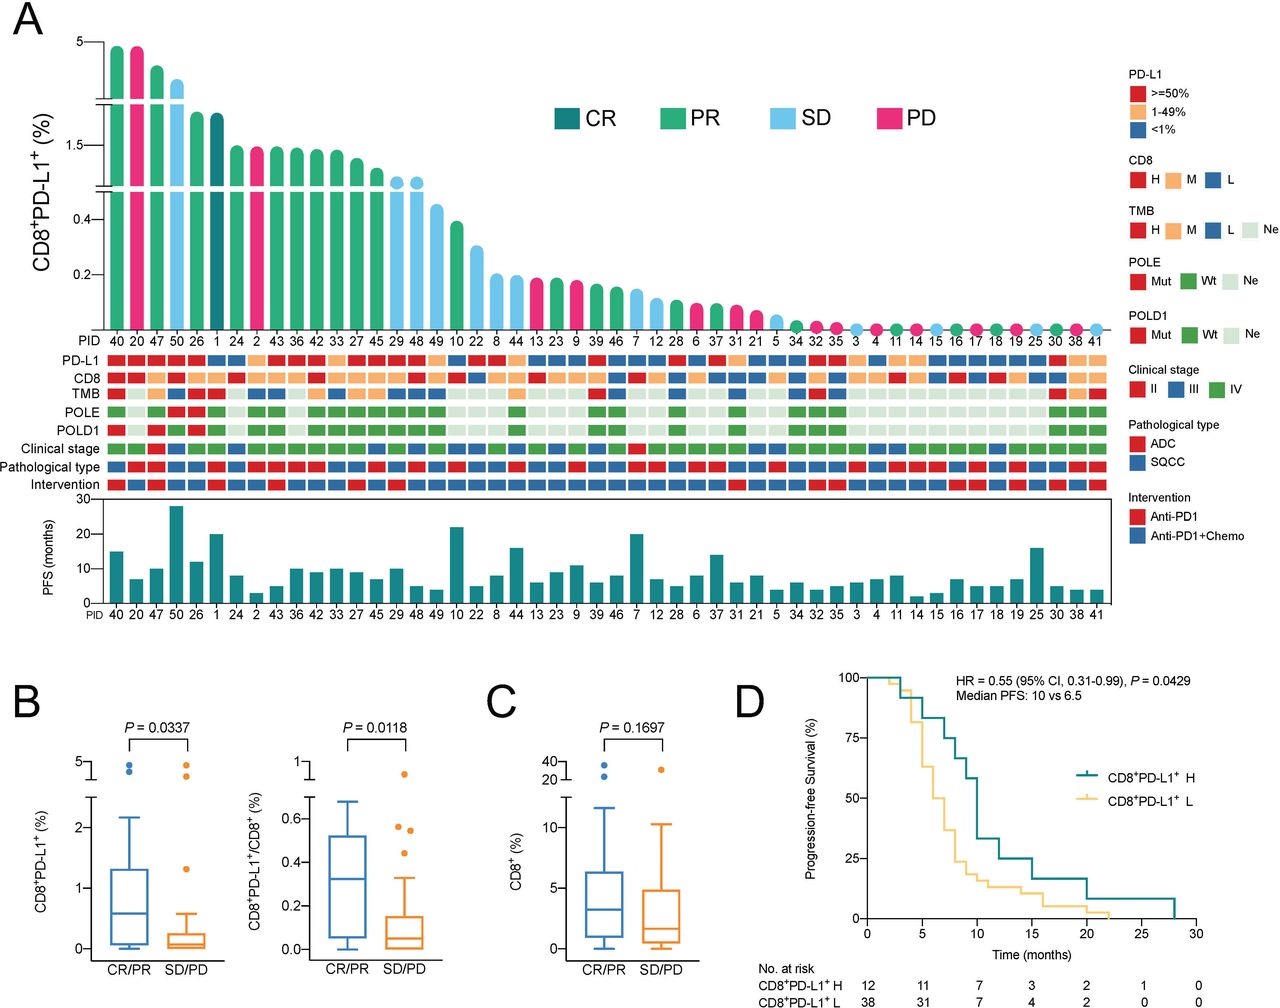
In order to verify our speculation that patients with a high degree of CD8+PD-L1+ Tils infiltration may be more suitable for immunotherapy, we investigated the relationship between the level of CD8+PD-L1+ Tils and the efficacy of anti-PD-1 treatment in patients in cohort B. All patients in this cohort were EGFR wild-type, 25 cases of which were with lung adenocarcinoma and the other 25 cases with lung squamous cell carcinoma. 14 patients received PD-1 inhibitor monotherapy and 36 received a combination treatment with PD-1 inhibitor plus chemotherapy. The efficacy of treatment was evaluated as objective tumor response: 1 case achieved CR (complete response), 21 cases achieved PR (partial response), 14 cases had SD (stable disease), and 14 patients had PD (progressive disease).
Figure 4A shows a landscape of the treatment efficacy and the corresponding gene mutation information and other clinical characteristics of all patients ranked by the infiltration level of CD8+PD-L1+ Tils. The overall level of CD8+PD-L1+ Tils and their proportion in the total CD8+ Tils were higher in the CR/PR group than the SD/PD group (p=0.0337, p=0.0118) (figure 4B). In 20 patients without detectable PD-L1+ TC, there was a similar trend, although the difference was not significant (p=0.1307, p=0.1072) (online supplemental figure 6). In terms of the level of total CD8+ Tils, there was no significant difference between the CR/PR group and the SD/PD group (p=0.1697) (figure 4C). The PFS time of each patient was shown in figure 4A. In general, the PFS time of patients in the CD8+PD-L1+ Tils high group was longer than that of patients in the low group (HR=0.55, p=0.0429) (figure 4D).
Association between CD8+PD-L1+ Tils infiltration and response to anti-PD-1 therapy. (A) Landscape of CD8+PD-L1+ Tils infiltration and responses to anti-PD-1 therapy. (B) Differences in CD8+PD-L1+ Tils infiltration and its proportion in the total CD8+ Tils between the CR/PR and the SD/PD groups of all patients. Mann-Whitney U test. (C) Differences in CD8+ Tils infiltration between the CR/PR and the SD/PD groups of all patients. Mann-Whitney U test. (D) Kaplan-Meier survival graph comparing differences in progression-free survival time of cohort B between the CD8+PD-L1+ Tils high and low groups. Log rank test. CR, complete response; PD, progressive disease; PR, partial response; SD, stable disease. For CD8 and TMB: H, high (≥75% percentile); M, moderate (25% percentile–75% percentile); L, low (<25% percentile); Ne, no evaluation; Mut, mutation; Wt, wild type; ADC, adenocarcinoma; SQCC, squamous cell carcinoma; Chemo, chemotherapy. For CD8+PD-L1+ Tils: H, high (≥75% percentile); L, low (<75% percentile).
From the perspective of the tumor immune microenvironment (TIME) classification based on the levels of PD-L1 expression and CD8+ Tils, the result showed that the difference in ORR rate ((CR+PR) / (CR+PR+SD+PD)) was significant between groups with different levels of CD8+PD-L1+ Tils or groups with different TIME (PD-L1/CD8) type (p=0.0439, p=0.0192) (online supplemental table 3). However, this difference was not significant between groups with different levels of PD-L1 expression or CD8+ Tils (p=0.1030, p=0.5090). Interestingly, the ORR rate of the PD-L1-high and CD8-high group was lower than that of the PD-L1-high and CD8-moderate/low group and the PD-L1-low/negative and CD8-high group (40% vs 67% and 71%, respectively) (online supplemental table 3). In addition, among the five CR/PR patients (cases 1, 23, 33, 34, and 46) in the PD-L1-low/negative and CD8-moderate/low group, two patients (cases 1 and 33) had high level of CD8+PD-L1+ Tils (figure 4A).
Supplemental material
The responses were expected to be different in anti-PD-1 plus chemotherapy compared with anti-PD-1 monotherapy. The result showed that the response rates of these two treatment groups were different, but relatively close. The ORR rate of the monotherapy group was 50.0%, and that of the anti-PD-1 plus chemotherapy group was 42%. There was no significant difference in PFS between these two treatment groups (online supplemental figure 7).
Of the 50 patients in cohort B, 25 received genetic mutation analysis. Among them, patient 26 carries POLE and POLD1 mutations, patients 40 and 47 carry POLD1 mutations, and patient 50 carries POLE mutations. The amount of CD8+PD-L1+ Tils in all these four patients’ tumors was at a high level (figure 4A), and the anti-PD-1 treatments achieved good therapeutic effects. The tumor responses to immunotherapy in these four patients were PR (patient 26), PR (patient 40), PR (patient 47), and SD (patient 50), respectively (figure 4A).
Discussion
Several mechanistic studies have examined the function of PD-L1 expressed on T cells in mouse models,24 25 but there is still a gap between the understanding of the biological functions and the clinical implications of PD-L1 positive immune cells. In this study, we evaluated the lymphocytic infiltration status and clinical significance of PD-L1 positive CD8+ Tils in 378 NSCLC tumors and found that this kind of cells were very common in tumor tissues. High levels of CD8+PD-L1+ Tils infiltration were associated with poor clinical outcomes of non-immunotherapy but were related to good responses to anti-PD-1 therapy.
Our study found that CD8+PD-L1+ Tils were common in NSCLC tissues, though the overall level was relatively low, ranging between 0% and 15%. This is similar to a previous study reporting an average PD-L1 positive rate at about 4%–5%. With our clinical data, we found that tumors with high CD8+PD-L1+ Tils infiltration had more total CD8+ Tils and CD68+ macrophages, which made the tumors immunologically hot ones (figure 1). Previous research reported that the prognosis of hot tumors with more Tils infiltration, especially CD8+ Tils, turns out to be good.26 27 Our study showed that the correlation between the CD8+PD-L1+ Tils and the overall CD8+ Tils was weak, so the CD8+PD-L1+ Tils cannot be regarded as a marker of the entire CD8+ Tils. We also found that tumors with more CD8+PD-L1+ Tils also had higher levels of PD-L1/PD-1 expression and more immunosuppressive M2 type CD163+ macrophages (figure 1). Especially, in the TC PD-L1 low group, the level of CD8+PD-L1+ Tils was significantly higher than that in the negative group, which indicated that the main CD8+ cell subgroup associated with the inflammation-induced PD-L1 expressing TC might be CD8+PD-L1+ Tils in the microenvironment. Therefore, the overall tumor microenvironment with more CD8+PD-L1+ Tils may be in a strongly immunosuppressive state, which will act against the prognosis after traditional treatment. A prognostic analysis on patients undergoing surgical treatment in stage I–II confirmed our speculation that higher levels of CD8+PD-L1+ Tils in tumor tissue are related to a short PFS time of NSCLC patients (figure 3).
Diskin et al found in mouse models of pancreatic cancer that the engagement of PD-L1 on CD8+ Tils with PD-1 on either CD8+ Tils or CD68+ macrophages could inhibit the function of both CD8+PD-L1+ and CD8+PD-1+ Tils, and reduce the antigen-producing ability of CD68+ macrophages.14 Their result indicated that the poor prognosis of patients with CD8+PD-L1+ Tils may also be related to the infiltration of CD8+PD-1+ Tils and CD68+PD-1+ macrophages. We found in NSCLC samples with a higher level of CD8+PD-L1+ Tils that the levels of CD8+PD-1+ Tils and CD68+PD-1+ macrophages were indeed higher (figure 1). The antitumor ability of these CD8+ Tils and macrophages may be impaired in this microenvironment. These results suggest that it may be more pertinent to define the type of tumor microenvironment and make prognostic predictions by the composition of different CD8+ Tils subgroups rather than the total CD8+ Tils.
It is generally recognized that local immune cytolytic activity in the tumor microenvironment was related to tumor antigens and their immunogenicity.28 29 Diskin et al found that the classic KRAS G12D tumor antigen in pancreatic cancer could regulate the expression of PD-L1 on CD8+ Tils.14 Interestingly, our study found that the level of CD8+PD-L1+ Tils was correlated with the overall tumor mutation burden (figure 2), indicating that the phenomenon discovered in mice may also exist in patients with NSCLC. In the field of tumor immunotherapy, it is generally believed that tumor mutation burden, to a certain extent, could represent the abundance of neoantigens.28 30–32 Particularly, mutations in several protein coding genes, such as POLE22 and POLD123 can lead to the production of a large number of neoantigens in TC. It is reported that the mutation rate of POLE in NSCLC is between 2.8% and 6.0%.33 34 In our study, the POLE mutation rate is 8.1%, which is slightly high, which may be related to the threshold of variant allele frequency (VAF) used in this study to identify true mutations. Here, mutations with a sequencing depth after deduplication greater than 500×and the VAF greater than 1% (not 5%) were regarded as true mutations. We found that the levels of TMB and CD8+PD-L1+ Tils in POLE or POLD1 mutant samples were higher than those in wild-type samples (figure 2). This result verified the correlation between tumor mutation burden and the degree of CD8+PD-L1+ Tils infiltration, thus establishing a positive relationship between TMB and CD8+ Tils infiltration in NSCLC tissues. Our previous research showed that TMB are not correlated with total CD8+ Tils infiltration in NSCLC tissues,15 which may be due to that the total CD8+ Tils, but not their subgroups, are taken into consideration.
This study showed that CD8+PD-L1+ Tils was associated with increased gene mutation complexity, which may be responsible for the induction of a hot tumor type microenvironment. In theory, TC in such microenvironment should be easily eliminated by immune cells. Given that PD-L1-high CD8+ Tils usually express more IFN-γ,25 we speculated that the CD8+PD-L1+ Tils high tumors might be suitable for immunotherapy. The severe immunosuppressive state rendered by the contact of CD8+PD-L1+ Tils with neighboring PD-1+ cells can theoretically be eliminated by treatments that block the PD-1 and PD-L1 axis. Our results showed that patients with high levels of CD8+PD-L1+ Tils infiltration were more likely to obtain a good response to anti-PD-1 therapy (figure 4). Mechanistically, Diskin et al uncovered that blocking the binding of PD-L1 on CD8+ Tils with PD-1 on adjacent CD8+ Tils or CD68+ macrophages can restore the antitumor ability of these cells.14 From the perspective of the TIME classification based on the levels of PD-L1 expression and CD8+ Tils, our result showed that two of the five CR/PR patients in the PD-L1-low/negative and CD8-moderate/low group had a high level of CD8+PD-L1+ Tils (figure 4). This suggests that CD8+PD-L1+ Tils have advantages as biomarkers to be developed for predicting the efficacy of anti-PD-1 treatment. Our study shows an important step toward understanding the impact of CD8+PD-L1+ Tils on the response to immunotherapy in human cancer.
Our study comprehensively evaluated the clinical significance of CD8+PD-L1+ Tils in NSCLC from the perspective of the immune microenvironment and tumor genome mutations. The methodology used in this study is common and reliable, and the samples are relatively fresh. A limitation is that almost all stage IV tumor samples in cohorts A and B are puncture samples. The tissue area of the puncture sample is small. Due to the heterogeneity of tumor and the microenvironment, the expression of biomarkers in the entire tissue section may be overestimated or underestimated. Another limitation is that the sample size used to explore the therapeutic relationship between CD8+PD-L1+ Tils and immune checkpoint inhibitors is relatively small. As such, this work should be considered as preliminary and requires further exploration and validation.
Conclusions
In summary, we found that CD8+PD-L1+ Tils may be an indicator of a hot but immunosuppressive microenvironment related to high tumor mutation burden. Elevated level of PD-L1 in CD8+ Tils could be evaluated in future studies to better predict the therapeutic efficacy of PD-1 blockade therapy.
Data availability statement
Data are available upon reasonable request.
Ethics statements
Ethics approval
The study was conducted with the approval of the ethics committees of the First People's Hospital of Yunnan Province (2018GJ087). Each patient signed a written informed consent form.
References
Supplementary materials
Supplementary Data
This web only file has been produced by the BMJ Publishing Group from an electronic file supplied by the author(s) and has not been edited for content.
Footnotes
LZ and YC contributed equally.
Contributors LZ wrote the first draft of the manuscript; HP, LZ, and YC contributed to the conception and design of the research; LZ and YC contributed to the analysis and interpretation of the data; HW, ZX, YW, SL, JL, YC, HL, LW, YY, and HZ contributed to the experiment and analysis of the data. All authors critically revised the manuscript and agreed to be fully accountable for ensuring the integrity and accuracy of the work and read and approved the final manuscript.
Funding This work was supported by the Joint Program of Yunnan Province and Kunming Medical University (2019FE001 (-119), 2019FE001 (-115)), the Medical and Health Unit with Research Institutions of Scientific Research Projects in Yunnan Province (2018NS0271), and the National Key Sci-Tech Special Project of China (2018ZX10302207).
Competing interests YC, HL, LW, YY, and HZ are employees of Genecast Biotechnology Co., Ltd. The other authors declare that they have no competing interests.
Provenance and peer review Not commissioned; externally peer reviewed.
Supplemental material This content has been supplied by the author(s). It has not been vetted by BMJ Publishing Group Limited (BMJ) and may not have been peer-reviewed. Any opinions or recommendations discussed are solely those of the author(s) and are not endorsed by BMJ. BMJ disclaims all liability and responsibility arising from any reliance placed on the content. Where the content includes any translated material, BMJ does not warrant the accuracy and reliability of the translations (including but not limited to local regulations, clinical guidelines, terminology, drug names and drug dosages), and is not responsible for any error and/or omissions arising from translation and adaptation or otherwise.