Article Text

Abstract
Background Previous studies have suggested that inflammatory markers (neutrophil-to-lymphocyte ratio (NLR), lactate dehydrogenase (LDH) and fibrinogen) are prognostic biomarkers in patients with a variety of solid cancers, including those treated with immune checkpoint inhibitors (ICIs). We aimed to develop a model that predicts response and survival in patients with relapsed and/or metastatic (R/M) head and neck squamous cell carcinoma (HNSCC) treated with immunotherapy.
Methods Analysis of 100 consecutive patients with unresectable R/M HNSCC who were treated with ICI. Baseline and on-treatment (day 28) NLR, fibrinogen and LDH were calculated and correlated with response, progression-free survival (PFS) and overall survival (OS) using univariate and multivariate analyses. The optimal cut-off values were derived using maximally selected log-rank statistics.
Results Low baseline NLR and fibrinogen levels were associated with response. There was a statistically significant correlation between on-treatment NLR and fibrinogen and best overall response. On-treatment high NLR and raised fibrinogen were significantly associated with poorer outcome. In multivariate analysis, on-treatment NLR (≥4) and on-treatment fibrinogen (≥4 ng/mL) showed a significant negative correlation with OS and PFS. Using these cut-off points, we generated an on-treatment score for OS and PFS (0–2 points). The derived scoring system shows appropriate discrimination and suitability for OS (HR 2.4, 95% CI 1.7 to 3.4, p<0.0001, Harrell’s C 0.67) and PFS (HR 1.8, 95% CI 1.4 to 2.3, p<0.0001, Harrell’s C 0.68). In the absence of an external validation cohort, results of fivefold cross-validation of the score and evaluation of median OS and PFS on the Kaplan-Meier survival distribution between trained and test data exhibited appropriate accuracy and concordance of the model.
Conclusions NLR and fibrinogen levels are simple, inexpensive and readily available biomarkers that could be incorporated into an on-treatment scoring system and used to help predict survival and response to ICI in patients with R/M HNSCC.
- head and neck neoplasms
- immunotherapy
- biomarkers
- tumor
Data availability statement
Data are available upon reasonable request. The data will be deposited in an appropriate repository.
This is an open access article distributed in accordance with the Creative Commons Attribution Non Commercial (CC BY-NC 4.0) license, which permits others to distribute, remix, adapt, build upon this work non-commercially, and license their derivative works on different terms, provided the original work is properly cited, appropriate credit is given, any changes made indicated, and the use is non-commercial. See http://creativecommons.org/licenses/by-nc/4.0/.
Statistics from Altmetric.com
Background
Advances in immunotherapy have transformed practice in relapsed and/or metastatic (R/M) head and neck squamous cell carcinoma (HNSCC). Two anti-PD1 antibodies, nivolumab and pembrolizumab, have been shown to improve overall survival (OS) in patients with R/M HNSCC and have been approved for use in the second-line setting based on the results from the CheckMate-141 and KEYNOTE-040 trials, respectively.1 2 Recently, given the observed efficacy in the KEYNOTE-048 trial, pembrolizumab in combination with platinum and 5-fluorouracil has been approved by the US Food and Drug Administration and European Medicines Agency for first-line treatment in R/M HNSCC and as monotherapy for PD-L1-positive population.3 Other trials of immune checkpoint inhibitors (ICIs) or combinations with other immune-stimulatory drugs are also tracking first-line and second-line benefit.4 Although ICIs present a promising new opportunity, objective responses remain around 20% in first-line and second-line patients with R/M HNSCC unselected for tumor PD-L1 expression. In addition, despite data showing that PD-L1 correlates with better efficacy of ICIs, no other reliable biomarker for effectively selecting optimally responsive patients has been identified as yet. Moreover, no on-treatment monitoring biomarker has yet been defined.
With the aim of selecting eligible patients with advanced cancer for early clinical trials, different tools have been developed. The Royal Marsden Hospital (RMH) score established a prognostic score based on three objective baseline markers: lactate dehydrogenase (LDH) level, number of metastatic deposits (≤2 vs >2) and albumin level.5 6 This prognostic score was able to stratify patients into two distinct groups according to their risk of death. More recently, the Institut Gustave Roussy’s Early Drug Development Department developed a new prognostic immune score (Gustave Roussy Immune Score -GRIm-Score-) applied to ICI phase I trial patients. This score used LDH, albumin and neutrophil-to-lymphocyte ratio (NLR).7 Both scoring systems have been retrospectively and prospectively validated in different cohorts but remain globally underused by clinicians and investigators.8 9 Other measures have been proposed in the past, including the MD Anderson experience, which included low hemoglobin level as an independent factor of poor survival,10 and the Princess Margaret Hospital Index, which used Eastern Cooperative Oncology Group (ECOG) performance status.11
There is increasing interest in NLR as a potential predictive marker in patients treated with ICI. Many studies have identified high NLR as a poor prognostic factor in several malignancies, and a large meta-analysis has shown its prognostic impact on progression-free survival (PFS) and OS in different disease subgroups, including HNSCC, independent of tumor site and stage.12 13 However, the most discriminatory cut-off point for NLR remains unknown and may differ between different tumor sites and stages.
Fibrinogen is a 340 kDa glycoprotein that is primarily produced by hepatic cells and functions as an important clotting factor in the haemostatic pathway. Fibrinogen is converted into fibrin through the proteolytic effect of thrombin.14 It also serves as an acute-phase protein which rises in response to systemic inflammation and tissue injury.15 Recent studies have suggested that elevated fibrinogen promotes cancer cell growth, progression and metastasis.16–22 Furthermore, fibrinogen levels have been associated with tumor size and lymph node spread in various cancer types, including HNSCC.23 24 Fibrinogen biosynthesis is regulated by constitutive, hormonal and cytokine-mediated mechanisms. As an acute-phase protein, fibrinogen biosynthesis is upregulated by interleukin (IL)-6.25 An emerging role of IL-6 in modulating multiple functions of immune cells including T cells, dendritic cells, and macrophages is thought to contribute to dysfunctional innate and adaptive immunity against cancer cells.26 Indeed, elevated levels of IL-6 have been observed in patients with various types of cancer and have been considered a poor prognostic factor, given its detrimental effects on antitumor immunity.27 Other cytokines, such as tumor necrosis factor alpha (TNF-α) and IL-1, suppress fibrinogen synthesis.28 TNF-α and IL-1 contribute to antitumor activity by promoting tumour-associated macrophage differentiation to M1 phenotype, by activating T effector cells and by attracting neutrophils and monocytes to the tumor site.29
We conducted a study to evaluate the usefulness of pretreatment and on-treatment serum fibrinogen levels alongside previously described prognostic markers (NLR and LDH) to establish an accurate scoring system predictive of response and survival in patients with R/M HNSCC treated with ICI.
Methods
Sample size calculation and patients
With α=0.05 and β=0.20, the planned sample size (with continuity correction) was 99 patients according to sample-size formula for proportional regression model, considering that 70% of the subjects will present increased inflammatory markers, an expected relative hazard based on previous literature of 2,12 and a survival within the low-risk group of 30% with a planned average length of follow-up of 18 months. Therefore, a total of 100 consecutive patients were analyzed.
Patients were eligible for inclusion if they were diagnosed with histologically confirmed R/M HNSCC and treated with immunotherapy at the RMH between May 2015 and June 2020. All patients had been treated with an ICI (alone or in combination with other checkpoint modulators), and information on fibrinogen, coefficient NLR and LDH levels had to be available for analysis. The data were obtained from the electronic patient records. Informed consent was obtained from all individual subjects included in the study.
Data collection
The following clinical factors were examined: age, gender, smoking status (current, former and never smokers), primary site, human papillomavirus (by p16 immunohistochemistry) status and relapsed (local, regional or locoregional), uncurable disease following previous radical treatment or metastatic disease (either de novo or following previous radical treatment, including those with both locoregional and distant metastases) stage. Additional clinical information that could potentially influence fibrinogen level was collected, including liver dysfunction (defined as Hy’s law criteria being met at any point during treatment) and anticoagulant treatment.
The patient’s baseline coagulation, including fibrinogen level, was collected on the day before receiving ICI or within 7 days prior to initiation of ICI. On-treatment fibrinogen was collected on day 28 from the initiation of ICI (±7 days). LDH and NLR (defined as the absolute neutrophil count divided by the absolute lymphocyte count) were obtained from routine biochemical and complete blood count (CBC) analyses, respectively, at the same time points as the fibrinogen data.
Response was assessed according to Response Evaluation Criteria in Solid Tumors (RECIST) V.1.1. Response was defined as the proportion of patients that achieved partial response (PR), complete response (CR) or stable disease (SD) when it met the minimum time of 3 months from baseline. Best overall response (BOR) was defined by RECIST V.1.1. as the best response recorded from the start of the treatment until disease progression/recurrence, including SD providing that criteria for a minimum duration of 3 months was met. Survival outcomes included PFS and OS. Both were reported in number of months from the initiation of ICI to the date of progression or death, respectively, or last follow-up.
Statistical analysis
We presented patient characteristics as means or frequency. After checking normality using Shapiro-Wilk test, we used t-test (or Mann-Whitney test and Wilcoxon matched-pair signed-rank test if there was no parametric distribution) or χ2 test for comparison of means or proportions across groups, respectively. One-way analysis of variance (or Kruskal-Wallis test for non-Gaussian distributions) was used to compare biomarker levels and BOR. Dunn’s post hoc correction was used for multiple comparisons. Optimal cut-off fibrinogen values for dichotomized outcomes were empirically estimated by using the receiver operator characteristic (ROC) with areas under the curve (AUCs) of <0.75 regarded as not clinically useful. The optimal fibrinogen cut-off point for survival outcomes was derived using maximally selected log-rank statistics. The exact conditional p value for the cut-off value obtained was simulated via conditional Monte Carlo (cMC) with 9999 replicates, and the null hypothesis was rejected when the p value was ≤0.05. Univariate and multivariate Cox proportional hazard models were used to investigate associations of predictive variables with survival. Results were presented as HRs with 95% CIs. Harrell’s C was obtained to study the model’s discriminatory ability. In the absence of an external validation cohort, we performed k-fold cross-validation (fivefold) of our final model for death and progression and estimated the accuracy of the model using the ‘care’ R package. In addition, we calculated the concordance of the trained model (risk score given by the median OS and PFS on the Kaplan-Meier distribution) on test data using the ISDEvaluation code, available at github (https://github.com/haiderstats/ISDEvaluation). Statistical analyses were performed with R V.4.0. and R studio. Graphs were obtained using ‘ggplot2’ package in R studio and GraphPad Prism V.9.0.1.
Results
Patient characteristics
Patient characteristics are summarized in table 1. Mean age was 62 (range 31–85) years and 80% were male. More than half of the patients had primary oropharyngeal carcinomas (54%), of whom 68% were p16 positive. Seventy percent of patients had metastatic disease. Most patients were ex-smokers (71%). All patients had a performance status of 0 or 1. ICI was the first-line treatment for 54% of the patients.
Patient characteristics
As of November 2020, with a median follow-up of 9 months (20 months for censures), 84 patients had progressed, and 67 patients had died. Median OS was 11.2 (95% CI 8.8 to 15.8) months and median PFS was 4.4 (95% CI 2.9 to 5.4) months. Overall, 39 patients had progressive disease (PD), 33 had SD, 21 had PR and 7 had CR.
We found no correlation between baseline and on-treatment fibrinogen levels and the other studied variables including age (<65 vs ≥65 years), gender, smoking status, relapsed/metastatic stage, line of treatment, primary (oropharynx vs others), p16 status, liver disease and anticoagulation. For the whole population, treatment with ICI caused no statistically significant difference in fibrinogen (p=0.06), NLR (p=0.37) or LDH levels (p=0.14) from baseline to the on-treatment time point (online supplemental figure S1).
Supplemental material
Response-to-treatment analysis
Patients who responded to ICI showed significantly lower baseline and on-treatment fibrinogen levels (4.05 vs 4.59 ng/mL, p=0.0021, and 3.76 vs 4.47 ng/mL, p=0.002, respectively; online supplemental figure S2). Moreover, mean on-treatment fibrinogen was correlated with BOR, with patients achieving CR exhibiting lower levels than patients with PD (Dunn’s adjusted p=0.0466) (figure 1A). However, we could not find any clinically meaningful predictive fibrinogen cut-off point for response (ROC AUCs=0.66 and 0.63, respectively).
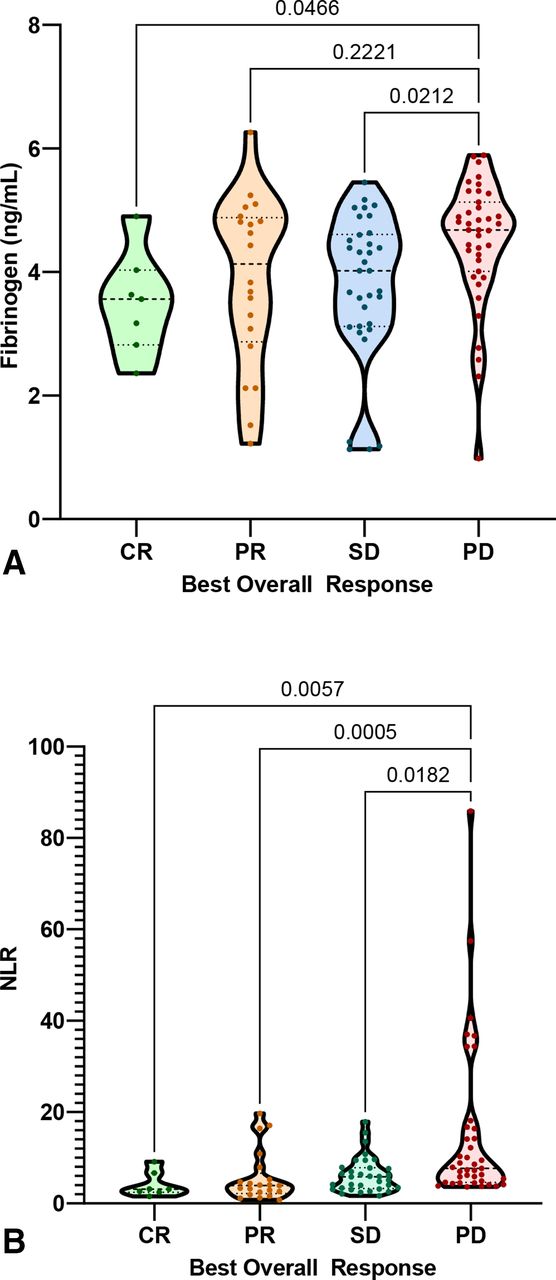
Violin plot of BOR by on-treatment fibrinogen and on-treatment NLR (Kruskal-Wallis and Dunn’s corrected p values for multiple comparisons are shown). (A) On-treatment fibrinogen and BOR. (B) On-treatment NLR and BOR. BOR, best overall response; CR, complete response; NLR, neutrophil-to-lymphocyte ratio; PD, prograssive disease; PR, partial response; SD, stable disease.
Mean baseline NLR for responders (6.4, SD 6.5) was significantly lower to mean baseline NLR for non-responders (9.1, SD 10.22) (p=0.04), but no differences were found when grouping by BOR. On-treatment NLR was associated with response, with responders showing a lower mean on-treatment NLR (5.8, SD 4.42) compared with non-responders (14.8, SD 17.28), (p<0.001). In addition, on-treatment NLR was associated with BOR, with patients achieving CR, PR or maintained SD presenting statistically significantly lower NLR values than patients with PD (figure 1). A cut-off point of on-treatment NLR of 3 was found to be predictive for response (ROC AUC=0.8, sensitivity=0.9 and specificity=0.6). Baseline and on-treatment LDH levels were not associated with response (online supplemental figure S2).
Survival analysis
Lower baseline and on-treatment fibrinogen levels were both significantly associated with improved OS and PFS. The optimal cut-off derived by maximizing the significance assessed by the log-rank test was 5 ng/mL for baseline fibrinogen (cMC p=0.03 for OS, p=0.02 for PFS) and 4 ng/mL for on-treatment fibrinogen (cMC p<0.0001 for OS, p=0.0001 for PFS). Median OS and PFS were 7.4 (95% CI 3.9 to 12.3) and 2 (95% CI 1.5 to 4.8) months, respectively, for patients with baseline fibrinogen of ≥5 compared with 14.4 (95% CI 10 to 21.7) and 5.3 (95% CI 4 to 8.3) months for patients with baseline fibrinogen of <5 ng/mL (log-rank p=0.003 for OS and 0.005 for PFS). Equally, patients with on-treatment fibrinogen of <4 ng/mL had a significantly longer median OS (22 months, 95% CI 19 to not reached, vs 7.5 months, 95% CI 6.2 to 10.8, log-rank p<0.0001) and PFS (9.4 months, 95% CI 5.5 to 21, vs 2.6 months, 95% CI 2 to 4, log-rank p=0.00014) (figure 2).

Kaplan-Meier curves by baseline fibrinogen (A,B), on-treatment fibrinogen (C,D) and on-treatment NLR levels (E,F). (A,B) Baseline fibrinogen. (C,D) On-treatment fibrinogen. (E,F) On-treatment NLR. NLR, neutrophil-to-lymphocyte ratio; OS, overall survival; PFS, progression-free survival.
Baseline NLR was not correlated with OS or PFS when dichotomizing patients into two categories of baseline NLR of <6 and≥6, as previously reported in the GRIm-Score (14.4 vs 9 months, p=0.054, and 5 vs 2.9 months, p=0.29, respectively).7 Maximally selected log-rank test for OS showed that the optimal stratum for baseline NLR was 8 (cMC p=0.03), and this value significantly stratified OS, resulting in a significantly shorter median OS in those with baseline NLR of >8 (median OS 14.4 vs 6.6 months, p=0.002). Regarding on-treatment NLR, when using a previously reported cut-off of 5,30 patients with lower NLR lived significantly longer (median OS 14.6 vs 9 months, p=0.03) with no difference in PFS. However, when using maximally log-rank calculated on-treatment NLR cut-off point of 4 for both OS and PFS (cMC p<0.0001), patients with lower NLR lived significantly longer (median OS not achieved vs 8.8 months, log-rank p<0.0001) and progressed later (median PFS 10.3 months vs 2.7 months, p<0.0001) (figure 2).
We did not find any significant cut-off point that correlated LDH at any time point with PFS and OS. Thus, LDH was not included in the Cox proportional hazard analysis.
On univariate Cox analysis, the following variables were found to be predictive for OS: p16 status, baseline NLR (cut-off point of 8), on-treatment fibrinogen (4 ng/mL) and on-treatment NLR (cut-off point of 4). On a multivariate Cox regression model, only on-treatment fibrinogen and on-treatment NLR remained as independent factors associated with OS. HRs (95% CI) and p values are shown in table 2. Harrell’s C index evaluating the suitability of this model was 0.73.
Univariate and multivariate analyses for overall survival
Significant predictive factors for PFS in univariate Cox regression were baseline fibrinogen (5 ng/mL), on-treatment fibrinogen (4 ng/mL) and on-treatment NLR (cut-off point of 4). On multivariate analysis, only on-treatment fibrinogen and NLR remained significantly associated with PFS (see table 3) with a Harrell C index of 0.74.
Univariate and multivariate analyses for progression-free survival
To rule out a possible interaction between p16 status and on-treatment fibrinogen, we conducted a sensitivity analysis which showed that on-treatment fibrinogen remained a prognostic factor for OS and PFS for both p16-positive and p16-negative patients (online supplemental figure S3).
We generated a score for OS and PFS using the independent predictive variables at day 28 of ICI: fibrinogen (≥4 ng/mL=1 point) and NLR (≥4=1 point). Patients with a score of 0 point had an estimated 1-year OS rate of 80%, whereas patients with scores of 1 and 2 had an estimated 1-year OS rate of 56% and 32%, respectively (HR 2.4, 95% CI 1.7 to 3.4, p<0.0001). Harrell’s C index evaluating the suitability of this score was 0.68. Regarding PFS, patients with a score of 0 point had a 1-year PFS rate of 52%, whereas patients with scores of 1 and 2 both had an estimated 1-year PFS of 11% (HR 1.8, 95% CI 1.4 to 2.3, p<0.0001). Harrell’s C test was 0.67. Kaplan-Meier curves for OS and PFS by on-treatment score are shown in figure 3.

On-treatment score (fibrinogen≥4=1 point, neutrophil-to-lymphocyte ratio≥4=1 point) and Kaplan-Meier curves for overall survival and PFS. PFS, progression-free survival.
The accuracy of our score using a fivefold cross-validation for death and progression was 79% and 84%, respectively. Each fold achieved a similar accuracy with the lowest being 71.4% for death and 77.5% for progression (online supplemental figure S4). Moreover, the concordance of the trained model on test data for OS and PFS was 72.4% and 72.8%, respectively.
Discussion
Our study successfully identified inflammatory markers which are predictive of response and survival in patients with R/M HNSCC treated with ICI. These parameters could potentially be used in the clinic to improve patient monitoring. At pretreatment time point, fibrinogen and NLR showed to be relevant markers of poor OS. However, the selected NLR cut-off point (NLR≥8) was higher than that used in the GRIm-Score (NLR≥6).7 This may be explained by the fact that patients with HNSCC, especially those with local and/or regional relapse, frequently present with ulcerative and overinfected lesions that lead to an increased neutrophil count.31 NLR has been described as a prognostic factor in multiple solid cancers. The meta-analysis conducted by Templeton et al12 confirmed this among a wide range of malignancies, although on a different magnitude for each subsite. In addition, NLR has also been shown to be a predictive marker in patients treated with ICI. Studies of metastatic melanoma suggest that baseline NLR can predict response to ipilimumab and nivolumab.32 33 Takenaka et al13 quantified the prognostic value of NLR in patients with HNSCC from a pooled analysis of 16 studies and showed that higher NLR was associated with worse outcome (pooled HR ranging from 1.47 to 1.93). However, the population comprised patients with early or locally advanced HNSCC, and the cut-off values of NLR for dichotomization ranged from 1.92 to 5.0.
In order to translate a continuous variable such as NLR or serum fibrinogen into a clinical decision tool, it is necessary to determine a cut-off point to stratify patients into distinct groups.34 Although the mean or median value of the marker has been frequently used before, it has been deemed inappropriate, and it is often desirable to determine cut-off points by optimizing the correlation with clinical outcomes by using minimization of p values or maximization of sensitivity and specificity tests.35 Regrettably, among the studies of the prognostic impact of NLR, including publications such as the GRIm-Score,7 the methods for cut-off determination remain obscure or unmentioned in most instances. Conversely, in our study, we implemented a cut-point estimation method that can be easily accessible and reproducible using the ‘maxstat’ package available at CRAN (https://CRAN.R-project.org/package=maxstat).
Our multivariate analysis results show that on-treatment fibrinogen and NLR are the most reliable biomarkers to predict both disease progression and mortality in our population. This may reflect the fact that early changes in the immune system following initiation of immunotherapy, rather than pretreatment characteristics, give better representation of the underlying biological process.36 This is in line with the results of the recently published melanoma study by Li et al,30 which showed that the change in the NLR during treatment with ICI is associated with survival30 in a non-linear fashion, with moderate reductions of NLR correlated with longest OS. Moreover, our data showed that lower levels of on-treatment NLR and fibrinogen levels correlate with response. An on-treatment NLR cut-off point of 3 enables the stratification of patients according to their response to ICI with a sensitivity of 0.9. On the other hand, despite being unable to find a clinically significant on-treatment fibrinogen cut-off for response, this is the first study to demonstrate a relationship between fibrinogen levels and response during ICI treatment.
To our knowledge, this is the first published study to evaluate the prognostic value of serum fibrinogen levels in patients with R/M HNSCC treated with ICI. IL-6 signaling is a critical mechanism for the induction of dysfunctional immune responses.27 IL-6-mediated STAT3 activation has been reported to regulate the expansion of myeloid-derived suppressor cells (MDSCs) and the expression of PD-L1 in cancer and immune cells.30 Considering the established stimulatory action of IL-6 on fibrinogen production,25 measuring serum fibrinogen could predict the levels of IL-6 and circulating MDSCs in patients, and it may constitute a method for evaluating the state of host systemic immune response. Our ‘on-treatment immune score’ showed that using on-treatment fibrinogen improved the discriminatory power when it is taken into account together with NLR. Importantly, NLR and serum fibrinogen are cheaper and faster laboratory measurements than many other biomarkers, and they can be readily applied in daily clinical practice.
One might argue that baseline prognostic scores would normally be preferred to on-treatment score models. However, in a day-to-day clinical scenario, this may not always be the case, even less so when applied to patients with R/M HNSCC. According to the KEYNOTE-048 results,3 the decision-making for first-line ICI treatment options should take into account PD-L1 Combined Positivity Score (CPS), alongside other important clinical considerations such as performance status, disease burden and progression rate.37 However, even in patients with high CPS (≥20), the response rate remains relatively low (23%) and careful review of the Kaplan-Meier curves from this study shows that a considerable proportion of PD-L1-positive (CPS≥1) patients treated with pembrolizumab monotherapy progressed or died earlier than those treated with chemotherapy. Therefore, an early identification of those patients that present poor prognostic features within the first month of treatment could assist the clinician in making informed decisions regarding risk-adaptive treatment changes and could add valuable information in the scenario of pseudo-progression.
We acknowledge that this study is limited due to its retrospective nature, its relatively small numbers, and the lack of data on PD-L1 status. Nevertheless, the statistical analysis is powerful enough and the scoring system exhibits an appropriate discriminative ability. Moreover, internal cross-validation and model evaluation confirmed good accuracy and concordance of the score. All the confounding variables, including those that could affect the fibrinogen measurement accuracy (smoking status, liver dysfunction and anticoagulation treatment), have been controlled and the impact of fibrinogen on survival was confirmed in a sensitivity analysis according to p16 status. In addition, this is the first scoring system designed to be used in the setting of patients with R/M HNSCC and the first that has described the prognostic value of serum fibrinogen as a surrogate marker of the state of the host immune system. We acknowledge that, despite showing appropriate internal cross-validation of our model, the scoring system should now be validated using independent prospective datasets. During the conduct of this research, we approached two pharmaceutical companies who had conducted phase II and III clinical trials of ICI in the first-line and second-line treatment of R/M HNSCC and requested access to data in order to validate our model. Regrettably, these attempts were unsuccessful, in part because of a prevailing view that the current regulatory landscape precludes sharing of data for independent validation. Therefore, we encourage the research community to test the performance of our model in their independent datasets.
Conclusions
This is the first study to demonstrate the relationship between serum fibrinogen and survival during ICI treatment for patients with R/M HNSCC. We show that a scoring system using on-treatment NLR for OS and PFS improved its discriminatory power when on-treatment fibrinogen is taken into account. Because NLR and serum fibrinogen are obtained from routine CBC, their use does not involve additional procedures or extra costs for healthcare providers. Implementation of the on-treatment score in clinical practice could allow better monitoring and optimal clinical management of patients with R/M HNSCC receiving first-line or second-line systemic treatment with ICI. Prospective studies with a larger patient cohort are needed for validation.
Data availability statement
Data are available upon reasonable request. The data will be deposited in an appropriate repository.
Ethics statements
References
Supplementary materials
Supplementary Data
This web only file has been produced by the BMJ Publishing Group from an electronic file supplied by the author(s) and has not been edited for content.
Footnotes
Contributors PN, LG and KH conceived the idea. PN, LG, HS, MB, AT and IL collected the data. PN performed the statistical analysis. PN, KH, KHW, CMN, SAB, KN and DaD participated in the discussions and critically read the manuscript. PN, LG and KH wrote the manuscript. SAB, KH and AM supervised the project.
Funding The authors acknowledge funding to the Royal Marsden/Institute of Cancer Research National Institute for Health Research Biomedical Research Centre. This report is independent research funded by the National Institute for Health Research. The views expressed in this publication are those of the authors and not necessarily those of the NHS, the National Institute for Health Research or the Department of Health. PN was supported by the CRIS/FEOR (grant 2019/2020).
Competing interests None declared.
Provenance and peer review Not commissioned; externally peer reviewed.
Supplemental material This content has been supplied by the author(s). It has not been vetted by BMJ Publishing Group Limited (BMJ) and may not have been peer-reviewed. Any opinions or recommendations discussed are solely those of the author(s) and are not endorsed by BMJ. BMJ disclaims all liability and responsibility arising from any reliance placed on the content. Where the content includes any translated material, BMJ does not warrant the accuracy and reliability of the translations (including but not limited to local regulations, clinical guidelines, terminology, drug names and drug dosages), and is not responsible for any error and/or omissions arising from translation and adaptation or otherwise.