Article Text

Abstract
Background Immuno-oncology therapies are now part of the standard of care for cancer in many indications. However, durable objective responses remain limited to a subset of patients. As such, there is a critical need to identify biomarkers that can predict or enrich for treatment response. So far, the majority of putative biomarkers consist of features of the tumor microenvironment (TME). However, in preclinical mouse models, the collection of tumor tissue for this type of analysis is a terminal procedure, obviating the ability to directly link potential biomarkers to long-term treatment outcomes.
Methods To address this, we developed and validated a novel non-terminal tumor sampling method to enable biopsy of the TME in mouse models based on fine needle aspiration.
Results We show that this technique enables repeated in-life sampling of subcutaneous flank tumors and yields sufficient material to support downstream analyses of tumor-infiltrating immune cells using methods such as flow cytometry and single-cell transcriptomics. Moreover, using this technique we demonstrate that we can link TME biomarkers to treatment response outcomes, which is not possible using the current method of terminal tumor sampling.
Conclusion Thus, this minimally invasive technique is an important refinement for the pharmacodynamic analysis of the TME facilitating paired evaluation of treatment response biomarkers with outcomes and reducing the number of animals used in preclinical research.
- drug evaluation
- preclinical
- immunologic techniques
- tumor biomarkers
- tumor microenvironment
- immunotherapy
Data availability statement
All data relevant to the study are included in the article or uploaded as online supplemental information.
This is an open access article distributed in accordance with the Creative Commons Attribution Non Commercial (CC BY-NC 4.0) license, which permits others to distribute, remix, adapt, build upon this work non-commercially, and license their derivative works on different terms, provided the original work is properly cited, appropriate credit is given, any changes made indicated, and the use is non-commercial. See http://creativecommons.org/licenses/by-nc/4.0/.
Statistics from Altmetric.com
Background
Immuno-oncology (IO) therapies are now part of the standard of care treatment for many different types of cancer.1 Despite these successes, 60%–90% of patients fail to respond, highlighting the need for greater insights into both patient stratification and to identify novel IO targets and combinations.2 Preclinical models are essential for drug discovery and are used to investigate target biology, determine mechanism of action and, critically for IO therapies, evaluate how the immune system directly and indirectly responds to the therapeutic intervention. These insights facilitate the discovery of pharmacodynamic (PD) biomarkers of response as well as the drivers of immunosuppression and treatment failure. Recent detailed characterization of the immune and genomic landscape of syngeneic mouse cancer models allows for rational model selection based on the underlying immune contexture of the tumor3 and for the bridging of these insights into patient tumors harboring similar features. While there are differences between human and mouse tumor immunology that need to be accounted for, the application of mouse models to explore how targeted immunotherapies impact both the tumor microenvironment (TME) and the immune system provides vital translational insights that have underpinned the success of IO treatments in the clinic.4
A major limitation has been that the collection of tumor tissue for this type of TME characterization is a terminal procedure, therefore limiting the capacity to undertake longitudinal analysis of a given treatment over time or directly pair antitumor activity with a PD response within the TME. Instead, it is standard practice to utilize different cohorts of mice to assess activity and integrate this with PD response/TME characterization relying on the comparison of these cohort ‘averages’. Therefore, the development of a non-terminal sampling method to biopsy the TME in mouse models is an important refinement to existing approaches as it not only generates more robust data that is less affected by the inherent biological variability between animals but it also enables the direct comparison of the TME before and after treatment, supporting biomarker identification. Additionally, with repeat biopsies, TME changes can be directly compared at several timepoints for the same tumor, enabling each mouse to act as its own control. This increases the power to detect treatment effects and can be used, for example, to directly compare the TME pretreatment and post-treatment for the same mouse. Moreover, non-terminal sampling of the TME also reduces the overall numbers of animals needed to assess the mechanism of action of novel candidate drugs by enabling PD/TME and antitumor activity assessments to be undertaken in the same animal over time. Thus, this novel tumor sampling method strongly aligns with the principles of the 3Rs of animal research (Replacement, Reduction and Refinement) by generating more robust data while reducing the number of animals required in preclinical studies.
Methods for non-terminal tumor sampling include fine needle aspiration (FNA), a clinically validated diagnostic procedure used to sample tumors via a needle inserted either by palpation or image-guided placement, that is less invasive compared with core or open biopsies.5 In this study, we evaluated whether FNA could be used for the non-terminal sampling of subcutaneous flank tumors to enable characterization of tumor-infiltrating immune cells (TILs) in preclinical mouse tumor models. Our data demonstrate that FNA biopsies can be taken from tumors without impacting tumor growth kinetics or the frequency of TILs and provide sufficient material to allow assessment of immune cell populations by flow cytometry and single-cell RNA sequencing. Using flow cytometry, we show that data from FNA biopsies recapitulates the results obtained with the current practice of terminal whole tumor analysis. Moreover, we demonstrate how longitudinal TME sampling can be used to identify biomarkers of response or resistance to different IO therapies. Thus, this simple, rapid and minimally invasive non-terminal tumor sampling technique enables the paired assessment of PD response and antitumor activity, reducing the number of animals needed for preclinical oncology studies and supporting biomarker discovery.
Methods
Animals
Female C57BL/6 and BALB/c mice were supplied by Charles River UK at 8 to 10 weeks of age and weighing roughly 18 g. Mice were housed under specific pathogen-free conditions in Tecniplast Green Line Sealsafe Individually Ventilated Cages holding a maximum of six animals with irradiated aspen chip bedding, Nestlets nesting material, a tunnel and wooden chew blocks. Mice were housed on a 12/12 light/dark cycle, with ad libitum UV-treated water and RM1 rodent diet. Mice underwent a minimum of 5 days of acclimatization after arrival in the animal facility before study initiation.
Tumor cell lines
The murine colon carcinoma cell line CT26 and the murine mammary carcinoma cell line 4T1 were obtained from ATCC and maintained in RPMI 1640 media supplemented with 10% FBS (fetal bovine serum). The murine fibrosarcoma cell line MCA205 was obtained from Agonox and maintained in RPMI 1640 media supplemented with 10% FBS. The murine renal carcinoma cell line RENCA was also obtained from ATCC and maintained in RPMI 1640 supplemented with 10% FBS, 1% non-essential amino acids, 1 mM sodium pyruvate and 2 mM GlutaMAX-I. The murine B cell lymphoma line A20 was obtained from ATCC and maintained in RPMI 1640 media supplemented with 10% FBS and 0.1% 2-mercaptoethanol. Cell lines did not undergo any in vivo passaging and were maintained under limited passage from original stocks (typically under 5). Cell lines were reauthenticated using STR-based DNA profiling and multiplex PCR and confirmed mycoplasma free (IDEXX BioResearch).
Tumor models
For tumor implantation, mice were shaved on the right flank and subcutaneously injected with 100 µL of cells containing either 5×10⁵ CT26 cells in PBS (phosphate-buffered saline), 5×10⁵ MCA205 cells in 50% growth factor-reduced matrigel (Corning), 1×10⁷ A20 cells in PBS, 1×10⁵ 4T1 cells in PBS or 2.5×10⁶ RENCA cells in PBS. Tumor volume was measured three times per week using electronic calipers and calculated using the formula (width2×length)/2. Mice were euthanized when they reached humane welfare limits pertaining to tumor volume (average diameter of 15 mm) or tumor condition (ulceration of the skin above the tumor). For survival analysis, survival was defined as the time to reach this welfare endpoint and mice were excluded from analysis if they were sacrificed due to skin ulceration before reaching a minimum tumor volume (typically 500 mm3) or if they reached the study end date without having either no measurable tumor or having reached a welfare endpoint.
Treatments
Mice were randomized by body weight and dosed with mouse glucocorticoid-induced TNFR-related protein ligand-fusion protein (GITRL-FP) mIgG2a (AstraZeneca)6 intraperitoneally at 0.2 mg/kg or 1 mg/kg 6 days after tumor cell implantation. Mice were randomized by tumor volume and dosed intraperitoneally with either an anti-CTLA-4 antibody (clone 9D9) mIgG1 (AstraZeneca) or with an isotype control antibody at 10 mg/kg two times per week starting 7 days after tumor cell implantation for a total of six doses.
FNA biopsying
Mice were randomized by tumor volume and mice assigned to the FNA group were anesthetized using isoflurane and placed on a rotating anesthetic platform. A 25 gauge needle was attached to a 1 mL syringe filled with 0.9 mL of cold RPMI media. The needle was inserted horizontally into the tumor and rotated to dislodge tissue. Negative pressure was generated by pulling back the syringe plunger by approximately 100 µL to withdraw cells into the media. Roughly 200 µL of the media containing cells was then flushed out of the syringe into a 1.5 mL Eppendorf tube (method demonstrated in online supplemental file 1). This was repeated a further four times at different sites around the entire tumor to maximize the representativity of the sampling and the tube was immediately placed on ice. When directly comparing matched whole tumor digests and FNAs, the FNA was carried out on the deceased animal before resection and processing of the tumor.
Supplementary video
Sample processing for flow cytometric analysis
For whole tumor digests, tumors were enzymatically digested at 37°C for 20 min with 1 mg/mL collagenase IV, 0.1 mg/mL hyaluronidase I and 200 units/mL DNase I (all Sigma-Aldrich) and single-cell suspensions were obtained by using a gentleMACS dissociator (Miltenyi Biotec) and filtering through a 70 µm nylon cell strainer. FNA samples were spun down at 400 rcf for 5 min at 4°C in a microcentrifuge. The supernatant was carefully pipetted off before resuspension of the cell pellet in 200 µL of PBS. The entire sample was then added into a single well of a 96 well V-bottom plate.
Flow cytometric staining
Cells were stained with a fixable viability dye (Thermo Fisher) and blocked with antibodies to CD16/CD32 (eBioscience) before staining with fluorescence-conjugated antibodies in flow cytometry staining buffer (2% bovine serum albumin, 0.1% sodium azide, 2 mM EDTA) with 50% Brilliant Stain Buffer (BD Biosciences). Intracellular staining was performed using the FoxP3/Transcription Factor Staining Buffer Set (eBioscience) and cells were fixed in 3.7% formaldehyde. Cells were acquired in flow cytometry staining buffer on a BD LSRFortessa or BD FACSymphony flow cytometer (BD Biosciences) and analyzed using FlowJo (TreeStar). Samples containing fewer than 1000 CD45+ cells were excluded from analysis due to low event count.
Fluorescently labeled antibodies include: anti-CD45 BV786 (clone 30-F11); anti-CD3 FITC (clone 17A.2); anti-CD19 BV421 (clone 6D5); anti-NKp46 BV605 (clone 29A1.4); anti-ICOS PE (clone C398.4A); anti-CD86 BV650 (clone GL1); anti-CD11c BV421 (clone N418); anti-CD11b BV510 (clone M1/70); anti-Ly6C BV711 (clone HK1.4) (all Biolegend); anti-PD1 PE-eFluor610 (clone J43); anti-FoxP3 PEeFluor610 or AF488 (clone FJK-16s); anti-Ki67 eFluor660 (clone SolA15) (all eBioscience); anti-CD8 BUV737 (clone 53–6.7); anti-Ly6G BUV395 (clone 1A8); anti-CD4 BUV395 (clone GK 1.5) (all BD Biosciences).
Cell hashing and sorting
FNA biopsies were collected from four mice bearing A20 tumors, a CD20+ B cell lymphoma model. The samples were stained with a mix of fluorescently labeled anti-CD20 PerCP/Cyanine 5.5 antibody (clone SA275A11) and TotalSeq-B0301 to B0304 anti-mouse Hashtag antibodies (a cocktail of DNA-barcoded anti-CD45 (clone 30-F11) and anti-MHC I clone (M1/42) antibodies in order to doubly label cells to increase tagging efficiency) (both Biolegend) according to the manufacturer’s protocol. The four hashtagged samples were pooled, stained with DRAQ7 viability dye (Abcam) and enriched for immune cells by sorting for CD20− cells on a BD FACSAria III cell sorter (BD Biosciences).
Single-cell RNA sequencing of FNA samples
Sorted cells were loaded on the Chromium Controller using the Chromium Next GEM Single Cell 3ʹ GEM, Gel Bead, Chip, Library and Featured Library Kits (V.3.1; 10× Genomics) as per the manufacturer’s protocol. Different cell numbers were loaded in two channels of the Chip aiming at different cell recovery. The cells were then partitioned into Gel Beads in Emulsion, where cell lysis, barcoded oligo-dT priming and reverse transcription of poly-adenylated RNA occurred, followed by library construction. Libraries were sequenced on Illumina NovaSeq 6000 at hashtag-oligos (HTO):RNA ratios of 1:9 and 1:19 for lane 1 and lane 2, respectively.
Single-cell analyses of cell hashing data
Binary base calls from the Illumina sequencer were deconvoluted via bcl2fastq to generate fastq reads consisting of two RNA libraries and two corresponding antibody hashtag libraries. Reads with the hashtag oligonucleotide barcodes were processed through the cellranger V.3.1 count pipeline7 using the Feature Barcode Analysis workflow and mouse mm10 reference genome. The cellranger output filtered counts matrixes of genes plus hashtags versus cells was analyzed using scanpy.8 Matrixes from the different libraries were concatenated with Anndata and cells filtered with <100 genes expressed plus genes filtered that were expressed in <3 cells. Hashtag counts were used to assign each predicted cell to the corresponding hashtag classification (or doublet/mutiplet/negative) with hashsolo.9 RNA count distribution and mitochondrial content were checked. Both the hashtag and RNA counts were normalized and log transformed. A hashtag-embedded Uniform Manifold Approximation and Projection (UMAP) was calculated directly from the hashtag counts. An RNA-embedded UMAP was calculated after running a principal component analysis and embedding the neighborhood graph with the top 50 principal components. Expression of selected marker genes was plotted on the RNA-embedded UMAP to facilitate manual annotation of the transcriptional cell types. Clusters were predicted with the Leiden algorithm10 and differential expression was calculated among the clusters using the Wilcoxon rank-sum test with the Benjamini-Hochberg multiple testing correction.
Statistics
For tumor growth studies, group sizes were determined using power analyses based on the variability of the tumor model in pilot studies. Tumor growth was compared between groups using a mixed-effects model with Geisser-Greenhouse correction and Tukey’s multiple comparison testing in GraphPad Prism. For survival analyses, groups were compared using a log-rank test in GraphPad Prism. For correlation analyses, non-parametric Spearman correlations were calculated in GraphPad Prism. For the comparison of cell type frequencies between whole tumor digestion (WTD) and FNA, an equivalence test11 was used with a tolerance limit of 10%. For assessing the probability of the CD45+ cell count being greater than 1000, logistic regression was performed using the ‘glm’ function in R. Cell frequencies were compared between groups using an unpaired t-test with Holm-Sidak multiple comparison testing in GraphPad Prism. Comparisons of responder and non-responder groups were analyzed using a one-way analysis of variance with Tukey’s multiple comparison testing in GraphPad Prism.
Results
Development of the FNA technique
We developed and optimized a method for non-terminal tumor sampling based on FNA to circumvent the requirement for multiple cohorts of mice to be used in order to assess both the antitumor activity and the TME at multiple timepoints (as depicted in figure 1A). We were able to successfully biopsy tumors in anesthetized mice by horizontally inserting a 25 gauge needle attached to a 1 mL syringe containing cold RPMI media, rotating the needle to dislodge tumor tissue and retracting the plunger to withdraw cells into the media in the syringe. In order to obtain samples that were both representative of the whole tumor and that contained sufficient cells for assessment by flow cytometry, FNAs were taken at four additional sites around the circumference of the tumor with all five aspirates pooled into a single sample (as shown in figure 1B). This minimally invasive procedure only required the mice to be under anesthesia for less than 5 min and no analgesia was required postsurgery.
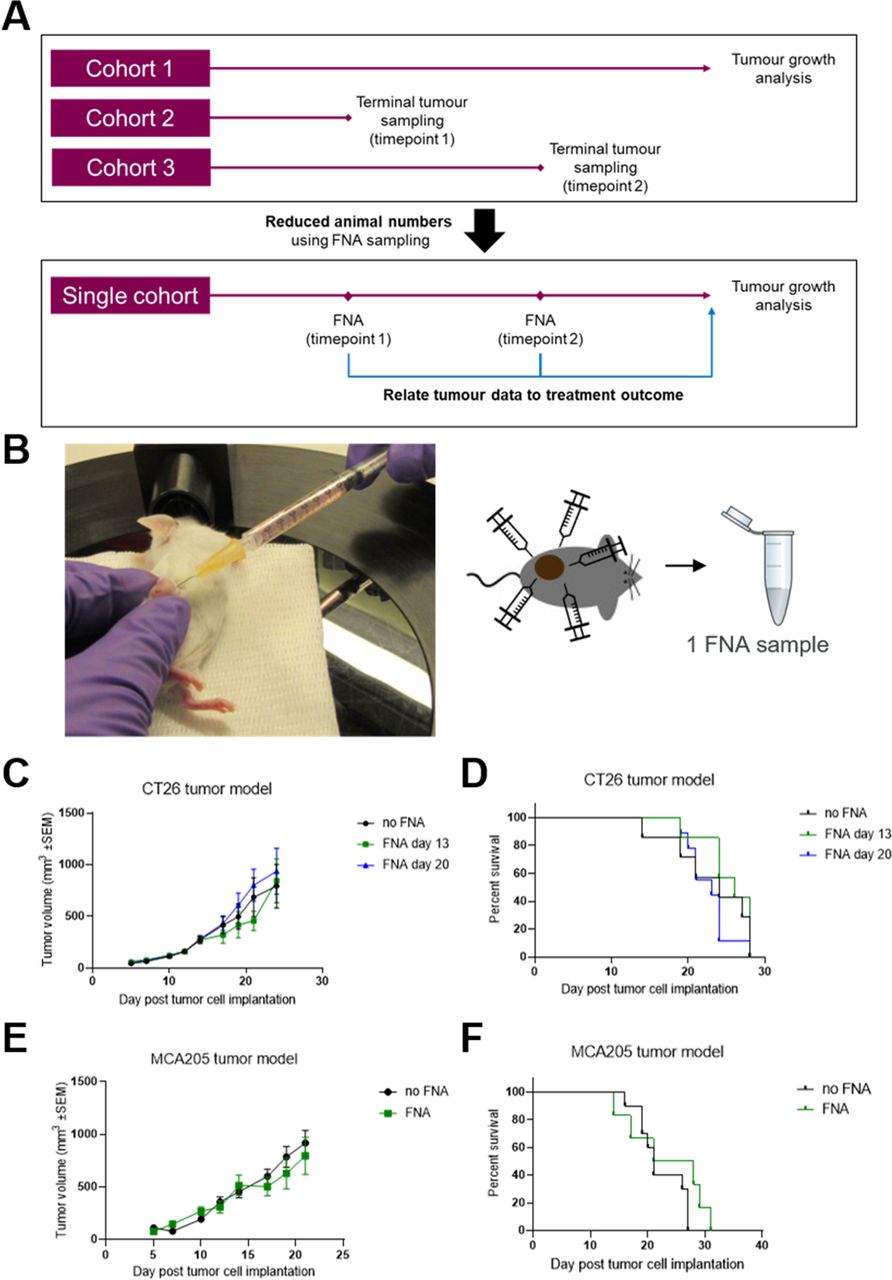
Tumor biopsy using fine needle aspiration (FNA) does not impact tumor growth or welfare. (A) Non-terminal tumor sampling using FNA can both reduce required animal numbers and enable direct correlation of tumor data with treatment outcome by using a single cohort of mice for both tumor biopsying and growth analysis. (B) Subcutaneous flank tumor-bearing mice are anesthetized and the tumor is biopsied at five sites with a 25-gauge needle, collecting the aspirate into cold media and pooling the five aspirates into a single Eppendorf tube. (C and D) Mice were subcutaneously implanted with CT26 tumors on the flank and the tumors were biopsied using FNA either 13 or 20 days later. Tumor growth over time (C) was compared between groups using a mixed effects model and time to endpoint (D) was compared between groups using a log-rank test. No significant differences were seen between FNA-biopsied and control groups. Error bars indicate the mean±SEM. Fourteen mice per group. The results represent one of two independent experiments. (E and F) Mice were subcutaneously implanted with MCA205 tumors on the flank and the tumors were biopsied using FNA 18 days later. Tumor growth over time (E) was compared between groups using a mixed effects model and time to endpoint (F) was compared between groups using a log-rank test. No significant differences were seen between FNA-biopsied and control groups. Error bars indicate the mean±SEM. Eight to 10 mice per group. The results include data from two independent experiments.
FNA biopsies do not impact tumor growth
During the optimization and validation of this technique, we sought to assess whether the use of FNA would lead to changes in the rate of tumor growth. For this, we tested the widely used CT26 syngeneic model in BALB/c mice and found that FNA biopsy did not have a significant impact on the rate of tumor growth (figure 1C, online supplemental figure 1A). Moreover, FNA biopsy of the tumors did not impact other welfare criteria, such as skin ulceration or body weight loss, that could lead to changes in the time to humane endpoint (figure 1D, online supplemental figure 1B). We confirmed these observations in a second model (MCA205) implanted in C57BL/6 mice (figure 1E,F, online supplemental figure 1C).
Supplemental material
FNA biopsies yield sufficient cells for assessment of immune cell populations by flow cytometry
As the majority of TME analysis in preclinical IO studies involves flow cytometric analysis of TILs, we assessed whether sufficient immune cells could be obtained for flow cytometry using the FNA technique. We first determined the minimum immune cell yield required from the FNA to provide data comparable to those obtained using the current method of WTD. We collected FNA samples and WTD from the same tumors across five different syngeneic models and compared the frequency of different cell types in the FNA compared with the WTD (figure 2A). When we compared the correlation of FNA and WTD samples based on the immune cell yield within the FNA, we found that FNAs containing fewer than 1000 CD45+ cells significantly deviated (defined as being greater than 10% different) from the data obtained from the WTD samples, whereas FNAs containing more than 1000 CD45+ cells were within this tolerance limit. Based on this analysis, we applied a minimum cutoff of 1000 CD45+ cells in FNA biopsies for assessment. We then collected FNA samples at a range of tumor volumes to determine whether the size of the tumor could impact on the immune cell yield within FNA samples. We found a positive correlation between the volume of the sampled tumor and the immune cell yield in the FNA sample, and this was similar across several tumor models including CT26, A20 (figure 2B, both p<0.0001) and MCA205 (online supplemental figure 2) p<0.0001). Based on this data, we were able to calculate the probability of obtaining at least the required 1000 CD45+ immune cells by FNA biopsy at a given tumor volume for both the CT26 and A20 models (figure 2C) and we found that this probability reaches 80% for tumors around 100 mm3. In our analysis of FNA samples containing more than 1000 CD45+ cells, we found that the frequency of several immune cell types, as well as subsets of those cell types expressing the proliferative marker Ki67, within FNA samples closely approximated the frequencies obtained in matched WTD samples across a range of syngeneic models including the CT26, MCA205, A20, 4T1 and RENCA models (figure 2D–H).

Fine needle aspiration (FNA) can be used to extract cells for flow cytometry at a range of tumor volumes and are representative of the whole tumor. Tumor-bearing mice were sacrificed and the tumors were biopsied using FNA before harvesting the whole tumor (whole tumor digest (WTD)). FNA and WTD samples were analyzed by flow cytometry to determine frequencies of tumor-infiltrating immune cells. (A) The optimal total CD45+ cell count in FNA samples was investigated by plotting the frequencies tumor-infiltrating immune cells (in this example the frequency of FoxP3− CD4+ T cells) obtained within matched FNA (on the x axis) and WTD (on the y axis) samples from the same tumor. These were separated based on the total number of CD45+ cells within the FNA samples: <1000 CD45+ cells (left) and >1000 CD45+ cells (right). Linear regression was used to calculate the correlation between the frequency obtained in FNA and WTD samples, indicated by the colored lines, and compared with the slope of the black line (representing a slope of 1 with identical frequencies between FNA and WTD samples). Above CD45+ cell counts of 1000 cells, the slope (m) is closer to 1, indicating increased similarity between frequencies in FNA and WTD samples. Data pooled for five tumor models (A20, CT26, MCA205, RENCA and 4T1), 10–34 mice per group. (B) FNA biopsies were collected from mice bearing either CT26 or A20 tumors and analyzed by flow cytometry to determine the total number of CD45+ tumor-infiltrating immune cells within the sample. This was plotted against the volume of the tumor on the day of FNA biopsying for each mouse and linear regression was used to calculate the correlation between the CD45+ cell count and tumor volume for both tumor models, indicated by the solid lines. One hundred twenty-four to 127 mice per group. (C) Using the data from (B), the probability of obtaining >1000 CD45+ cells within an FNA sample was calculated according to the tumor volume for both the CT26 and A20 models. (D–H) The ratio of immune cell frequencies in FNA compared with WTD samples was calculated for (D) CT26, (E) MCA205, (F) A20, (G) 4T1 and (H) RENCA tumors. A ratio close to 1 indicates similar frequencies of cells within FNA and WTD samples. Error bars indicate the mean±SEM. Four to 10 mice per group.
FNA biopsies yield sufficient cells for single-cell RNA sequencing by multiplexing the analysis using cell hashing
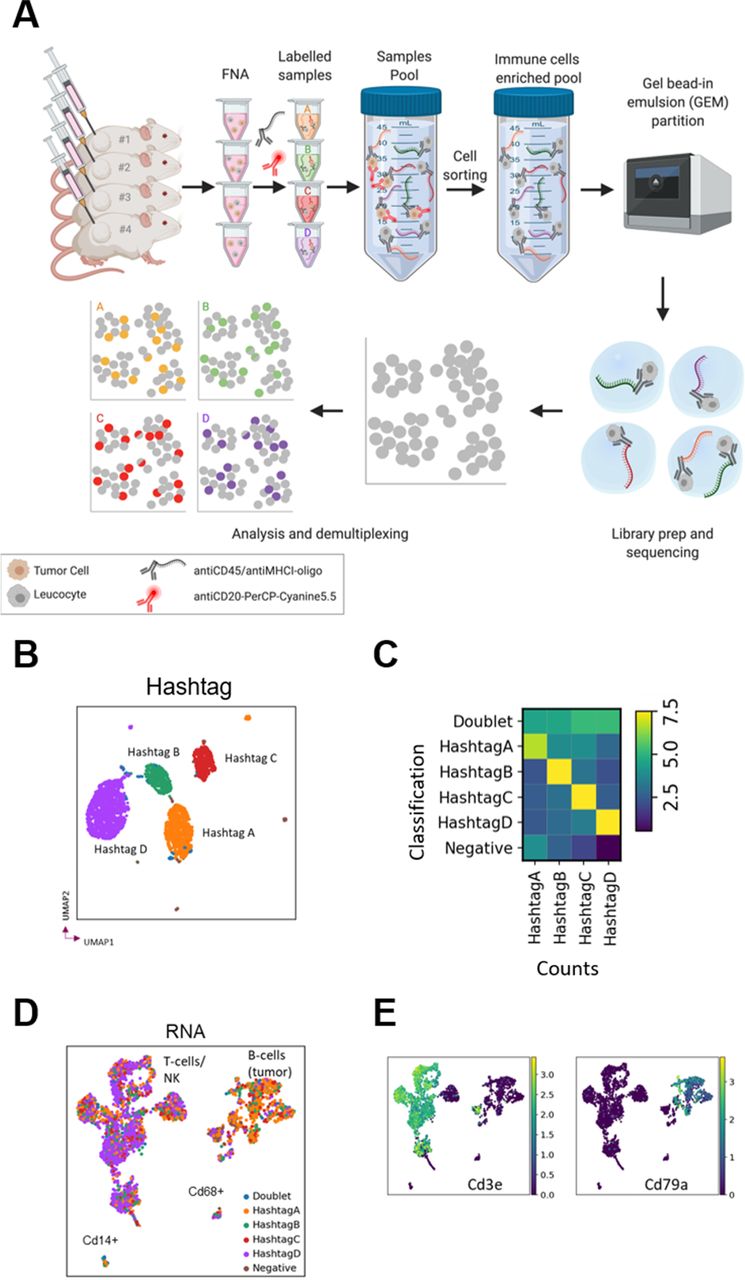
Single-cell RNA sequencing (scRNA-seq) permits high resolution characterization of the transcriptional status of cells, providing more extensive information compared with flow cytometric data. We sought to assess if scRNA-seq data could be derived from FNA biopsies. Since there are relatively few cells per FNA sample, the workflow (especially the cell sorting) required the use of cell hashing for multiplexing,12 which uses DNA-barcoded antibodies (HTO) to label samples and enable the pooling of several samples into a single run. We sequenced the single-cell RNA and DNA-tagged antibody hashtags from roughly 3000 cells from a pooled sample of four FNA biopsies and successfully deconvoluted the samples into their respective hashtag classifications and detected cross-sample multiplets (figure 3A–C).

Fine needle aspiration (FNA) enables single-cell RNA sequencing by multiplexing analysis using cell hashing. (A) FNA biopsies from four mice were labeled with DNA-barcoded antibody ‘hashtags’, pooled, sorted by FACS to enrich for immune cells and sequenced before demultiplexing and analysis. (B) UMAP embedded on hashtags colored by hashtag classification. (C) QC plot of hashtag classification versus counts of hashtag. Cells classified as HashtagA have higher counts for HashtagA, etc, while doublets present a mixed signal, and negative cells show few counts. (D) UMAP embedded on RNA colored by hashtag classification with putative cell types labeled. (E) Expression of the genes for the T cell marker CD3 and the B cell marker CD79a. UMAP, Uniform Manifold Approximation and Projection.
HTO and RNA data quality were good with high base quality scores and read mapping statistics (online supplemental table 1). We compared different ratios of HTO:RNA reads in order to determine the optimal conditions, which enable deconvolution of samples while leaving as many reads as possible for the RNA sequencing, potentially improving transcriptome coverage. We compared a ratio of 1:9 (lane 1) and 1:19 (lane 2) HTO:RNA reads and found no obvious differences in hashtag recovery rates between lanes 1 and 2 (online supplemental table 2). Therefore, we suggest that the 1:19 ratio is preferable, since it sufficiently labeled the cells, while leaving more reads for the RNA sequencing. We also compared two batches with differing cell numbers and reads per cell and we found that increasing the number of reads per cell, for example, from 54,562 to 195,370, did not result in substantially more genes being detected (online supplemental figure 3 and online supplemental table 2). Therefore, we recommend sequencing <50,000 RNA reads per cell, consistent with 10× Genomics guidelines for general scRNA-seq.
Moreover, we were able to detect the transcriptional signatures for expected cell types including T cells, NK cells, monocytes and B cells (with the latter likely representing tumor cells not removed by the tumor cell sorting in this B cell lymphoma tumor model) (figure 3D,E). We could also identify distinct putative populations of CD8+ and CD4+ cells based on expression of the Cd8a and Cd4 genes and compare gene expression across the identified cell clusters (online supplemental figure 4). Overall, we have demonstrated that we could recover good quality, reproducible and informative single-cell transcriptional data from FNA biopsies using the cell hashing strategy, demonstrating that this novel non-terminal tumor sampling technique can be combined not only with flow cytometric analysis but also with scRNA-seq, further broadening its potential to detect changes in the TME and to support biomarker discovery for oncology.
Repeat biopsies by FNA do not impact tumor growth or frequency of TILs
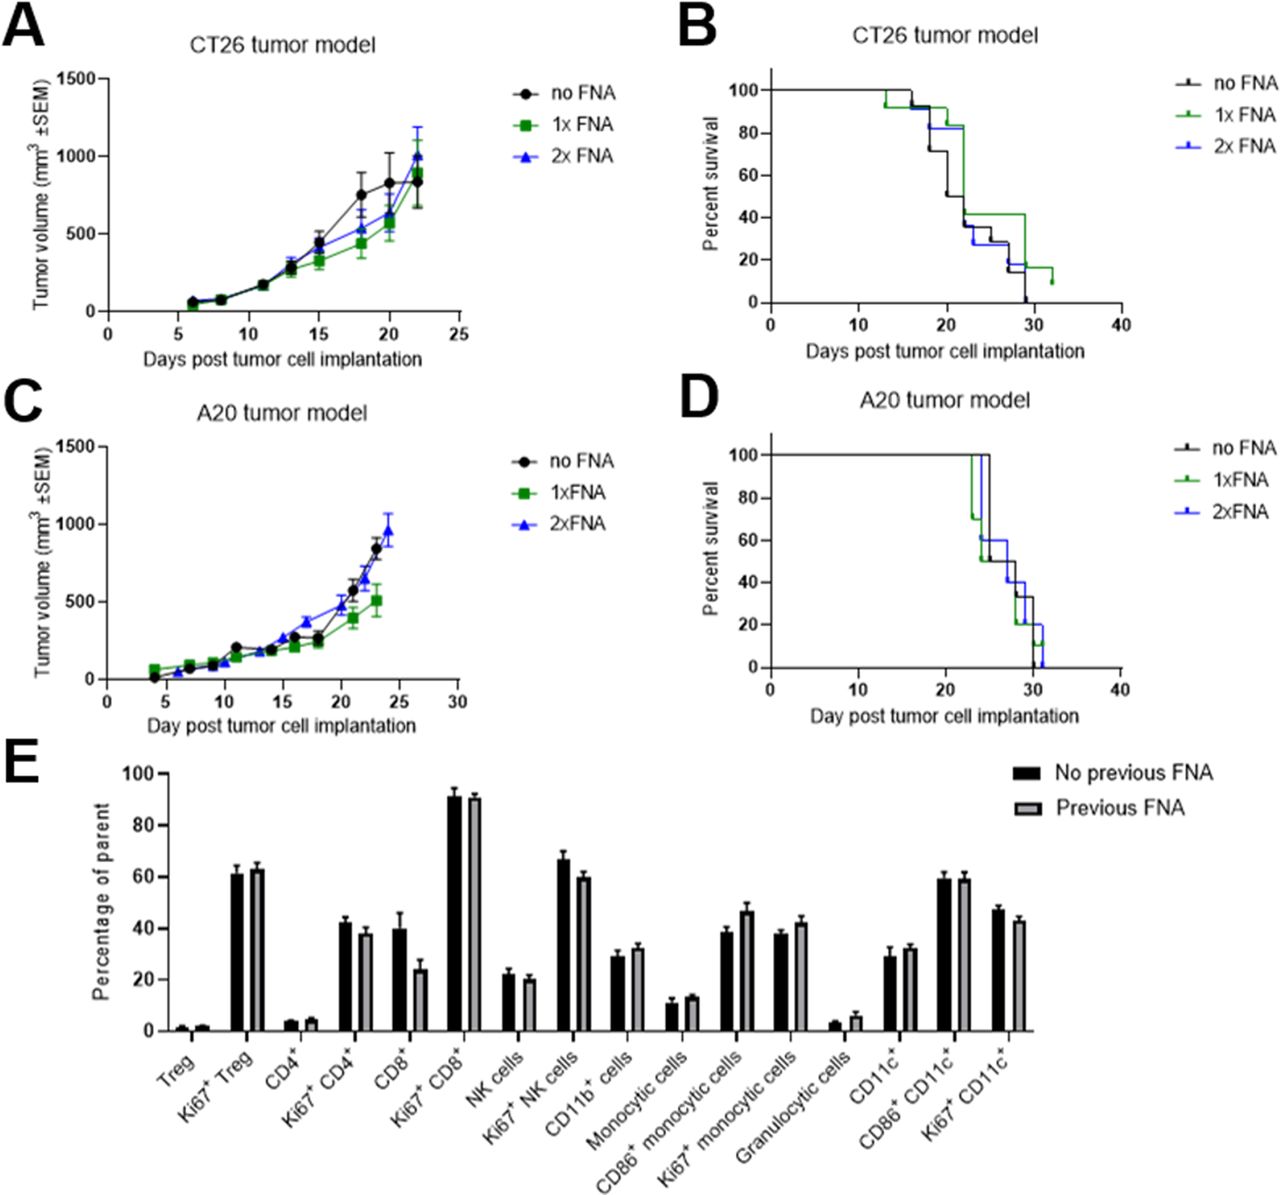
Repeat biopsies would allow the generation of longitudinal TME data from individual mice. We determined that repeated sampling did not have a significant impact on tumor growth and welfare in both the CT26 model (figure 4A,B, online supplemental figure 5A,B) and the A20 model (figure 4C,D, online supplemental figure 5C). Moreover, we also found that the procedure did not lead to any significant changes in either the frequency or proliferative state of TILs 2–3 days after FNA biopsying (figure 4E).

Fine needle aspiration (FNA) biopsies can be carried out multiple times without impacting tumor growth or the tumor immune infiltrate. (A and B) Mice were subcutaneously implanted with CT26 tumors on the flank and the tumors were biopsied using FNA 12 days later (1× FNA group) or 12 and 14 days later (2× FNA group). Tumor growth over time (A) was compared between groups using a mixed effects model and time to endpoint (B) was compared between groups using a log-rank test. No significant differences were seen between FNA-biopsied and control groups. Error bars indicate the mean±SEM. Fourteen mice per group. The results represent one of three independent experiments. (C and D) Mice were subcutaneously implanted with A20 tumors on the flank and the tumors were sampled using FNA 15 days later (1× FNA group) or 13 and 15 days later (2× FNA group). Tumor growth over time (C) was compared between groups using a mixed effects model and time to endpoint (D) was compared between groups using a log-rank test. No significant differences were seen between FNA-biopsied and control groups. Error bars indicate the mean±SEM. Six to 10 mice per group. The results include data from three independent experiments. (E) Two to 3 days after FNA biopsying of CT26 tumors, the frequencies of 16 subsets of tumor-infiltrating immune cells were compared with those in mice that had not undergone FNA biopsying. For each subset, the groups were compared using a t-test with Holm-Sidak multiple comparison testing. No significant differences were seen between FNA-biopsied and control groups. Error bars indicate the mean±SEM. Five to 15 mice per group. The results include data from two independent experiments.
FNA biopsies enable paired assessment of PD biomarkers and response to IO treatments
Initially, we confirmed that sampling by FNA did not influence the response to IO treatment with either an immune-activating therapy (GITR ligand fusion protein) or an immune checkpoint inhibitor (anti-CTLA-4 antibody) when compared with control groups that were not biopsied (figure 5A–F, online supplemental figure 6). Moreover, we applied the FNA biopsy method to try and identify treatment-induced changes in the frequency of TILs. For this, we treated CT26 tumors with GITR ligand fusion protein (GITRL-FP) and collected FNA biopsies and WTD samples from matched tumors 7 days later. We found that the PD effects of GITRL-FP treatment on TILs could be readily detected using both the non-terminal FNA sampling technique and the conventional WTD method, with a reduction in the frequency of regulatory T cells (Treg) and an increase in the frequency of CD8+ T cells within tumors observed using both methods (figure 5G–I).
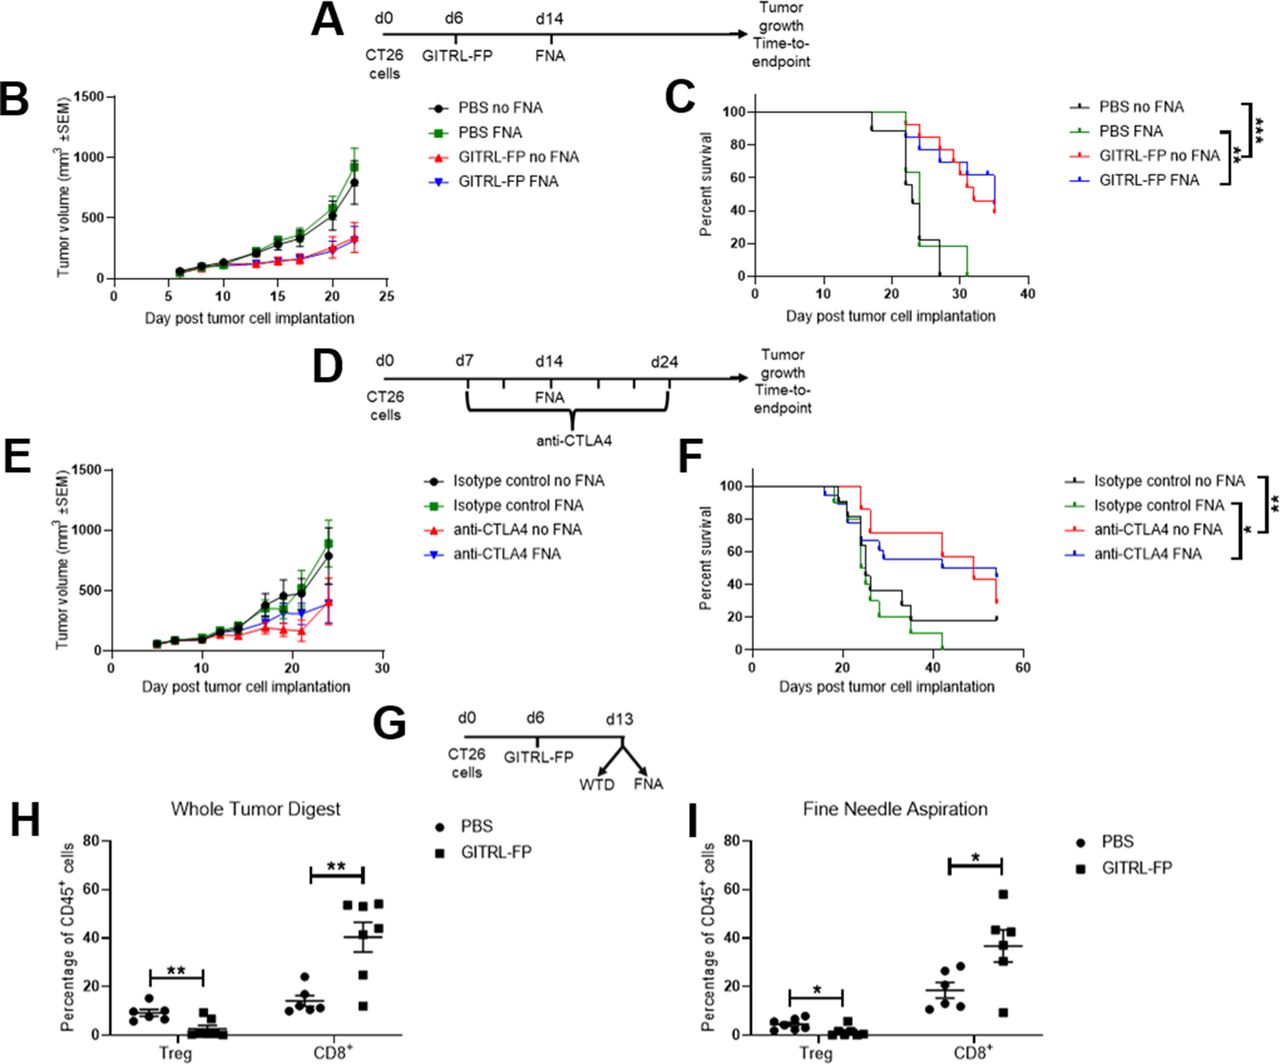
Fine needle aspiration (FNA) does not affect response to immuno-oncology treatments and can detect changes in tumor-infiltrating immune cells in response to immuno-oncology treatment. (A–C) CT26 tumor-bearing mice were treated with 0.2 mg/kg GITRL-FP on day 6 and half of the mice were biopsied using FNA on day 14. Tumor growth over time (B) was compared between groups using a mixed effects model and time to endpoint (C) was compared between groups using a log-rank test. Similar effects of treatment were seen between FNA-biopsied and control groups. Error bars indicate the mean±SEM. **p<0.01 and ***p<0.001. Fourteen mice per group. (D–F) CT26 tumor-bearing mice were treated with 10 mg/kg anti-CTLA-4 antibody or isotype control two times per week from day 7 for six doses and half of the mice were biopsied using FNA on day 14. Tumor growth over time (E) was compared between groups using a mixed effects model and time to endpoint (F) was compared between groups using a log-rank test. Similar effects of treatment were seen between FNA-biopsied and control groups. Error bars indicate the mean±SEM. *p<0.05 and **p<0.01. Fourteen to 28 mice per group. (G–I) CT26 tumor-bearing mice were treated with 1 mg/kg mouse GITRL-FP on day 6 and sacrificed on day 13. Tumors were biopsied using FNA before harvesting the whole tumor digest (WTD). Similar effects of treatment were seen on the frequencies of Treg and CD8+ T cells in both the WTD (H) and FNA (I) samples. Groups were compared using a t-test with Holm-Sidak multiple comparison testing. Error bars indicate the mean±SEM. Six to 7 mice per group. PBS, phosphate-buffered saline; GITRL-FP, glucocorticoid-induced TNFR-related protein ligand-fusion protein.
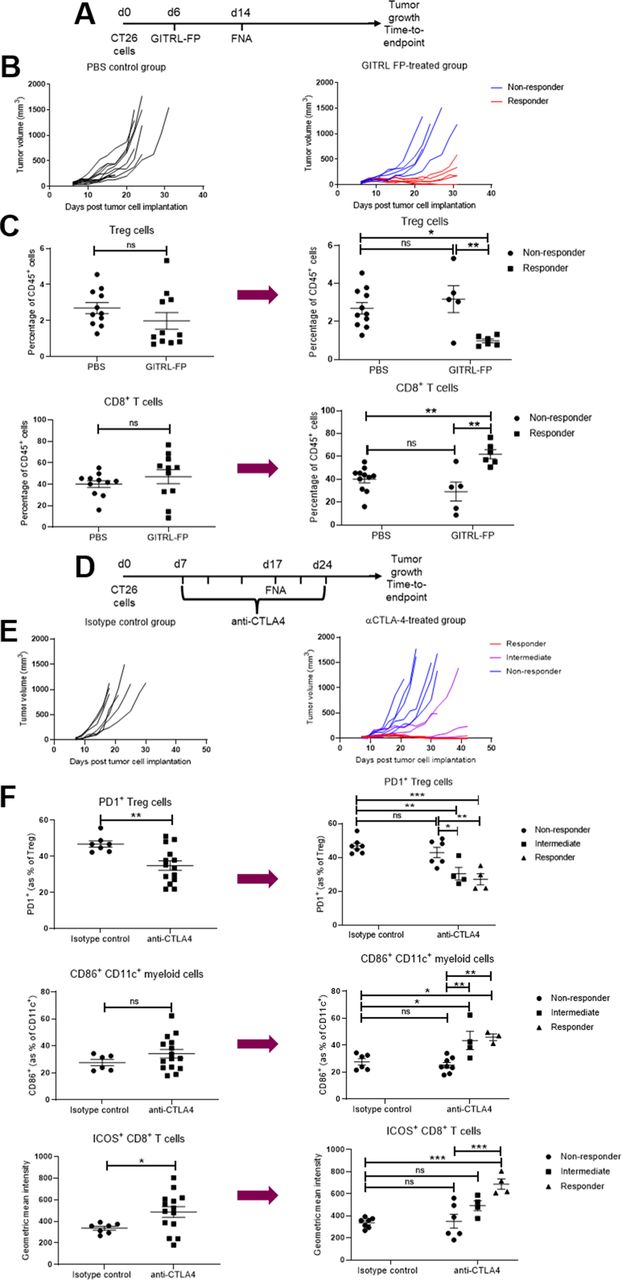
In light of these findings, we applied the FNA method to compare the PD changes in TILs between responder and non-responder populations. We took biopsies from mice 8 days after treatment with a suboptimal dose of GITRL-FP that typically leads to only a subset of the treated mice showing tumor growth inhibition (figure 6A,B). When we investigated the effect of treatment by comparing the entire GITRL-FP-treated group to the untreated control group (figure 6C, left panels), we did not detect any significant changes in the frequency of Treg cells or CD8+ T cells. In contrast, when the treated group was then subdivided into responder and non-responder subsets post hoc based on the outcome of treatment, significant differences were observed between the responder and non-responder groups as well as between the responder and control groups (figure 6C, right panels). After treatment with GITRL-FP, FNA biopsies revealed a significant decrease in the frequency of Treg cells and an increase in the frequency of CD8+ T cells in the tumor in the subset of responder mice.

Fine needle aspiration (FNA) enables biomarker-based identification of responders and non-responders from cohorts exhibiting mixed responses. (A–C) CT26 tumor-bearing mice were treated with 0.2 mg/kg GITRL-FP on day 6 and the tumors were biopsied using FNA on day 14. (B) The study was then continued to determine tumor growth inhibition in response to treatment. (C) Flow cytometric analysis of the FNA biopsies from day 14 was used to compare the effect of treatment on the frequencies of Treg (top row) and CD8+ T cells (bottom row), either comparing the entire treated group to the control group (left panels) or subdividing the treated group into responder and non-responder groups post hoc based on the outcome of the tumor growth inhibition study (right panels). Groups were compared using either a t-test or a one-way analysis of variance (ANOVA) with Tukey’s multiple comparison testing. Error bars indicate the mean±SEM. *p<0.05, **p<0.01 and NS indicates no significant difference. Five to 11 mice per group. (D–F) CT26 tumor-bearing mice were treated with 10 mg/kg anti-CTLA-4 antibody or isotype control two times per week from day 7 for six doses and the tumors were biopsied using FNA on day 17. (E) The study was then continued to determine tumor growth inhibition in response to treatment. (F) Flow cytometric analysis of the FNA biopsies from day 17 was used to compare the effect of treatment on the frequency of PD1-expressing Treg cells (top row), the frequency of CD86-expressing CD11c+ myeloid cells (middle row) and the geometric mean fluorescence intensity of ICOS on CD8+ T cells (bottom row), either comparing the entire treated group to the control group (left panels) or subdividing the treated group into responder, intermediate and non-responder groups post hoc based on the outcome of the tumor growth inhibition study (right panels). Groups were compared using either a t-test or a one-way analysis of variance with Tukey’s multiple comparison testing. Error bars indicate the mean±SEM. *p<0.05, **p<0.01, ***p<0.001 and NS indicates no significant difference. Four to 14 mice per group. The results represent one of two independent experiments. GITRL-FP, glucocorticoid-induced TNFR-related protein ligand-fusion protein.
Similarly, we sought to investigate whether we could also apply FNA biopsies to investigate biomarkers of response to anti-CTLA-4 blockade. For this analysis, we compared the TILs of mice that went on to have complete responses, intermediate responses or no response to treatment (figure 6D–F). We found that the expression of the PD-1 receptor on Treg cells was decreased in mice with intermediate or complete responses to anti-CTLA-4 blockade compared with non-responder mice or control-treated mice (figure 6F, top row). Moreover, the intermediate and complete responder groups could be distinguished from the non-responder or control-treated mice based on their increased expression of CD86 on CD11c+ myeloid cells (figure 6F, middle row). On CD8+ T cells, the level of expression of ICOS was significantly increased only in the responder mice but not in the intermediate or non-responder mice (figure 6F, bottom row). These findings demonstrate the value of using non-terminal FNA sampling to relate PD changes in the TME to therapeutic response and highlight the potential of this technique in biomarker discovery for IO.
Discussion and conclusions
In this study, we have developed and validated a non-terminal subcutaneous tumor sampling method using FNA and investigated its application to preclinical IO studies. Based on the use of FNA as a sampling method in the clinic, we sought to assess its potential to also support TME rather than tumor cell sampling. When assessing the feasibility of applying FNA to subcutaneous flank tumors in mice, we found very few studies that used this method to collect tumor tissue.13–15 To the best of the authors’ knowledge, only a single study has applied FNA to enumerate TILs in a single model.15 Here, we present a significant improvement of this technique that increases the yield of immune cells obtained by more than 10-fold and we demonstrate its suitability across five different syngeneic subcutaneous flank tumor models. Moreover, we establish that this technique is compatible with impactful readouts such as flow cytometry and single-cell RNA sequencing that permit extensive analysis of the TME. Therefore, by implementing this novel technique instead of using extra satellite groups of animals sacrificed for collection of tumor tissue, the number of mice used for the preclinical investigation of oncology therapies can be significantly reduced, supporting the principles of the 3Rs of animal research. Furthermore, we also demonstrate the profound potential of this method in supporting biomarker discovery, by applying the technique to compare the TME of responder and non-responders mice after treatment with IO therapies.
A key limitation with the FNA technique is the yield of immune cells obtained and the increased risk this represents in terms of sampling bias. Although we found that this sampling bias is limited by the collection of aspirates at five different sites around the tumor, we show that the correlation of results between biopsy and whole tumor analysis was weaker when very few cells were obtained in the FNA samples. We determined an empirical cutoff value of 1000 immune cells above which our FNA biopsy technique was able to closely approximate results obtained using the conventional approach of whole tumor digestion, even for immune cell subsets found at frequencies as low as 1% of the total immune cell population. For rare cell subsets, further validation studies would be warranted to determine the appropriate yield required for FNA analysis. We also found that this minimal yield cutoff value was similar across the five different syngeneic tumor models evaluated and that yield correlated with the tumor volume at the time of FNA biopsying. This correlation enabled us to generate probability curves to calculate the likelihood of obtaining the minimal required cell count by FNA sampling at a given tumor volume and we found these probabilities to again be similar across the different models. Further work is warranted to assess whether this sampling technique could be compatible with certain orthotopic tumor models, for example, by using ultrasound-guided FNA sampling. Moreover, we have also found that FNA biopsying yields sufficient material for genomic or transcriptomic analysis and is even suitable for single-cell RNA sequencing by using cell hashing to multiplex the analysis.
In addition to the advantages this method presents to reduce the number of animals used, we have also investigated the potential to apply this technique to support biomarker discovery. Despite extensive investigation of potential biomarkers, it has proved challenging to find actionable predictive or response biomarkers of treatment, with the majority of these being identified in the clinical setting. To date, biomarker discovery has mainly uncovered correlations between response and features of the TME (rather than blood-based biomarkers) such as PD-L1 expression level in the tumor,16 tumor mismatch repair deficiency,17 tumor mutational burden18 or enrichment of immune gene expression signatures in tumor tissue.19 20 Cellular features of the TME have also been correlated with improved response to treatment in a subset of studies, such as higher densities of CD8+ T cells.21 The collection and interrogation of tumor biopsies in the preclinical setting have the potential to support earlier biomarker discovery and even go beyond enumerating TILs by assessing their functional status, for example, with intracellular cytokine staining (online supplemental figure 7). Several studies have begun investigating preclinical biomarker discovery, with the most compelling data to date being generated by using a surgical tumor resection method where one tumor is removed in mice bearing tumors on both flanks.22–24 However, there are several limitations with this method, including the time required to undertake the procedure and the variability associated with the TME contexture of two independent tumors that may not have symmetrical responses to treatment.24 Moreover, as recently described by Zemek et al,24 out of seven syngeneic tumor cell lines tested, only two were found to be amenable for the investigation of biomarkers of response to anti-PD-L1 and anti-CTLA-4 antibodies using the surgical resection technique. In contrast, we have biopsied six tumor models to date with the FNA method and, with the exception of the B16F10 model due to its fluid-filled core, they have all been compatible with this technique. Furthermore, compared with FNA biopsying, the tumor resection method represents a more invasive technique requiring surgical intervention, administration of analgesia and the removal of surgical staples 7 days after the sampling. In contrast to this, the FNA method is less invasive, does not require the use of analgesia and does not require increased post-procedural monitoring.
Another key advantage of the FNA biopsying method we describe here is the ability to carry out sampling of the same animal at multiple timepoints. We show no impact of biopsying the same tumor twice at an interval of 2 to 3 days and we have been able to increase the frequency of FNA biopsying up to four times per animal so far without observing any significant impact on tumor growth or animal welfare (online supplemental figure 8). This represents a substantial advantage by providing the capacity for longitudinal analysis of the TME and its subsequent correlation with treatment outcome (online supplemental figure 9).
In summary, we describe a simple, fast, minimally invasive method utilizing FNA for non-terminal tumor sampling and validate it for use in several frequently used syngeneic mouse models. This technique has the potential to significantly reduce animal use in preclinical oncology research as well as support biomarker discovery by enabling longitudinal sampling and analysis of the TME to allow for direct correlation of the TME to treatment outcome.
Data availability statement
All data relevant to the study are included in the article or uploaded as online supplemental information.
Ethics statements
Ethics approval
All animal procedures were performed in accordance with the UK Animal (Scientific Procedures) Act 1986 and EU Directive 86/609 under a UK Home Office Project License and approved by the Babraham Institute Animal Welfare and Ethical Review Body, Cambridge, UK.
Acknowledgments
We wish to thank the Animal Sciences and Technologies team and the Tissue Culture team at AstraZeneca for their support in conducting these studies and Dmitry Gabrilovich for reviewing the manuscript. Figures were created with BioRender.com.
References
Supplementary materials
Supplementary Data
This web only file has been produced by the BMJ Publishing Group from an electronic file supplied by the author(s) and has not been edited for content.
Footnotes
Contributors SIS designed research studies, conducted experiments, acquired and analyzed data and wrote the manuscript. SM-T, EG, SK and KM designed research studies, conducted experiments, acquired and analyzed data. CR analyzed the data and wrote the manuscript. JEA, KMI and GR conducted experiments. TZ analyzed the data. HG, MJR, RWW, TS and SJD supervised the work and SJD edited the manuscript.
Funding This work was funded by AstraZeneca.
Competing interests All authors were employees of and shareholders in AstraZeneca at the time of the study.
Provenance and peer review Not commissioned; externally peer reviewed.
Supplemental material This content has been supplied by the author(s). It has not been vetted by BMJ Publishing Group Limited (BMJ) and may not have been peer-reviewed. Any opinions or recommendations discussed are solely those of the author(s) and are not endorsed by BMJ. BMJ disclaims all liability and responsibility arising from any reliance placed on the content. Where the content includes any translated material, BMJ does not warrant the accuracy and reliability of the translations (including but not limited to local regulations, clinical guidelines, terminology, drug names and drug dosages), and is not responsible for any error and/or omissions arising from translation and adaptation or otherwise.