Article Text

Abstract
Background Therapies based on targeting immune checkpoints have revolutionized the treatment of metastatic melanoma in recent years. Still, biomarkers predicting long-term therapy responses are lacking.
Methods A novel approach of reference-free deconvolution of large-scale DNA methylation data enabled us to develop a machine learning classifier based on CpG sites, specific for latent methylation components (LMC), that allowed for patient allocation to prognostic clusters. DNA methylation data were processed using reference-free analyses (MeDeCom) and reference-based computational tumor deconvolution (MethylCIBERSORT, LUMP).
Results We provide evidence that DNA methylation signatures of tumor tissue from cutaneous metastases are predictive for therapy response to immune checkpoint inhibition in patients with stage IV metastatic melanoma.
Conclusions These results demonstrate that LMC-based segregation of large-scale DNA methylation data is a promising tool for classifier development and treatment response estimation in cancer patients under targeted immunotherapy.
- biostatistics
- immunotherapy
- melanoma
- tumor biomarkers
- biomarkers
- tumor
Data availability statement
Data are available in a public, open access repository. All data relevant to the study are included in the article or uploaded as supplementary information. All data analyzed and/or generated within this study are included in the article and the supplementary data files. Raw data IDAT files as well as processed data of the ICI cohort are accessible via Gene Expression Omnibus (GEO, https://www.ncbi.nlm.nih.gov/geo/ ; GSE175699). Any other relevant data are available upon reasonable request.
This is an open access article distributed in accordance with the Creative Commons Attribution Non Commercial (CC BY-NC 4.0) license, which permits others to distribute, remix, adapt, build upon this work non-commercially, and license their derivative works on different terms, provided the original work is properly cited, appropriate credit is given, any changes made indicated, and the use is non-commercial. See http://creativecommons.org/licenses/by-nc/4.0/.
Statistics from Altmetric.com
Background
Malignant melanoma accounts for one of the most frequent cancer types and shows a rising incidence over the past years.1–3 Prognosis and treatment implications highly depend on the melanoma stage classified by the criteria of the American Joint Committee on Cancer (AJCC).4 5 The presence of distant metastases defines stage IV and thus advanced melanoma4 with patients facing a considerably poorer prognosis than in earlier melanoma stages. However, overall survival (OS) significantly improved due to novel therapy options.6 Among these, immune checkpoint inhibitors (ICI) modulating the anticancer immune response developed toward a promising treatment in tumors of various cancer entities.7 8 In metastatic melanoma, ICIs were approved as an effective therapy option. Of these, the combinatorial blockage of the immune checkpoints cytotoxic T-lymphocyte-associated protein 4 (ipilimumab) and programmed cell death protein 1 (PD-1, nivolumab/pembrolizumab) displayed the highest objective response rate in a phase III randomized clinical trial with 58% in the ipilimumab plus nivolumab arm compared with 19% in the ipilimumab monotherapy arm.9 Furthermore, multicenter studies have shown that anti-PD1-monotherapy (nivolumab, pembrolizumab) achieves response rates of up to 40% in treatment naïve patients and about 27%–35% in pretreated melanoma patients.9–12 However, treatment resistance to ICIs remains a relevant issue. Equally important, serious immune-related adverse events (irAE) display a major challenge, particularly under combinatorial therapy which frequently lead to discontinuation of ICI treatment.13 14
Unfortunately, knowledge of biomarkers predicting response to ICI treatment15–17 or the occurrence of serious irAE is still limited. The expression of PD-1/PD-L1 (programmed death-ligand 1) as predictive biomarkers for treatment response to ICIs remains controversial15 16 and lack of PD-L1 expression in melanoma is not necessarily associated with treatment failure.18 An innovative approach to investigate the relation between the immunological tumor microenvironment and ICI treatment response is the development of computational methods. These methods aim at processing and implementing large-scale proteomic, metabolomic, transcriptomic, genetic and epigenetic data. As an example, the transcriptome-based algorithm Tumor Immune Dysfunction and Exclusion (TIDE) explores genes interfering with or promoting T-cell function.19 In this context, emerging genomic determinants of response to ICIs have been studied extensively.20 As a unique feature, epigenetic signatures are subjected to slower and sustained transformations within the dynamic changes of the tumor microenvironment. Certain DNA methylation patterns are cell-type-specific and therefore deconvolution of DNA methylation data enables the analysis of cellular composition21 as well as a precise brain tumor classification.22 With regard to potential epigenetic biomarkers, a particular DNA methylation profile among non-small cell lung cancer tissue samples from patients receiving ICI treatment was associated with an improved outcome, whereas mere PD-L1 expression, levels of tumor-infiltrating lymphocytes or the mutational load had no prognostic effects.23 Global differential DNA methylation patterns between melanoma samples might correlate with biological behavior and immunological processes.24 Moreover, immune cell methylation patterns might serve as prognostic biomarkers in melanoma.25 Taken together, there is still a lack of reliable biomarkers for the prediction of a successful therapy response after ICI treatment. DNA methylation profiling might be a robust approach for the development of prognostic or even predictive biomarkers in cancer, as so far, there is still a lack of reliable biomarkers for the prediction of a successful therapy response after ICI treatment.
In the current study, we investigated tumor DNA methylation patterns of two independent cohorts of melanoma patients using a novel computational approach of stepwise reference-free and reference-based tumor deconvolution with the aim to develop a machine learning classifier that allows for the prediction of a long-term therapy response in ICI-treated metastatic melanoma.
Methods
Sample selection and data acquisition of the ICI melanoma cohort
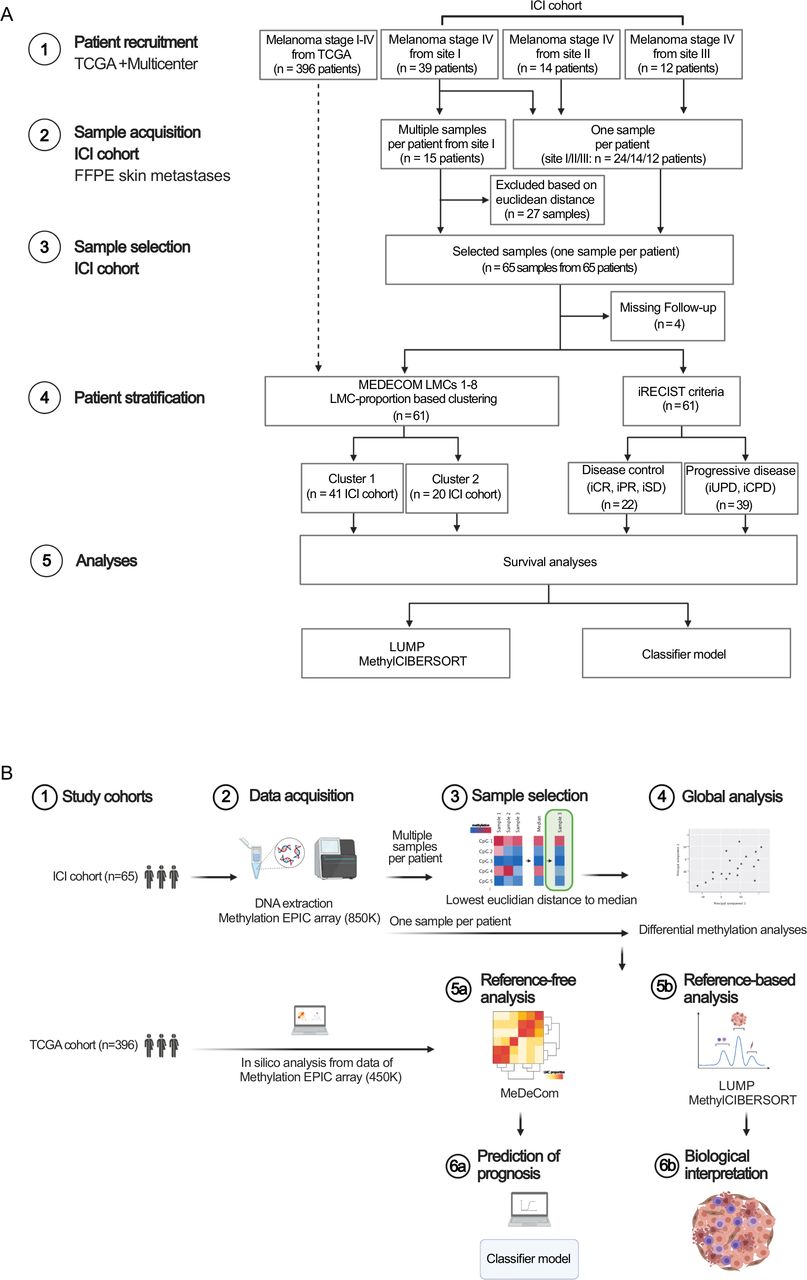
The ICI cohort comprised cutaneous metastases of AJCC stage IV (eighth edition) melanoma patients treated in three different dermato-oncology centers (sites I–III) in Germany. Formalin-fixed and paraffin-embedded (FFPE) tissue samples (deriving from the biobank of the Department of Dermatology, Goethe-University, Frankfurt am Main, Germany, from the Institute of Pathology, Charité—Universitätsmedizin Berlin, Berlin, Germany and from the Department of Dermatology, University Hospital Würzburg, Würzburg, Germany) treated with ICIs between October 2010 and December 2020 were included. Clinical outcome was measured as survival under ICI therapy (defined as the time from start of ICI treatment to date of decease) and OS (defined as the time from primary diagnosis of melanoma to date of decease). Additionally, radiological response to ICI treatment was classified by Response Evaluation Criteria in Solid Tumours for immune-based therapies (iRECIST: iCPD, confirmed progressive disease; iUPD, unconfirmed PD; iSD, stable disease; iPR, partial response and iCR, complete response). Hereby, patients with disease control (DC, defined as iCR, iPR or iSD in at least one ICI treatment approach) were discriminated from patients with progressive disease (PD, defined as iUPD or iCPD). We additionally included the following parameters for each patient: epidemiological characteristics (sex, age), BRAF and NRAS mutation status and brain metastases status (yes vs no) (detailed information on the patient cohort and study workflow is depicted in figure 1 and online supplemental table 1). Data not passing well-established quality controls were excluded. In case of multiple samples per patient at site I, we selected the representative sample per patient according to the minimum euclidean distance of its methylation profile to the median profile (figure 1). Finally, the ICI cohort consisted of 65 samples from 65 patients (from sites I–III) of which 61 patients received complete radiological workup according to iRECIST (figure 1). The study protocol was endorsed by the local ethical committee (SNO-5-2019).
Supplemental material

Consort diagram and study workflow. (A) Consort flow diagram of the retrospective study process resulting in the TCGA melanoma cohort (in silico data analyses) and the ICI cohort (acquisition of FFPE cutaneous metastases samples from melanoma stage IV patients treated with ICI at the study sites I–III). (B) Study workflow. Schematics were created using bioRENDER software (https://biorender.com/). FFPE, formalin-fixed and paraffin-embedded; ICI, immune checkpoint inhibitor; LMC, latent methylation components; TCGA, The Cancer Genome Atlas.
Data acquisition of the TCGA melanoma cohort
Clinical data of initially 470 patients suffering from melanoma were retrieved from The Cancer Genome Atlas (TCGA) data archive (TCGA SKCM). Clinical annotations included sex, age, AJCC tumor stages and site of tumor resection/biopsy. As the information on exact AJCC tumor stages (A, B, C and D) was missing in 98 cases, we annotated the simplified AJCC stages I–IV. Comprehensive data on ICI treatment or radiological therapy response were not eligible for this cohort. Corresponding raw intensity data (IDAT) files generated by use of the 450 k Human Methylation Array (Illumina, San Diego, USA) were retrieved using the TCGA Genomic Data Commons tool. Data not passing well-established quality controls, patients with incomplete clinical annotations as well as melanoma in situ patients of AJCC stage 0 were excluded from the study resulting in 396 patients to set up the so-called TCGA melanoma cohort.
Human methylation EPIC array of the ICI melanoma cohort
While TCGA data were available as 450 k Human Methylation array IDATs, for the ICI cohort of stage IV melanoma cutaneous metastases, we used the Human Methylation EPIC array (Illumina, San Diego, USA) comprising over 850 000 CpG sites by analysis of representative tissue punches or macrodissected 10 µm thick tumor slides from FFPE blocks. We followed standard protocols for tissue and DNA processing. Further processing of the microarrays and hybridization as well EPIC beadchip scanning were performed as indicated by the manufacturer.
DNA methylation data processing
DNA methylation data was obtained as IDAT files, which were used as input to the RnBeads software package. Quality control was performed using the built-in control probes on the EPIC array, and the data showed high overall quality. Furthermore, CpGs were filtered according to detection p-values, and annotated single nucleotide polymorphisms, sites on the sex chromosomes and potentially cross-reactive sites were discarded from the analysis.26 Methylation data were normalized using the “dasen” method from the wateRmelon R-package.26 TCGA methylation data were processed analogously.
Global DNA methylation analyses
In a first approach, all eligible CpG sites passing quality controls in 65 tumor bulk samples were enrolled in principal component analysis (PCA). In addition, differential methylation analysis for all eligible CpG sites using RnBeads was performed comparing patient groups with different clinical characteristics like the melanoma subtype, BRAF or NRAS mutation status, absence or presence of brain metastases or radiological DC versus PD according to iRECIST. Raw data IDAT files as well as processed data of the ICI cohort are accessible via Gene Expression Omnibus (https://www.ncbi.nlm.nih.gov/geo/; GSE175699).
Reference-free MeDeCom analysis
DNA methylation data of the bulk tumor samples of the TCGA melanoma cohort and the ICI cohort were investigated using the reference-free MeDeCom algorithm that dissects DNA methylation data into major components of variation, called latent methylation components (LMC).27 DNA methylation data of melanoma patients were processed according to a recently published protocol.28 The protocol selected the 5000 most variably methylated CpG sites across the samples as input to MeDeCom. Investigation of the cross-validation error and of the objective value for the parameter number of LMCs (kappa) and the regularization parameter (lambda) were performed, resulting in a set of LMCs. In order to prevent a strong dependence of the clustering on the LMC with the highest proportion across the samples, we decided to standardize the LMC proportions using z-scores. This allows for uncovering fine-grained changes in the LMC proportions and identification of subtle differences between the samples. LMC proportion values were standardized by subtracting the respective column mean and dividing by the column SD. Standardization was performed for LMCs 1–8 of all samples collectively (TCGA and ICI cohort), and separately in the TCGA and ICI cohort. Standardized LMC proportion-based clusters were further investigated regarding their prognostic and predictive significance. Hierarchical cluster analysis was performed using Ward’s minimum variance method.
Reference-based LUMP algorithm
To estimate the leukocyte content in the bulk tumor samples, the leukocyte unmethylation for purity (LUMP) algorithm as implemented within RnBeads was employed. LUMP provides leukocyte ratios from the DNA methylation data by screening for 44 CpG sites particularly hypomethylated in leukocytes.29 30
Reference-based MethylCIBERSORT algorithm
For a detailed deconvolution of the cellular composition of bulk melanoma samples, we applied the reference-based analysis MethylCIBERSORT. MethylCIBERSORT relies on DNA methylome-based reference data to infer distinct cellular contents (cancer cells, CD14-positive, CD19-positive, CD56-positive and CD8-positive cells, T regulatory cells, CD4-positive effector cells, eosinophils, fibroblasts and neutrophils). Methylation patterns of the sample of interest are compared with deposited cell-type-specific and determinating DNA methylomes.31 32 MethylCIBERSORT analysis was carried out according to the respective protocols.32 Briefly, EPIC array IDAT sets were imported in R’s “minfi” package to perform quality checks, Noob normalization and acquisition of beta values. Using the “MethylCIBERSORT” R package, a mixture file was built whose matrix consisted of beta values for comparison to a reference matrix (provided by TRF). This reference file contained signature methylation beta values of well-characterized cell types. After generating the mixture file, mixture and reference files were uploaded onto the CIBERSORT portal and deconvoluted (provided by the Alizadeh Lab, Stanford University, USA, developed by Newman et al31).
Patient classifier
A patient classifier based on the 5000 most variable methylated CpGs selected for MeDeCom tumor deconvolution was developed for patient allocation to predictive LMC proportion-based clusters. Based on these CpG sites, we employed logistic regression using Lasso regularization (glmnet R-package)33 to predict whether a tumor sample would belong to the beneficial LMC proportion-based cluster or to the less beneficial cluster. Finally, this shrinkage led to 20 predictive CpGs. We employed nested 10-fold cross-validation to estimate model performance and the hyperparameter lambda simultaneously.
Statistics
All statistical analyses were conducted using either JMP16 (SAS, Cary, USA) or R (R Core Team, 2019). The non-parametric Wilcoxon’s test was applied for comparisons of data distributions between two groups. Kaplan-Meier survival curves were compared by log-rank and Wilcoxon’s test. Likelihood ratios and risk ratios were computed in univariate proportional hazard models. Hierarchical clustering was performed by use of the Ward’s minimum variance method.
Results
Workflow and cohort statistics
To identify prognostic DNA methylation signatures in melanoma patients, we first performed global approaches for dimensional reduction of large-scale DNA methylome data. As a next step, we used reference-free and reference-based tumor deconvolution analyses, which allowed for development of a patient classifier and a biological interpretation of results (figure 1). The TCGA melanoma cohort comprised 396 tumor samples located in skin, soft tissue, central nervous system, peripheral, non-central nervous system organs and lymph nodes, respectively. Tumors from all AJCC tumor stages I–IV were included (figure 1). For validation of the TCGA cohort statistics, we performed Kaplan-Meier survival analysis which revealed that the applied simplified AJCC stages I–IV were prognostic (figure 2A). The ICI cohort included tissue from cutaneous metastases of 65 patients with AJCC stage IV melanoma treated with ICI therapy exclusively. Regarding the mutational status, 45.3% of the primary tumors showed a BRAF mutation, while 25.6% were NRAS mutant. Brain metastases were observed in 40% of all patients (online supplemental table 1). We assessed OS, survival under ICI treatment as well as the radiological disease response assigning patients to either DC or PD. The Kaplan-Meier analysis of the survival under ICI therapy stresses a benefit in patients responding to ICI therapy according to the iRECIST criteria, thus proving cohort stringency (figure 2A).
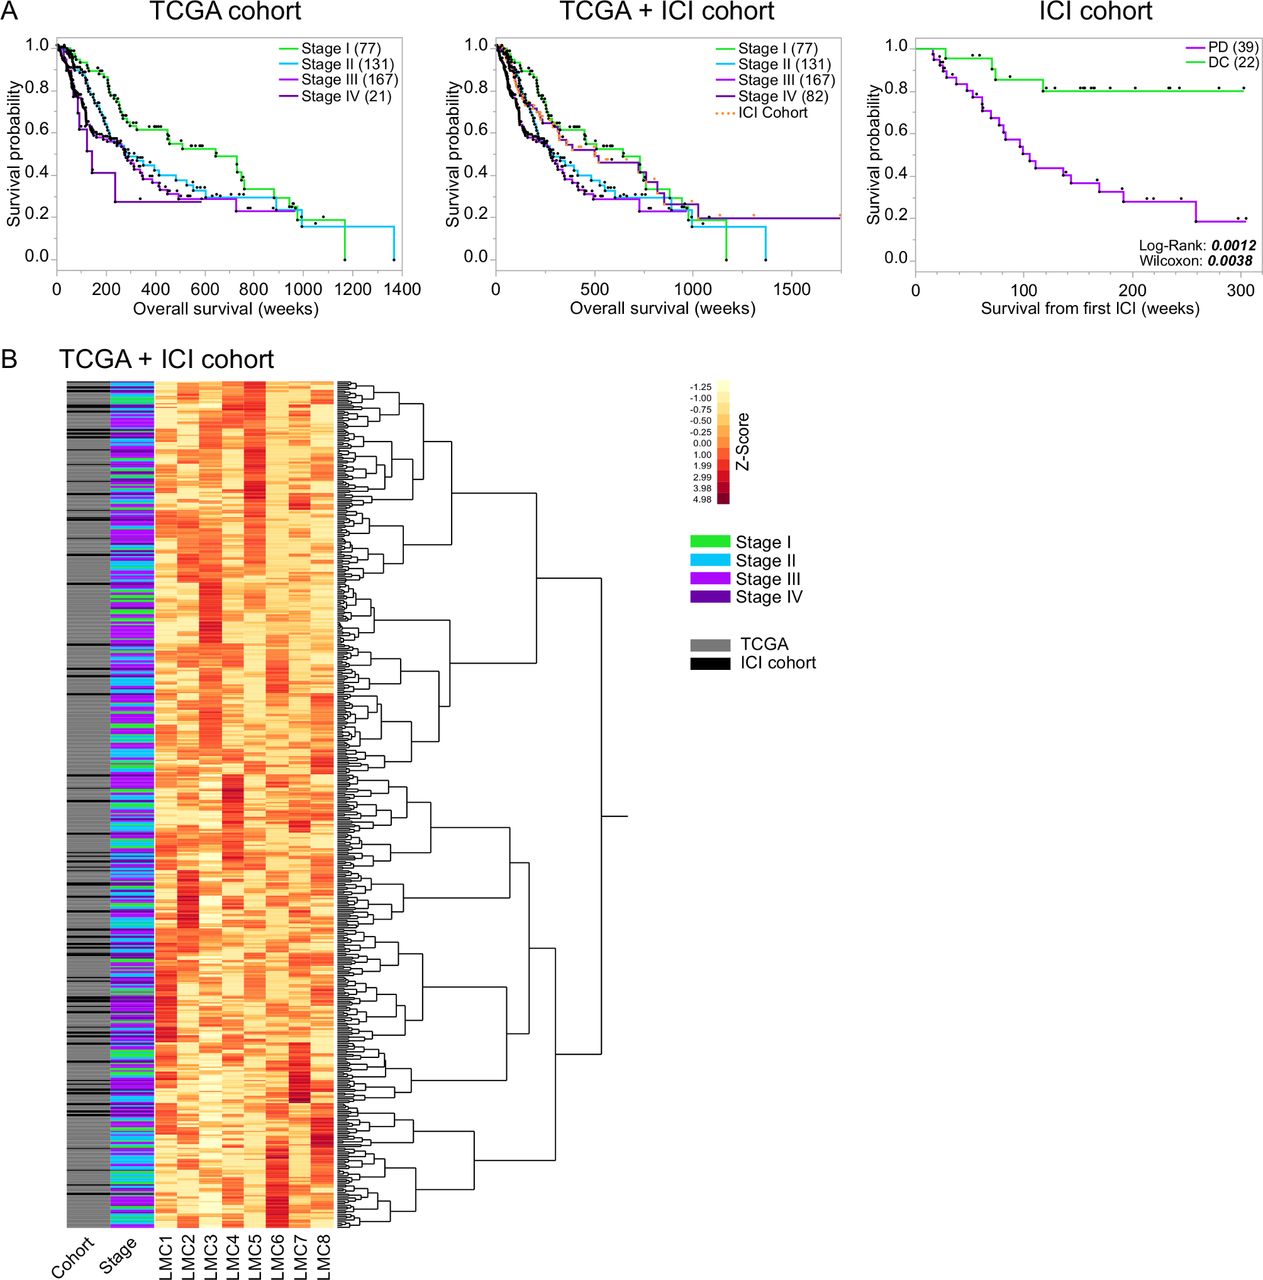
MeDeCom reference-free DNA methylome-based tumor deconvolution and standardized clustering of the total study population. (A) Kaplan-Meier survival curves indicating patient outcome characteristics of the different cohorts of the study: TCGA cohort (396 stages I–IV melanoma patients), total cohort (TCGA cohort plus ICI cohort including 65 patients with stage IV melanoma under ICI treatment (highlighted as orange dots)) and the ICI cohort discriminated by patients with progressive disease (PD) and disease control (DC) under ICI therapy, defined according to the neuroradiological iRECIST criteria. Survival times (weeks) were compared by log-rank and Wilcoxon test (p-values depicted). (B) By use of the reference-free tumor deconvolution algorithm MeDeCom, eight LMCs were identified in the total patient cohort (TCGA+ICI cohort). Heatmap showing the standardized proportions of the LMCs in all patient samples of the total cohort (rows, n=461, cohort and melanoma stage depicted). Number of patients in parentheses. ICI, immune checkpoint inhibitor; LMC, latent methylation components; TCGA, The Cancer Genome Atlas.
Global DNA methylation analysis does not decipher distinct signatures for melanoma subgroups
In a first approach, we assessed global DNA methylation patterns including all eligible CpG sites that might differ between subgroups of the well-characterized cohort of stage IV melanoma patients treated with ICI. Using PCA neither BRAF/NRAS mutational status, brain metastases status, nor radiological response status showed a clear association to the principal components (online supplemental figure 1A). Accordingly, differential methylation analysis did not reveal major differentially methylated CpGs (online supplemental figure 1B). This emphasizes that there is no global DNA methylation state associated with any of the available clinicopathological sample annotations.
Supplemental material
Supplemental material
Reference-free MeDeCom analysis of the total study population and reference-based deconvolution algorithms of TCGA DNA methylation data
Since the initial global DNA methylation analyses (PCA and differential methylation) of the stage IV melanoma cohort did not reveal an association with ICI therapy, we aimed for a more refined yet profound and reference-free algorithm to assess potential prognostic and predictive methylation signatures. Therefore, we first applied the MeDeCom algorithm to the bulk tumor DNA methylation data of the combined TCGA and ICI cohort (parameter selection is depicted in online supplemental figures 2). Overall, the cross-validation error pointed to selecting eight components (parameter k) and the regularization parameter λ as 0.001. The proportions of the eight LMCs (LMC1-8) across the samples are visualized in figure 2B. Hierarchical cluster analysis of LMC proportion Z-scores of the entire cohort (TCGA+ICI) did not reveal clear clustering according to the cohort (TCGA vs ICI) and clusters did not show a clear association with AJCC tumor stages (figure 2B). In a next step, we analyzed the prognostic impact of LMC proportion-based clustering on OS of the TCGA cohort. Cluster analysis revealed two main clusters (1 vs 2, figure 3A). Although, patients of cluster 1 showed a trend toward a better OS in the total TCGA cohort as well as in AJCC stages II and IV, log-rank and Wilcoxon’s test did not indicate statistical significance (figure 3B). MeDeCom is a reference-free deconvolution algorithm of DNA methylation data, which generates LMCs and their proportions and follows dominant cell types. As we were interested in distinct cellular composition of LMC proportion-based clusters and as MeDeCom does not compare data to cell-type specific reference methylation profiles, we further investigated LMC proportion-based clusters 1 and 2 using the reference-based algorithms LUMP and MethylCIBERSORT.
Supplemental material

MeDeCom reference-free DNA methylome-based tumor deconvolution and standardized LMC-based clustering of the TCGA melanoma cohort. (A) Heatmap of the patient samples of the TCGA cohort (rows, n=396, melanoma stage depicted) showing the proportions of the eight LMCs that were previously identified by MeDeCom analysis of the total patient cohort (TCGA+ICI cohort) and then standardized in the TCGA cohort before clustering. Hierarchical clustering of standardized LMC values revealed two distinct clusters (1=blue, 2=black). (B) Kaplan-Meier survival curves regarding patient allocation to LMC-based cluster 1 vs 2 in the total TCGA cohort including all stages and in stages I–IV, respectively. Overall survival (weeks) was compared by log-rank and Wilcoxon test (p-values depicted). (C) Forest plot of TCGA cohort univariate proportional hazard analyses for the variables age at diagnosis, sex, melanoma stage and the LMC-based cluster 1 vs 2. (D) Tumor deconvolution of the TCGA melanoma cohort was performed by the reference-based MethylCIBERSORT algorithm. The proportions of the respective cell fractions in melanoma samples of patients belonging to LMC-based cluster 1 (blue) were compared with patients belonging to LMC-based cluster 2 (black) by non-parametric Wilcoxon’s test (significant p-values depicted). Number of patients in parentheses. ICI, immune checkpoint inhibitor; LMC, latent methylation components; TCGA, The Cancer Genome Atlas.
Interestingly, the cancer cell fraction was significantly lower in the rather beneficial cluster 1, whereas immune and stromal cells were strongly increased in cluster 1 (figure 3D and online supplemental figure 3A,B). Taking a closer look at immune cell subtypes, especially CD8-positive T cells, B-cells, NK cells but also myeloid CD14-positive cells were enriched in cluster 1. On the contrary, CD4-positive T cells were significantly reduced in cluster 1. In summary, this indicates that LMC proportion-based clusters might be of prognostic relevance in certain subgroups of melanomas in a heterogenous melanoma cohort. However, a precise interpretation of LMCs with regard to immune biological processes remains elusive.
Supplemental material
Reference-free MeDeCom analysis of DNA methylation data exhibits predictive clusters in immune checkpoint inhibitor treated metastatic melanoma
In search of predictive signatures of large-scale DNA methylation data, we further investigated cutaneous metastases of stage IV melanoma patients receiving immune checkpoint inhibition in three dermato-oncology centers in Germany. Based on our initial MeDeCom analysis which decomposes DNA methylation data of the total cohort into eight LMCs, we performed LMC proportion-based unsupervised hierarchical cluster analysis in the ICI cohort only (figure 4A). Hierarchical cluster analysis depicted two major clusters with an enrichment of patients with DC in cluster 2 (figure 4A,B). In line with this, survival calculated from the initiation of ICI treatment was significantly longer in cluster 2 patients (figure 4C) and cluster 2 was predictive for survival from initiation of ICI treatment in univariate analysis (figure 4D). The median duration of ICI treatment as an indirect marker for DC and treatment tolerability accounted for 183 days in the beneficial cluster 2 as compared with 90 days in cluster 1 (Wilcoxon’s non-parametric test p=0.03).

MeDeCom reference-free DNA methylome-based tumor deconvolution and standardized LMC-based clustering of stage IV melanoma patients under ICI therapy reveals predictive signatures. (A) Heatmap of the patient samples of the ICI cohort (rows, n=65, ICI response defined by iRECIST depicted) showing the proportions of the eight LMCs that were previously identified by MeDeCom analysis of the total patient cohort (TCGA+ICI cohort) and then standardized in the ICI cohort before clustering. Hierarchical clustering of standardized LMC values revealed two distinct clusters (1=black, 2=green). (B) Proportion of patients with progressive disease (PD, purple) and disease control (DC, green) defined by iRECIST in cluster 1 and cluster 2, respectively. Patients lost to iRECIST follow-up (n=4, NA=not available) were not included into further outcome analyses. (C) Kaplan-Meier survival curves separating patients allocated to LMC-based cluster 1 vs 2 of the ICI cohort. Survival from the start of ICI therapy (weeks) was compared by log-rank and Wilcoxon test (p-values depicted). (D) Forest plot of ICI cohort univariate proportional hazard analyses for the variables age at diagnosis, sex, BRAF and NRAS mutation status, brain metastasis status and the LMC-based cluster 1 vs 2 (significant p-values depicted). (E) Tumor deconvolution of the ICI cohort was performed by the reference-based MethylCIBERSORT algorithm. The proportions of the respective cell fractions in melanoma samples of patients belonging to the favorable LMC-based cluster 2 (green) were compared with patients belonging to LMC-based cluster 1 (black) by non-parametric Wilcoxon’s test (significant p-values depicted). (F) Classifier development with (G) receiver operating characteristic curve of the prediction model. Number of patients in parentheses. AUC, area under the curve; ICI, immune checkpoint inhibitor; LMC, latent methylation components; TCGA, The Cancer Genome Atlas.
Additional MethylCIBERSORT facilitated a microenvironmental analysis of the tumor samples allocating to the predictive LMC-based clusters in the ICI cohort. While the cancer cell fraction, as well as most immune cell subsets did not show significant differences between the beneficial cluster 2 and cluster 1, only regulatory T cells (Tregs), CD56-positive (NK) cells and fibroblasts were depleted in cluster 2 (figure 4E and online supplemental figure 3). Timing of biopsy (before vs under ongoing ICI treatment) did not have a substantial impact on the cellular composition of tumor bulks with solely the fraction of CD56-positive NK cells being enriched after initiation of ICI treatment (online supplemental figure 4). In summary, MeDeCom analysis unraveled predictive signatures for DC in metastatic melanoma being treated with ICI.
Supplemental material
LMC-based classifier allows for patient stratification into predictive clusters
Finally, the findings of reference-free methylome analyses in the ICI cohort were integrated to develop a patient classifier with the aim to allocate patients to the predictive LMC proportion-based cluster. Therefore, we used the 5000 CpGs computed by MeDeCom as an input for a logistic regression analysis. Lasso regularization revealed 20 of these 5000 CpG sites to predict sample allocation to the less favorable cluster 1 or the favorable cluster 2 of the ICI cohort (figure 4F). By means of this classifier model, we achieved a cross-validated accuracy of 89.5% as well as an area under the curve of the receiver operating characteristic curve of 0.9664 in our cohort of melanoma stage IV patients under ICI treatment (figure 4G).
Discussion
Malignant melanoma ranges among the top cancer diseases and its incidence is rising gradually.1–3 Immunomodulatory treatment approaches aiming to reinvigorate an exhausted lymphocytic immune response against tumor cells mainly by targeting immune checkpoints led to a substantial prognostic improvement in advanced melanoma.34 35 Due to a limited response to ICI therapy along with potentially severe irAEs, the identification of predictive biomarkers to improve patient selection for ICI treatment is crucial. Some microenvironmental and genomic predictors for ICI treatment response were identified over the past few years.20 These predictors include the expression of tumor antigens and neoantigens, the mutational burden, alterations in antigen presentation, DNA mismatch-repair and Interferon-γ signaling, among others.20 Still, harmonization of applied assays, such as PD-L1 testing is pending.36 Predictive biomarkers cannot be reduced to single parts of the dynamic immune cascade and require the invention of more precise tools that are readily applicable in clinical routine. In this context, the analysis of epigenomic signatures especially DNA methylation-based approaches appear to be a promising candidate.24 25
In the present study, we introduced a novel approach for the analysis of DNA methylation data from melanoma bulk samples by refining (i) global, (ii) reference-free and (iii) reference-based algorithms. This strategy turned out as a valid tool to decipher prognostic methylation signatures in melanoma patients and ultimately allowed the development of a classifier for ICI response in stage IV melanoma patients.
Global analyses of DNA methylation data failed to discriminate reliable prognostic or predictive signatures. This argued for a refinement of computational algorithms. By use of the reference-free tumor deconvolution algorithm MeDeCom,27 we were able to avoid the limitations imposed through a reference data set24 and gained a comprehensive view on the epigenetic tumor profiles. This approach is in contrast with previous studies that are mostly limited to reference-based tumor deconvolution algorithms which narrow down the amount of data entering the computation of prognostic methylation signatures.25 Based on clustering of LMC-proportion Z-scores, MeDeCom revealed signatures in stages I–IV melanoma patients of the TCGA cohort which were characterized by a distinct cellular composition but only showed a trend toward a prognostic relevance. The microenvironmental compositions of the samples were investigated by LUMP and MethylCIBERSORT representing reference-based deconvolution algorithms.21 32 Chakravarthy et al were among the first to deconvolute tumors by means of DNA methylomes.32 Estimation of tumor purity and cellular microenvironmental composition allowed for allocation to immune hot and cold tumors.32 The association of the LMC-based clusters of the TCGA cohort with a particular microenvironmental composition might be relevant in earlier stage melanoma patients. However, the interpretation of outcome parameters in the TCGA cohort is limited due to the sampling heterogeneity including tissue from different organs, patients in different clinical stages (with only few stage IV patients) and only limited clinical annotations. Therefore, this aspect should be investigated in larger data sets of clinically harmonized melanoma cohorts. To investigate the predictive value of methylation signatures, we compiled a comparatively large cohort of stage IV melanoma patients that received ICI treatment. We were able to identify a predictive value of LMC proportion-based clusters correlating with survival under ICI treatment.
To understand potential biological mechanisms behind the predictive LMC proportion-based clusters, we amended reference-based deconvolution of the DNA methylation data.
In the ICI cohort, we did not find a distinct cell signature which was associated with the prognostic clusters and long-term DC. Recent studies reported the presence of B cells and so-called tertiary lymphoid structures to be associated with improved survival and a response to ICI therapy in melanoma.37 38 In contrast, Mitra et al investigated DNA methylation clusters based on median methylation values of selected immune cell-specific genes in melanoma patients but failed bringing forth an ICI response prediction signature.25
The superior goal of a successful anticancer therapy is a long-term clinical benefit. Immunotherapy can lead to remarkable responses which can be objectified by imaging techniques. Unfortunately, even after showing an initial clinical or radiological response (assessed e.g. by the iRECIST), a considerable number of patients develop disease progression. Interestingly, our data show that LMC proportion-based clustering in ICI-treated melanoma can predict a durable long-term effect on ICI therapy reflected by a prolongation of survival after ICI treatment was initiated. Therefore, we aimed at integrating the findings to develop a pilot patient classifier that allowed to allocate melanoma patients under ICI treatment to the predictive LMC proportion-based clusters. This is a first step toward the development of a tool readily applicable in a clinical setup. At this early stage, it should be noted that our classifier has to be considered as a pilot tool established in a small patient cohort that yet has to be validated in larger, prospective settings to control for both clinical and radiological response parameters.
Taken together, our data demonstrate the benefit of reference-free deconvolution of DNA methylation data for cancer stratification. The obtained prognostic LMC proportion-based clusters have a very good predictive value for ICI treatment response in metastatic melanoma. The combined deconvolution approaches of bulk tumor DNA methylation data show a new way to develop a classifier to predict response to ICI treatment in melanoma. Further studies will be needed to validate this in larger cohorts of cancer patients treated with immunotherapy.
Data availability statement
Data are available in a public, open access repository. All data relevant to the study are included in the article or uploaded as supplementary information. All data analyzed and/or generated within this study are included in the article and the supplementary data files. Raw data IDAT files as well as processed data of the ICI cohort are accessible via Gene Expression Omnibus (GEO, https://www.ncbi.nlm.nih.gov/geo/ ; GSE175699). Any other relevant data are available upon reasonable request.
Ethics statements
Ethics approval
The retrospective study was approved by the local ethical committee (SNO-5-2019).
Acknowledgments
We thank C Siedel, H Kneitz, M Dunst and T Starzetz for technical support. The results shown here are in part based on data generated by the TCGA Research Network: https://www.cancer.gov//tcga.
References
Supplementary materials
Supplementary Data
This web only file has been produced by the BMJ Publishing Group from an electronic file supplied by the author(s) and has not been edited for content.
Footnotes
Contributors Conception and design of the work: KF, KNZ, PSZ, PNH. Acquisition, analysis and interpretation of data: KF, MS, KNZ, AB, JK, PJ, TIH, MM, KHP, TRF, JW, ST, BS, PSZ, PNH. Drafting of the manuscript: KF, MS, KNZ, PSZ, PNH. Critical revision for important intellectual content: KF, MS, KNZ, AB, JK, PJ, TIH, MM, KHP, TRF, JW, ST, BS, PSZ, PNH. Provided material and clinical data: KNZ, AB, JK, PJ, MM, KHP, BS. All authors approved the final version of the manuscript and agreed to all aspects of the work in ensuring that questions related to the accuracy or integrity of any part of the work are appropriately investigated and resolved.
Funding KF has received intramural funding by the Frankfurt Research Funding (FFF) program "Nachwuchswissenschaftler" and the "Clinician Scientist Program" by the Mildred-Scheel Foundation. MS is supported by the BMBF project de.NBI-epi (031L0101D) and the EU H2020 project SYSCID (733100). PSZ has received intramural funding by the FFF program "Nachwuchswissenschaftler" and "Patenschaftsprogramm" as well as within the "Clinician Scientist Program" by the Mildred-Scheel Foundation. The Dr Senckenberg Institute of Neurooncology is supported by the Dr Senckenberg Foundation. For this study, PNH obtained grants from “FCI/LOEWE: Discovery and Development Program”.
Competing interests None declared.
Provenance and peer review Not commissioned; externally peer reviewed.
Supplemental material This content has been supplied by the author(s). It has not been vetted by BMJ Publishing Group Limited (BMJ) and may not have been peer-reviewed. Any opinions or recommendations discussed are solely those of the author(s) and are not endorsed by BMJ. BMJ disclaims all liability and responsibility arising from any reliance placed on the content. Where the content includes any translated material, BMJ does not warrant the accuracy and reliability of the translations (including but not limited to local regulations, clinical guidelines, terminology, drug names and drug dosages), and is not responsible for any error and/or omissions arising from translation and adaptation or otherwise.