Article Text

Abstract
Background Multiple synergistic combination approaches with cancer drugs are developed to overcome primary resistance to immunotherapy; however, the mechanistic rationale to combine chemoradiotherapy (CRT) with immune checkpoint inhibitors remains elusive.
Methods This study described the immunological landscape of tumor microenvironment (TME) exposed to CRT. Tumor samples from patients with rectal cancer (n=43) treated with neoadjuvant CRT or radiotherapy were analyzed by nanostring and immunohistochemistry. Studies in mice were performed using three syngeneic tumors (TC1, CT26 and MC38). Tumor-bearing mice were treated either with platinum-based CRT, radiotherapy or chemotherapy. Anti-CTLA-4 and/or anti-Programmed Cell Death Receptor-1 (PD-1) therapy was used in combination with CRT. The therapy-exposed TME was screened by RNA sequencing and flow cytometry and tumor-infiltrating T lymphocyte functionality was evaluated by interferon (IFN)-γ ELIspot and intracellular cytokine staining.
Results Front-to-front comparison analysis revealed the synergistic effect of CRT to establish a highly inflamed and Th1-polarized immune signature in the TME of patients and mice. In both settings, CRT-exposed TMEs were highly enriched in newly-infiltrated tumor-specific CD8+ T cells as well as tissue resident memory CD103+CD8+ T cells. In mice, CD8 T cells were involved in the antitumor response mediated by CRT and were primed by CRT-activated CD103+ dendritic cells. In the three tumor models, we showed that concurrent combination of CRT with a dual CTLA-4 and PD-1 blockade was required to achieve an optimal antitumor effect and to establish a broad and long-lasting protective antitumor T cell immunity.
Conclusions Our results highlight the ability of CRT to stimulate strong antitumor T-cell-mediated immunity and tissue resident memory T activation in TME, to foster immune checkpoint inhibitors action. These findings have implications in clinic for the design clinical trials combining chemoradiation with immunotherapy.
- tumor microenvironment
- drug therapy
- combination
- adaptive immunity
- immunotherapy
- radiotherapy
Data availability statement
Data are available upon reasonable request. RNAseq data from mouse tumor exposed to chemoradiotherapy is available in a public two years following the publication.
This is an open access article distributed in accordance with the Creative Commons Attribution Non Commercial (CC BY-NC 4.0) license, which permits others to distribute, remix, adapt, build upon this work non-commercially, and license their derivative works on different terms, provided the original work is properly cited, appropriate credit is given, any changes made indicated, and the use is non-commercial. See http://creativecommons.org/licenses/by-nc/4.0/.
Statistics from Altmetric.com
Background
As a result of broad bioactivity across a wide range of tumor types and the durability of tumor responses, immune checkpoint inhibitors (ICI) have deeply revolutionized the practice of medical oncology.1 2 Nevertheless, most patients still progress on these treatments, strengthening the importance of unraveling the underlying mechanisms of primary resistance to immunotherapy. A well-described marker of non-responsiveness to ICI is the absence or low abundance of lymphocytes in the tumor microenvironment (TME), the so-called cold non-inflamed tumors.3 Several other resistance mechanisms have been described, including alterations of interferon (IFN)-γ signaling, defects in antigen presentation pathways, accumulation of immunosuppressive cells as well as tumor angiogenesis.4–7 Hence, turning cold tumors into hot and inflamed ones is still a current challenge. One critical approach to circumvent the primary resistance to ICIs is based on their combination with cytotoxic drugs.8 9 Indeed, evidence support the immunological effects of conventional chemotherapies and radiotherapies, playing a key role in the priming of antitumor T-cells and in enhancing tumor cells sensitization to immune attacks.10–12 Indeed, multiple combinations of ICI with chemotherapy (CT) or radiotherapy (RT) are currently used or evaluated in clinic.13–16
In this context, concurrent chemoradiotherapy (CRT) also gained significant interest as potential strategy to convert a non-inflamed TME to an inflamed one. Although, previous studies suggest that CRT could create an appropriate immune environment for checkpoint blockade therapy action, results from clinical studies showed that this combination is still ineffective in most patients with cancer, illustrating the need to better understand the immunological effects driven by CRT.16–20
To address the ability of chemoradiation (CRT) to shape the immunological landscape of TME, we compared human and mouse TME exposed either to concurrent CRT, to CT or to RT.
Transcriptomic analysis in patients with colorectal cancer revealed that neoadjuvant CRT promotes a high inflamed and Th1-polarized TME as well as upregulation of PD-L1 expression as compared with neoadjuvant RT. The magnitude of CRT-induced local immune activation positively correlates with the histological response. In mouse, we performed a head-to-head comparison of transcriptomic and immunological changes of TME exposed either to CRT or CT or RT and found that CRT effectively elicits a stronger proinflammatory and T cell mediated immune signature than each monotherapy. Finally, we demonstrated that CRT combined with a dual CTLA-4 and PD-1 blockade was more effective than a single PD-1/PD-L1 blockade to sustain the CRT-induced protective antitumor T cell immunity. These results provide a new insight on immunological effects of CRT and strengthen the rationale to its use to convert a cold TME into hot one and to alleviate primary resistance mechanisms.
Methods
Patients
The colorectal cancer tissues obtained from surgical specimens were retrospectively collected from 55 patients diagnosed between 2000 and 2014. Patients were treated by neoadjuvant treatment (RT with 5-fluorouracil-based CT (nCRT; n=30) or without CT (nRT; n=13)) and radical surgery by total mesorectal excision. Among the patients that received nRT, 7 had long course (LC) and 6 had short course (SC) RT. All patients with nCRT received LC RT (TME). LC, that is, around 45 Gy in 25 fractions with delayed surgery and the nRT ‘short course’ that is, 25 Gy in 5 fractions with early surgery. Target volumes of RT were treated according to the International consensus guidelines on Clinical Target Volume delineation in rectal cancer.21 Response to neoadjuvant treatment was assessed by the Dworak tumor regression grading score22 from no regression/no response (Dworak 0) to a near tumor control/a near complete response (Dworak 3): Dworak 0 (n=8); Dworak 1 (n=14); Dworak 2 (n=13); Dworak 3 (n=8).
Mouse tumor models
C57BL/6AnCrl and BALB/cAnCrl female mice were injected subcutaneously with 2.105 TC1, CT26, MC38, B16F10, or B16OVA cells in 100 µL of phosphate buffered saline (PBS 1×, Gibco, France) into the left flank. Tumor growth was monitored every 3 days with a caliper and groups were formed when tumor reached a mean diameter of 50–60 mm2. All CT procedures were conducted in the Pharmacy Department of the University Hospital of Besançon (France). Mice were administered a single dose of intraperitoneal cisplatin (5 mg/kg) and 5-fluorouracil (25 mg/kg). After 2 days, mice were anesthetized by injection of ketamine (100 mg/kg) and xylazine (10 mg/kg) and received single-fraction beam photon irradiation (8 Gy) using Clinac 2100 CD (Varian Medical System) with a maximal energy of 6 MV and in 2D with one beam. Mice from control group were injected with the solvent used to dilute the drug (the Pharmacy Department of the University Hospital of Besançon, France). Anti-mouse CTLA-4 antibody (9H10, Euromedex) and anti-PD-1 (RMP1-14, Euromedex) injections (200 µg/mouse two times a week for 2 weeks) started 2 days prior to CT and 3 days after RT, respectively. All experimental studies were approved by the local ethics committee in accordance with the European Union’s Directive 2010/63.
Statistical analysis and data visualization
A unilateral linear-by-linear association test was applied to assess associations between PD-L1 score and patient treatment. The associations between clinicopathological parameters and cells densities or gene expression level were examined using T-test or Wilcoxon-Mann-Whitney as appropriate. Partitioning around medoids algorithm was used to cluster gene expression matrix. A logistic regression model was applied to test association between ICI PD-L1, PD1, LAG3 and CTLA4, related genes and TME inflammatory status (Hot/Cold). Correlation matrices were constructed by calculation of Pearson correlation coefficients for all marker combinations. Data visualizations and statistical analyses were achieved in R version 3.6.3 with ggpubr, ggplot2, coin, ComplexHeatmap and cluster packages. For preclinical models, the statistical analyses were performed with the Graphpad Prism 6 software (La Jolla, California, USA). Multiple groups comparison was performed using the one-way or two ways analysis of variance or Kruskal-Wallis tests and two groups comparisons were done with the Mann-Whitney test. P values lower than 0.05 were considered as statistically significant (*p<0.05, **p<0.01, ***p<0.001). Mice survival was estimated using the Kaplan-Meier method and the log-rank test. The event in the mice survival test was either when the size of the tumor reached 300 mm2 or the death of the mouse. The log-rank test was corrected for multiples comparison using the Bonferroni method. P values lower than 0.01 were considered as significant.
More detailed information is available in the online supplemental material section.
Supplemental material
Results
Neoadjuvant CRT is more effective than RT to trigger inflamed TME in colorectal cancer
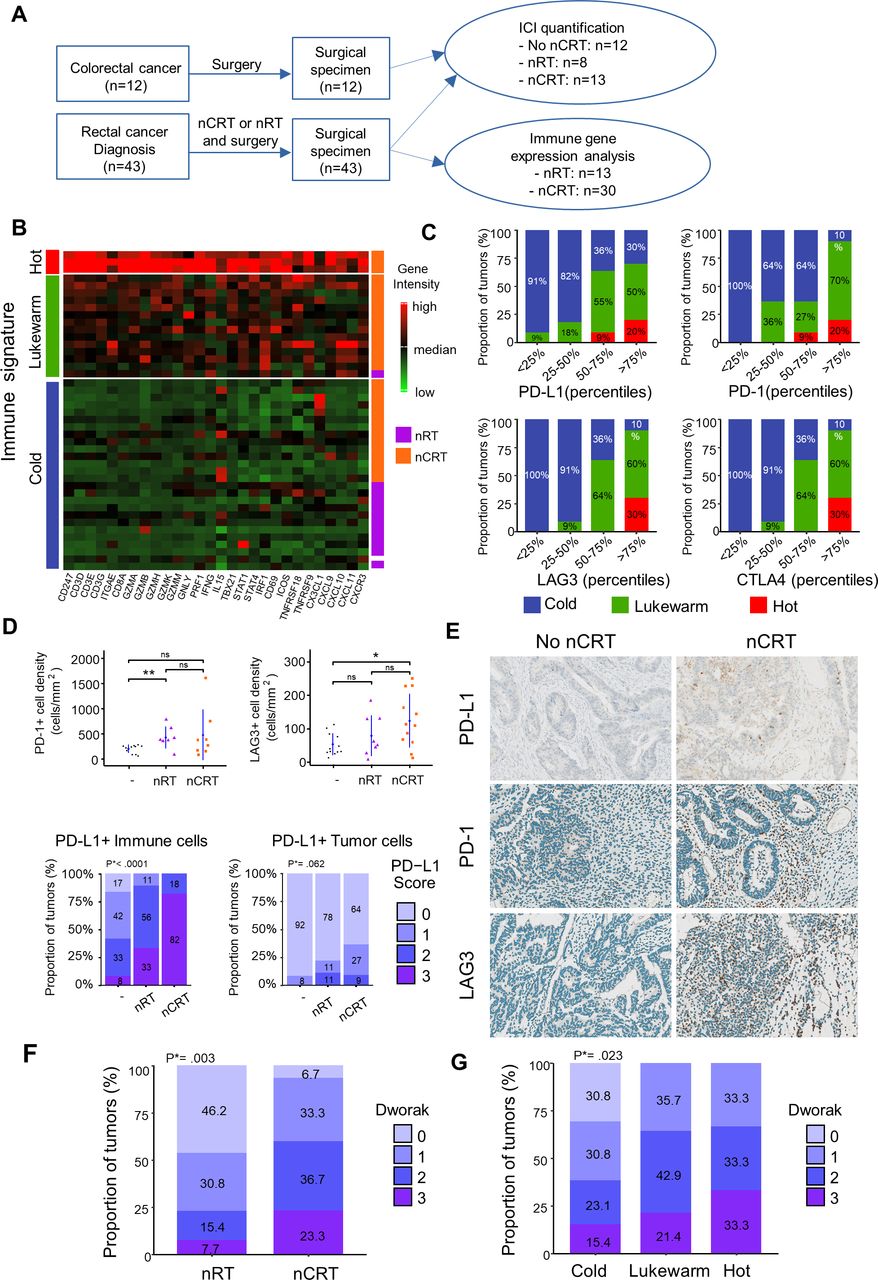
To study the changes of adaptive T cell immunity in TME induced by CRT, we performed Nanostring-based transcriptomic analysis of tumor samples from patients with colorectal cancer (n=43) treated either by neoadjuvant radiation (nRT) or chemoradiation (nCRT) (figure 1A). The distribution of clinical parameters (age, gender, cancer location clinical (cTNM) and pathological (pTNM) tumor classifications) was well-balanced among treatment groups (online supplemental table 1). The expression level of T-cell-related genes was highly variable. Overall, 7% (n=3) exhibited a “hot signature” with high expression of genes related to Th1 immune orientation (eg, Tbx21, Stat1, Stat4, Irf1, Ifng,), cytotoxicity (Gzma/b/h/k/m, Gnly, Prf1), T-cell activation (eg, Icos, Tnfrsf9), migration (eg, Cx3cl1, Cxcl9, Cxcl10), while 33% (n=14) and 60% (n=26) exhibited the “lukewarm” and “cold” signatures, respectively, with low expression of such genes (figure 1B). All patients except one with the lukewarm/hot signature belonged to the nCRT group. In contrast, most patients treated with nRT presented non-inflamed immune signature in the TME related to a cold tumor. Notably, we found positive correlations (all p<0.01) between the immune signatures (cold, lukewarm, and hot) and the expression level of immune checkpoints such as CTLA-4, PD-L1, PD-1 and LAG3, suggesting the ability of nCRT to induce a higher inflamed TME than nRT alone (figure 1C). Accordingly, immunohistochemistry analysis showed a higher density of PD-1/PD-L1 or LAG-3 positive cells in the TME of nCRT group compared with patients who did not receive neoadjuvant treatment (figure 1D,E).

Tumor-associated immune signatures of human rectal cancer treated by neoadjuvant chemoradiation (nCRT) versus neoadjuvant radiation (nRT). (A) Flow chart of experimental design. (B) T cells related gene expression heatmap clusterised by partitioning around medoids algorithm in patients with rectal cancer treated by nRT or nCRT. Low and high expression of genes is represented with a color gradient from red to green. (C) Percentage of hot (red), lukewarm (green) and cold (blue) tumors in ICI gene intensities categorized in quartiles. (D) Mean±SEM of PD1+ and LAG3+ cell densities in patients not treated, treated with neoadjuvant RT or CRT treatment (Upper part). Proportion of PD-L1 score level quantified in immune or tumor cells in patients not treated, with neoadjuvant RT or CRT treatment. Φ PD-L1 score in immune cells: 0:<1%, 1: 1%–5%, 2: 5%–10%, 3:>10%. PD-L1 score in tumors cells: 0:<1%, 1: 1%–5%, 2: 5%–50%, 3:>50 (lower part). (E) Examples of immunostained for PD-L1, PD1 and LAG3 rectal tumors treated or not by nCRT. (F) Boxplots of histopathological responses to nCRT (Dworak 0 to 3) in patients treated with nRT or nCRT. (G) Boxplots of histopathological responses to nCRT in cold, lukewarm, and hot tumors. Wilcoxon test p values *<0.05 and **p<0.01. ICI, immune check point inhibitors. P*=Unilateral linear-by-linear association test.
Next, we focused on PD-L1 expression (on immune cells or tumor cells). We found that most colorectal tumors treated by nCRT (82%) exhibited high expression of PD-L1 on immune cells (score 3) whereas only 33% of tumor treated by nRT highly expressed PD-L1 (p<0.0001). Similar trends were observed when considering PD-L1 expression on tumor cells (figure 1D,E). These results support the ability of CRT to create a strong adaptive immune resistance phenomenon in TME.
Next, we addressed the relationship between the immune response induced by CRT and the efficacy of the treatment evaluated by histological response. To this end, we used the tumor regression grading of rectal cancer after neoadjuvant treatment (Dworak).22 Best histological responses (Dworak 2 and 3) were statistically greater (p=0.003) in the nCRT group than in patients treated with nRT alone (figure 1F). Notably, high inflamed TME was significantly associated with a high rate (>60%) of Dworak 2 and 3 scores, compared with the cold TME (38%; p=0.02; figure 1G), suggesting that the strong local immune activation induced by CRT may contribute to its effectiveness. Collectively, CRT appears more effective to induce a proinflammatory TME suitable for ICI action.
CRT induces high proinflammatory and T cell-mediated immune signatures in the mouse TME
To study more extensively the immunological changes of TME induced by CRT, we performed a comprehensive translational study in mouse tumor models exposed or not to CRT. These tumor models consist of the lung epithelial carcinoma HPV positive TC1 and CT26 tumors in C57BL/6 and BALB/c mice, respectively. Tumor-bearing mice were separated into four groups: vehicle untreated (CTRL), CT, (5-fluorouracil plus cisplatin), RT (8 Gy focal radiation) and CRT group that consists to a single dose of 5-fluorouracil plus cisplatin, two radiosensitive cytotoxic drugs combined with a single fraction of 8 Gy radiation. To reflect locally-advanced cancer stages, treatments were initiated when the tumor mass reached 50–60 mm2 (figure 2A). As expected, a single CRT treatment was more effective than RT or CT alone to delay tumor growth (p<0.05) but failed to achieve complete remission of tumors in the majority of mice (online supplemental figure S1).

Comparison of transcriptomic immune signatures of mouse tumor microenvironment exposed to chemoradiation (CRT) or radiotherapy (RT) or chemotherapy (CT). (A) C57BL/6NCrl, and BALB/cAnCrl mice were injected subcutaneously with 2.105 TC1-HPV16+ and CT26 colon tumor cells, respectively. Mice were treated with CT, RT, or CRT when the tumors reached 50–60 mm² (n=10 mice/treatment group, 3 experiments). (B) Number of differentially expressed genes (DEGs) regulated in tumor-infiltrating lymphocytes (TILs) from each treatment group. TILs were harvested 7 days after CRT. The different treatments regulated a total of 2466 DEGs (a log2-fold change (FC) in expression with treated mice versus control (CTRL)≥3 or ≤−3); 1344 (55%), 552 (22%), and 536 (22%) were regulated following CRT, RT or CT, and ≥2 treatments, respectively. (C) Heatmap showing log10 normalized Fragments Per Kilobase of transcript per Million mapped reads (FPKM) of DEGs related to T-cell expressed in TILs from CTRL, RT, CT and CRT-treated TC1-bearing mice (n=6 mice/treatment group). Gene set enrichment analysis was performed using the PanglaoDB gene specific genes sets. Twenty-seven gene sets with more than 10 genes in a cluster and presenting a corrected p-value below 0.01 were selected. (D) Heatmap depicts log2 normalized FPKM of DEGs related to T cells-related exhaustion, activation, migration and cytotoxicity signature expressed in TILs from CTRL, RT, CT and RTCT mice (pool of 6 mice/group). (E) The absolute abundance of immune cell populations quantified by Microenvironment Cell Populations counter R package in TC1 tumor-bearing mice ((CTRL (untreated mice), CRT, RT, CT); a pool of TILs from at least 6 mice/condition).
First, we performed RNA sequencing of tumor-infiltrating immune cells isolated from tumor-bearing mice 7 days after the respective treatments (figure 2A). In TC1 model, CRT selectively regulated 1344 differentially expressed genes (DEGs; n=571 (42.5%), induced; n=773 (57.5%), repressed) versus <330 DEGs (13%) regulated by CT or RT; with only 536 (22%) similarly regulated in ≥2 therapies (figure 2B). Notably, CRT-induced DEGs were highly enriched in inflammatory responses (eg, Il1b, Cxcr3, Tnfsf4), host defense (eg, Zbp1, Clec4a4), T cell-mediated immunity (eg, CD8α, Ifng, Prf1, Il12rb,) Th1 polarization (eg, Tbx21, Cxcr3, Eomes) and neutrophil/myeloid cells activation (online supplemental figure S2). CRT-repressed DEGs mainly included extracellular matrix organization (Mmp3, Col16a1), or vascular development (Angptl1, Angptl2), which can be involved in tumor infiltration and invasiveness. All treatments repressed G alpha signaling and positively regulated genes involved in lipoprotein metabolism, which is known to be potentially affected by RT or CT.23
To determine the immune cell composition in TME, we used PanglaoDB database.24 The correlation matrix analysis between 1258 highly variables genes within according to GSEA revealed the existence of 27 cell subtypes belonging to myeloid and lymphoid lineages. These cells were mainly distributed in three clusters (clusters 5, 7 and 8). Cluster 5 is a group of genes mainly associated with B-cells and plasma cells. Cluster 7 is related to macrophages, monocytes and natural killer (NK)-specific genes and the cluster 8 was associated with different T cell subsets (online supplemental figure S2). Unsupervised clustering analysis showed that CRT triggered stronger expression of genes associated with T-cell activation (eg, Cd28, Lck, Zap70, Egr2), exhaustion (eg, Ctla4, Havcr2, Pdcd1, Lag3, Tigit), memory (eg, Cd44, Id2, Klrg, Prdm1), and function (eg, Ifng, Tnf, Prf1, Gzma/b, Fasl) than RT and CT (decrease in the range: CRT>RT> CT) (figure 2C,D). Similar results were observed with transcriptomic data from CT26 tumor model in BALB/c mice (not shown). To estimate the abundance of immune cells, we used Microenvironment Cell Populations-counter (MCP-counter) method based on a set of mouse/human orthologous genes.25 As shown in figure 2E, CRT-treated tumors had an enrichment of T-cells, NK cells and monocytes, but also myeloid-derived suppressor cells (MDSC) and neutrophil markers. In contrast, B cell markers were downregulated after CRT as compared with CT or RT, suggesting a shift towards a strong T cell-mediated immunity after CRT.
The antitumor effect of CRT requires early activation of effector T cells in the TME
To confirm transcriptomic data, the immune cell infiltrates isolated from tumor-bearing mice were analyzed ex vivo by flow cytometry after the respective treatments (figure 3A). Compared with non-CRT-exposed tumors, CRT improved the accumulation of CD4+ and CD8+ tumor-infiltrating lymphocytes (TILs) within the TME both in TC1 and CT26 tumors (figure 3B,C). To track tumor-reactive CD8+ TILs, we performed E749-57-Kb dextramer stainings in HPV-16 +TC1 model. We detected a 2–3-fold increase in the percentage of E7-specific CD8+TILs in CRT-treated mice compared with the CT and RT groups (30% vs 10%–15%) (figure 3D). Kinetic analysis showed that the E7-specific CD8+ TILs expansion reached its peak on day 7 after CRT and then returned to a basal level on days 15–21, corresponding to the contraction phase of a T-cell response (figure 3E). The high expansion of CD8+ TILs activated by CRT positively correlated with the increased expression of Cxcl9 and Cxcl10 and Cxcl16 transcripts, key chemokines ensuring effector T cells migration towards the tumor (figure 2D). Furthermore, we found that CD8+ TILs from CRT-treated mice produced higher level of effector cytokines such as, IFN-γ, TNF-α, and granzyme B (GzmB) as compared with each monotherapy (figure 3F). Similar observations were made in CT26 colorectal tumor model following CRT, suggesting the potent capacity of CRT to promote local activation of antitumor T cell immunity (online supplemental figure S3).
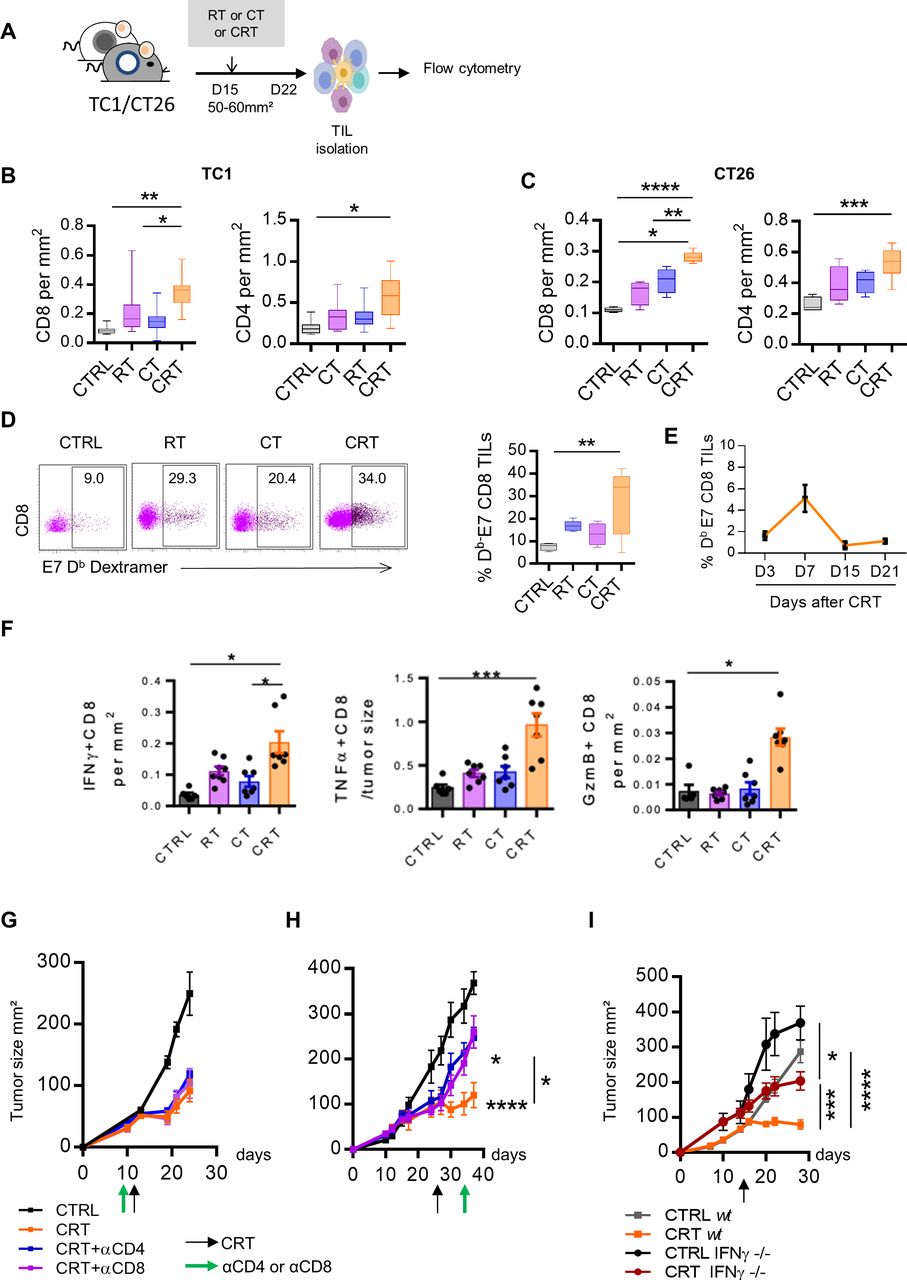
Antitumor effect of chemoradiotherapy (CRT) requires newly T cells infiltration in tumor microenvironment (TME) and active interferon (IFN)-ɣ pathway. (A) C57BL/6NCrl, and BALB/cAnCrl mice were injected subcutaneously with 2.105 TC1-HPV16+ and CT26 colon tumor cells, respectively. Mice were treated with chemotherapy (CT), radiotherapy (RT), or CRT when the tumors reached 50–60 mm² (n=10 mice/treatment group, 3 experiments). (B, C) Percentages of CD8+ or CD4+ TILs and tumor size ratio at day 7 post treatment in TC1 (B) and CT26 (C) tumor-bearing mice. (D) Representative dot plot graphs (left) and percentages of E749-57 specific CD8 +TILs (right) from the CTRL, RT, CT, or CRT-treated mice. (E) Kinetic of E749-57 specific CD8 TILs infiltration at days 3, 7, 15, and 21 post CRT. (F) Scatter plots showing percentage of IFN-ɣ and granzyme B (GzmB) production assessed by intracellular cytokine staining after 6 hours of stimulation with E749-57 peptide in TC1-bearing mice. (G) Tumor growth of TC1 mice receiving three injections of anti-CD4+ or CD8+ antibodies concurrently to CRT regimen. Data are representative of three experiments and expressed as means±SEM; n=6–7 mice/treatment group (H) Tumor growth of TC1 mice receiving three injections of anti-CD4+ or CD8+ antibodies 7 days post CRT. (I) IFN-ɣ-/-C57BL/6 or C57BL/6NCrl mice were injected subcutaneously with 2.105 TC1 tumor cells and were treated with CRT when tumors reached 50–60 mm². Tumor growth of treated mice is shown. Data are representative of three experiments and expressed as means±SEM; n=6–7 mice/treatment group. The one-way analysis of variance and Kruskal-Wallis tests were used; *p<0.05, **p<0.01, ***p<0.001, ****p<0.0001.
To determine whether the efficacy of CRT relies on effector T-cell, tumor-bearing mice were depleted in CD8 or CD4 T-cells before or after CRT. In contrast to T cell depletion prior treatment that did not impair CRT efficacy, we showed that the efficiency of CRT significantly decreased when T-cells were depleted from day 7, at the peak of T cell infiltration; this was also the case in CT26 model (figure 3G,H, and online supplemental figure S3). Furthermore, the efficacy of CRT was significantly impaired in IFN-γ knockout mice as compared with wild type mice (figure 4I).
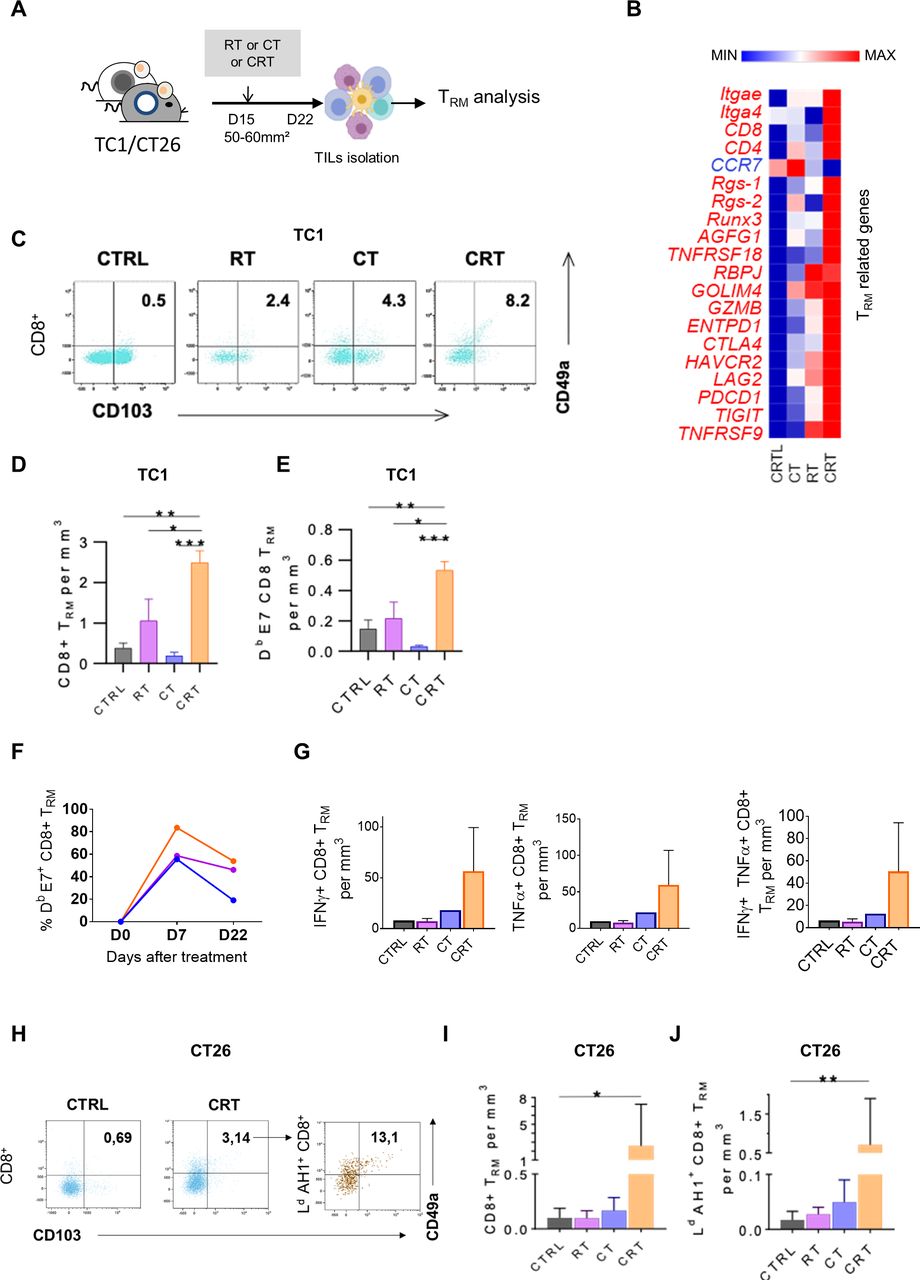
Concurrent chemoradiotherapy (CRT) promotes a synergistic expansion of intratumoral CD103+CD49a+TRM cells. (A) C57BL/6NCrl, and BALB/cAnCrl mice were injected subcutaneously with 2.105 TC1-HPV16+ and CT26 colon tumor cells, respectively. Mice were treated with chemotherapy (CT), radiotherapy (RT), or CRT when the tumors reached 50–60 mm² (n=10 mice/treatment group, 3 experiments). (B) Heatmap depicts log2 normalized Fragments Per Kilobase of transcripts per Million mapped reads (FPKM) of differentially expressed genes (DEGs) related to TRM signature expressed in tumor-infiltrating lymphocytes (TILs) from CTRL, RT, CT and RTCT mice (pool of 6 mice/group). (C) Representative dot plots of TRM markers expression in CD8+ 7 days post therapy in TC1 tumor-bearing mice. (D, E) Histograms show CD8 +TRM/Tumor size ratio (D) and E7-specific-CD8+TRM/Tumor size ratio (E) 7 days post therapy in TC1-bearing mice. (F) Kinetics of the percentage of TRM in the CD8 population after treatment. (n=3 pooled mice). (G) Estimated functional infiltrate after 1 day of stimulation with E749-57 peptides. Histograms show the percentages of IFNγ+ (left), TNFα+ (middle) and GZMB+ (right) CD8 TRM infiltrating the tumor. (H) Representative flow cytometry dot plots of TRM markers expression on total CD8 T cells (left) and AH16-14 specific CD8 T cells 7 days post therapy in CT26 tumor-bearing mice treated or not by CRT. (I) Histograms show CD8 +TRM/Tumor size ratio and AH16-14 specific TRM /Tumor size ratio (J). Data are representative of three experiments. The Mann-Whitney and Kruskal-Wallis tests were used; *p<0.05, **p<0.01, ***p<0.001, CTRL=untreated mice.
To understand how this in situ T cell activation occurred, we focused our attention on CD103+ dendritic cells (DCs). CD103+ DCs are subset of cross-presenting DCs that are critical for antitumor T-cell stimulation.26 27 We showed that CRT triggered strong CD103+ expression as well as costimulation receptors such as CD40, CD80 on DC isolated from tumor draining lymph nodes (TDLN), in accordance with the transcriptomic signatures found in online supplemental figure S4. This suggests that DCs could be involved in antitumor CD8+T-cells priming after CRT. To test this assumption, we isolated CD11c+ DCs from TDLN of 3 days after CRT or from untreated B16-OVA-bearing mice. The DC were co-cultured in presence of anti-OVA T-cells from OTI or OTII mice and the specific production of IFN-γ was assessed by the ELISpot assay (online supplemental figure S4). In contrast to DCs isolated from untreated mice, those from CRT-treated mice triggered strong IFN-γ production by naïve OTI and OTII T-cells (online supplemental figure S4). Thus, CRT improved CD103+ DC activation, cross-presentation and the priming of antitumor T cells responses.
Collectively, CRT synergistically promotes robust CD8 T-cell expansion and activation in the TME and requires an active IFN-γ pathway in vivo.
Induction of intratumoral CD103+ tissue resident memory CD8+ T cells expansion after CRT
Tissue resident memory T lymphocytes (TRM) are a subpopulation of memory T cells, which ensure immune surveillance in non-lymphoid tissues. Increased TRM infiltration in TME is associated to a better prognosis in several cancers.28 29 Furthermore, recent findings reported that the presence of TRM in TME is associated to response to anti-PD-1/PD-L1 therapy.28 30 Thus, we wondered if the local inflammation promoted by CRT could also trigger TRM activation (figure 4A).
As shown in TC1-bearing mice, the key genes related to TRM signature such as retention and adhesion molecules ITGAe (CD103), ITGA4 (CD49a), RGS1 and RGS-2, immune checkpoints (eg, CTLA4, HAVCR2, Pdcd1) as well as transcription factors associated with TRM (eg, Notch-RBPJ, Runx3) were highly upregulated after CRT as compared with RT and CT (figure 4B). Next, TRM monitoring within TME by flow cytometry at day 7 post therapy showed that the rate of CD103+CD49a+CD8+TRM was twofold to threefold increased after CRT as compared with RT, CT and untreated TC1-bearing mice thus, supporting the transcriptomic data (figure 4C,D). Interestingly, around 50% of tumor-specific CD8+ TILs displayed CD103+CD49a+ CD8+TRM phenotype in the CRT-treated group (figure 4E). kinetic analysis revealed that a substantial proportion of E7-specific CD8+ TRM was still detected 3 weeks after CRT and RT but not in CT-treated and untreated mice (figure 4F). Next, we investigated the functionality of the tumor-specific CD8+ TRM and found that the frequencies of IFN-γ and TNF-α producing CD8+ TRM in response to E749-57 peptide was higher within TILs from CRT-treated mice than in control groups (figure 4G). Of note, no obvious changes of CD103+CD49a+ CD8+TRM were detected in the TDLN or in the spleen from tumor-bearing following CRT (not shown). In addition, the ability of CRT to activate tumor-specific CD103+ CD49a+ CD8+TRM was also confirmed in CT26 tumor-bearing mice by tracking AH1 as model of tumor-associated antigen (figure 4H–J).
In patients with rectal cancer (online supplemental figure S5), we also found that the transcripts of TRM-related genes, such as (ITGAE) CD103 and (ITGB4) CD69, together with CD8 gene were simultaneously upregulated in the TME of patients treated by nCRT as compared with nRT-treated patient. Furthermore, in CRT-exposed tumors, a strong positive correlation was found between TRM markers, CD8 T cells, PD-1 and LAG-3. The strength of the TRM signature and the expression of PD-1 and LAG-3 was significantly higher (around two times) in patients presenting the best histological response after neoadjuvant therapy (Dworak >2). This effect was especially observed in nCRT-exposed tumors as compared with colorectal patients treated with nRT alone (online supplemental figure S5).
Thus, our results demonstrate the ability of CRT to expand functional tumor reactive CD103+ TRM in the TME.
CRT induces adaptive immune resistance and regulatory T cells expansion in mouse TME
Transcriptomic data from both patients with colorectal cancer and mouse TME indicates that CRT synergistically promotes the upregulation of genes related to immune checkpoint ligand/receptors. To confirm this statement, the expression of immune checkpoint exhaustion receptors was assessed by flow cytometry from TILs isolated after CRT or monotherapy.
We detected high percentages of exhausted phenotype PD1 +TIM-3+CD8+ TILs in CRT-treated mice as compared with the control groups (figure 5A,B). Similar phenotypic features were observed when focusing on tumor-specific CD8+ TILs. Indeed, a higher rate (>65%) of E7-specific CD8+ TILs displayed exhausted phenotype by coexpressing PD-1 and TIM-3 after CRT, as compared with RT and CT (50% and 30%, respectively) (figure 5C,D). The kinetic analysis showed that PD1+TIM-3+ anti-E7 CD8+ TILs reached a peak on day 7 and decreased 3 weeks later during the contraction phase of T cell response (figure 5E).

Triggering of adaptive immune resistance and functional Tregs after chemoradiation (CRT). (A) Representative flow cytometry dot plots of PD1 and TIM3 expression on total CD8+ tumor-infiltrating lymphocyte (TILs) and on E749-57 specific CD8+ TILs in CTRL, radiotherapy (RT), chemotherapy (CT) and CRT-treated mice 7 days post treatment. (B) Histograms showing percentages of the PD1 and TIM3 coexpressing CD8+ TILs (data expressed as means±SEM). (C) Representative flow cytometry dot plot graphs of PD1 and TIM3 expression on E749-57 specific CD8+ TILs in CTRL, RT, CT and CRT-treated mice 7 days post treatment. (D) Histograms showing percentages of the PD1 and TIM3 coexpressing E749-57 specific CD8+ TILs (data expressed as means±SEM). (E) Flow cytometry dot plot graphs of PD1 and TIM3 coexpression on E749-57 specific CD8+ TILs assessed at days 3, 7, 15, and 21 post CRT (left) and percentages associated (right) from TC1. (F) Flow cytometry dot plot graphs of PD-L1 expression (left) and percentages associated (right) in TC1 model. (G) Representative flow cytometry dot plot graphs of TC1 (top) and CT26 (bottom)-infiltrating CD25high CD4+ Foxp3+Treg cells and the percentages/tumor size ratio according to the CTRL, RT, CT and CRT groups (left). (H) Percentages/tumor size ratio of CD25high CD4+ Foxp3+Treg cells in TC1-bearing mice. Data are representative of 2–3 experiments in each tumor model and are expressed as means±SEM; n=5–6 mice/treatment group. The Kruskal-Wallis test were used; **p<0.01. (I–M) Depletion of Regulatory T cell (DEREG) mice (n=5/treatment group) were injected with 2.105 TC1 cells and were treated or not treated with CRT. Treg cells were conditionally depleted using diphtheria toxin (DTX). (I) Schedule of DTX injections is shown. (J) Representative flow cytometry dot plot graphs of Treg cells in mice treated with CRT with or without DTX. (K) Scatter plots showing tumor growth in DEREG mice treated with CRT with or without DTX. Data are representative of two independent experiments; n=5–6 mice/treatment group. (L) Representative dot plot graphs of E749-57 specific CD8+ TILs (top) from the DTX, CRT, and CRT plus DTX-treated mice (left) and associated percentages (right). (M) Representative flow cytometry dot plot graphs showing of Ki67 expression on CD8+ TILs (left) and associated percentages (right). Data are representative of two independent experiments and are expressed as means±SEM; n=5–6 mice/treatment group. The one-way analysis of variance and Kruskal-Wallis tests were used; *p<0.05,**p<0.01,***p<0.001.
In parallel, we assessed the kinetic of PD-L1 expression in the TME by flow cytometry and found overexpression of PD-L1 in TC1 tumor tissues exposed to CRT. The induction of PD-L1 expression on TC1 cells started at 3 days after CRT, reached a peak at day 7 and decreased to a basal expression, similar to the kinetic of exhausted phenotype CD8+ TILs expansion (figure 5F). Similar expansion of exhausted phenotype CD8+TILs together with PD-L1 was also found in CT26-bearing mice (online supplemental figure S6). Moreover, transcriptomic data showed that expression of galectin 9, the ligand of TIM-3, was positively correlated with TIM-3+ CD8+TILs expansion (data not shown). All above suggest that CRT triggers strong adaptive immune resistance phenomenon in the TME.6
Previous evidence support the ability of RT to promote suppressive cells such as regulatory T cells in the TME which limit antitumor immunity.31–33 Here, we found that as RT, CRT induced high expansion of regulatory T-cells (Tregs) in the TME (figure 5G,H). By using DEREG mice, we demonstrated that in vivo depletion of Foxp3+Tregs with diphteria toxin (DTX) significantly increased CRT effectiveness (figure 5I–K). Furthermore, DTX treatment combined with CRT induced a high expansion of functional E7-specific CD8+TILs (figure 5L,M). Thus, CRT induces immune suppressive Treg in the TME.
Immune checkpoints blockade sustains the CRT-induced adaptive antitumor T-cell immunity
All the above data suggest that CRT represents a potent approach to convert a cold TME toward a hot one suitable for ICI activity.
To this purpose, we first investigated the efficacy of CRT combined with a single agent anti-PD-1 or anti-CTLA-4 in HPV 16+TC1 tumor model. We found that these combinations, mainly with anti-CTLA-4 appeared more effective for delaying tumor growth and to increase mice survival compared with ICI alone or CRT (online supplemental figure 7). However, this approach failed to cure tumor in most mice, suggesting that this was not an optimal regimen.
Previous reports showed that concurrent blockade of PD-1 and CTLA-4 pathways may have complementary functions, leading to better tumor control.34
Thus, we sought out to evaluate the dual blockade of CTLA-4 and PD-1 pathways combined with CRT in order to sustain CRT-induced antitumor T cells.
To this end, TC1-bearing mice were treated with CT or RT, or CRT combined with dual anti-CTLA-4 and anti-PD-1 therapy (anti-CTLA-4/PD-1) and the control groups received the dual immunotherapy alone or the cytotoxic therapies (CRT, RT or CT) (figure 6A). The results showed a strong antitumor effect of the CRT plus anti-CTLA-4/PD-1 combination therapy. Indeed, more than 80% of mice treated with this combination achieved complete tumor response and experienced significant improvement of survival as compared with the control groups (figure 6B,C). Of note, the bitherapy anti-CTLA-4/PD-1 was inefficient to eradicate TC1 tumor reinforcing the capacity of CRT to sensitize this tumor to ICI. We observed several weeks after therapy, the occurrence of vitiligo in mice cured after the CRT plus anti-CTLA-4/PD-1 combo (figure 6D). This skin immune-related side effect occurs in patients with cancer during immune checkpoint therapy and is commonly associated with therapy effectiveness.35
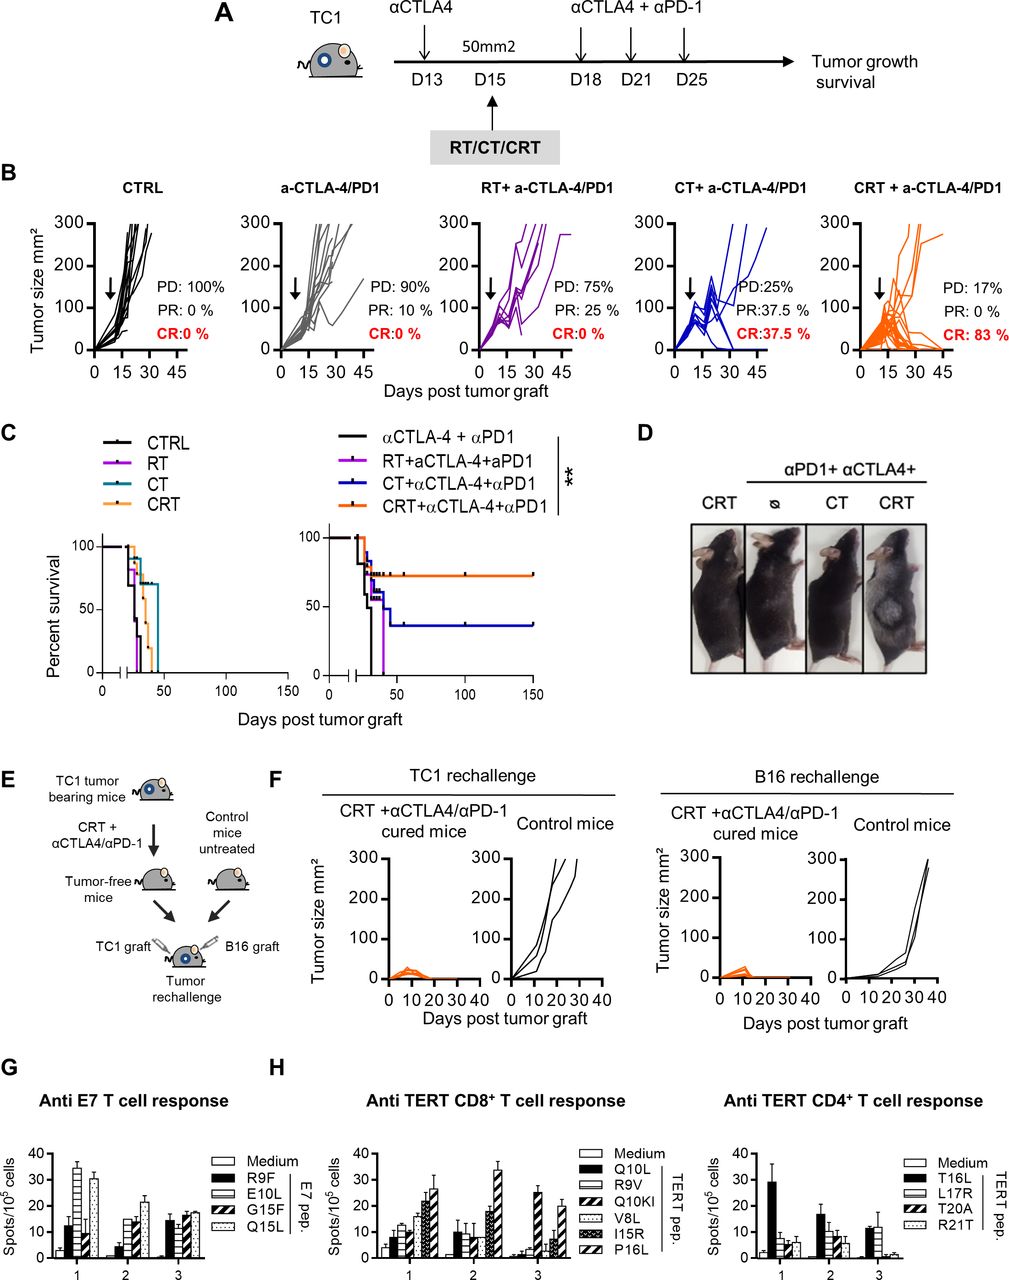
Effect of single or dual immune checkpoint blockade combined with concurrent chemoradiotherapy (CRT) in TC1-bearing mice. (A) TC1 tumor-bearing mice received a single injection of anti-CTLA-4 (200 µg ip) 2 days before CRT followed by three injections of anti-PD-1 and CTLA-4 antibodies (200 µg ip each) 3 days post CRT. (B) Tumor growth of CTRL, chemotherapy (CT), radiotherapy (RT) and CRT-treated mice with or without anti-CTLA-4/PD-1 therapy. Tumor responses (progressive disease (PD), partial response (PR), complete response (CR)) are indicated. (C) Survival curves of TC1 tumor-bearing mice. (D) Representative images of mice with vitiligo undergoing treatment (n=8–12 mice/treatment group). Data are representative of two experiments. (E) Tumor-free mice that were treated with CRT+anti-CTLA-4/PD-1were re-challenged with TC1 and B16 tumor cells 100 days after CRT. (F) Tumor growth curve of untreated or CRT+ anti-CTLA-4/PD-1-treated cured mice rechallenged with TC1 (left) and B16 (right) tumor cells 100 days post CRT. (G) Splenocytes from TC1 tumor-cured mice previously treated with CRT+anti-CTLA-4/PD-1 were assessed ex vivo for specific interferon (IFN)-ɣ production in presence of E7 by IFN-ɣ ELIspot assay. Functional analysis of anti-E7 CD8+ T cell responses are shown. Data are representative of two independent experiments and are expressed as mean±SEM. (H) Splenocytes from CRT+anti-CTLA-4/PD-1-treated cured mice were assessed ex vivo for specific IFN-ɣ production in presence of telomerase by IFN-ɣ ELIspot assay. Functional analysis of CD8+ telomerase-derived peptides T-cell responses (left) and CD4+ telomerase-derived peptides T-cell responses (right) are shown. Data are representative of two independent experiments and are expressed as mean±SEM.
To ensure that this combination strategy results to the establishment of a long-lasting protective antitumor immunity, we performed tumor rechallenge experiments (figure 6E). Indeed, all mice cured (>100 days after the combo CRT plus anti-CTLA-4/PD-1) rejected a second TC1 tumor graft, contrary to untreated control mice (figure 6F). Unexpectedly, these mice were also preserved from primary challenge with B16F10 melanoma, suggesting the establishment of a large diversity of tumor antigen specific T-cell responses (figure 6F). Accordingly, spleen T-cells from cured mice produced high amount of IFN-γ against a broad range of epitopes derived from E7 antigen expressed by TC1 cells as well as against MHC class I and II-restricted epitopes derived from mouse telomerase, as shared tumor-associated antigen (figure 6G,H). These results suggest that an epitope spreading phenomenon may also contribute to the efficacy of the CRT combined with anti-CTLA-4/PD-1 bitherapy.
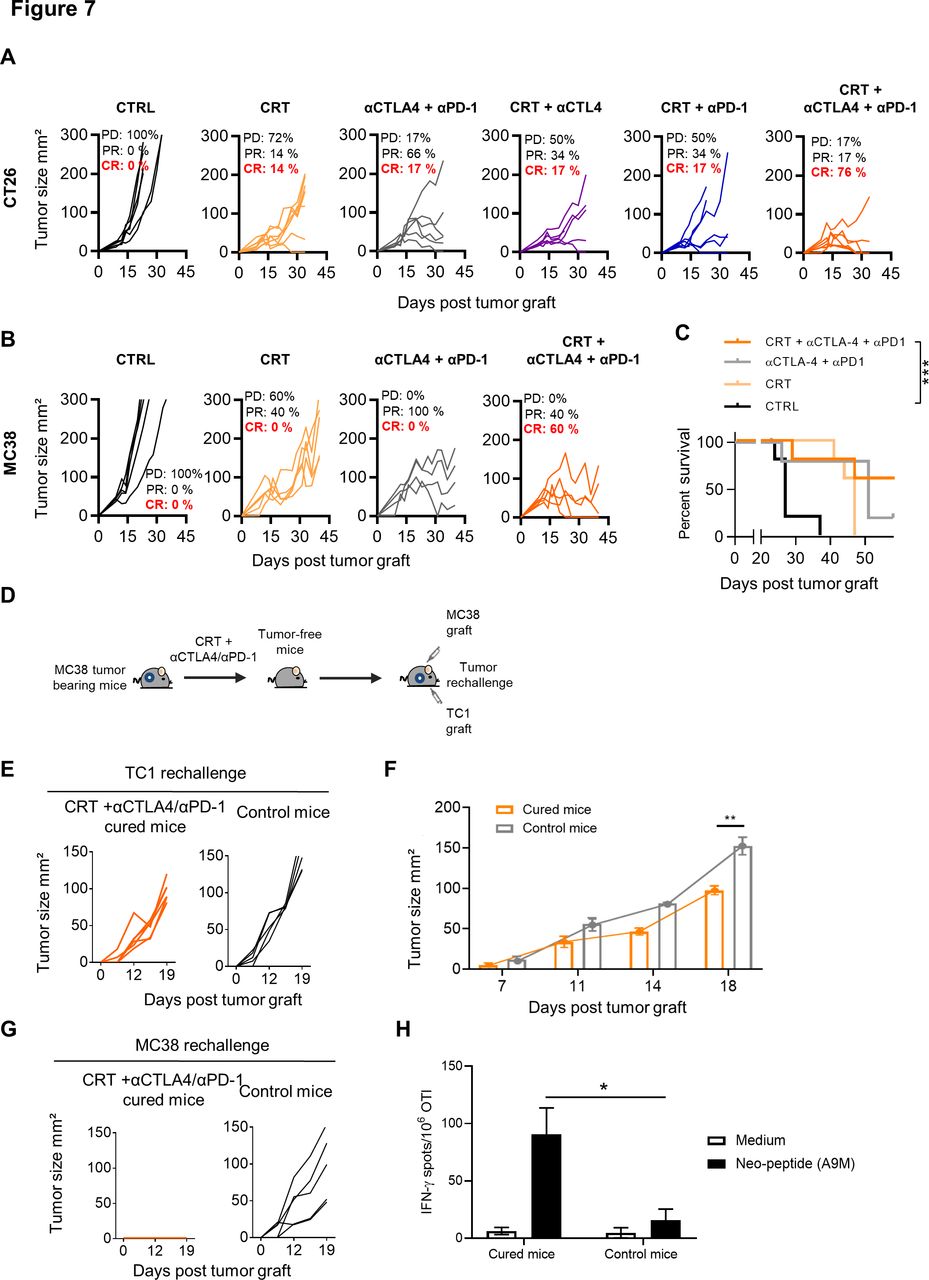
In the CT26 model, which mimic microsatellite stable (MSS) colorectal cancer, we also found that CRT was able to sensitize this tumor to the dual anti-CTLA-4/PD-1 blockade in BALB/c mice. Notably, more than 75% of CT26 tumor-bearing mice treated with the combo CRT+anti-CTLA-4/PD-1 displayed complete tumor regression as compared with CRT combined with a single ICI (figure 7A).
Effect of single or dual immune checkpoint blockade combined with chemoradiotherapy (CRT) in CT26 and MC38 tumor-bearing mice. (A) CT26 tumor-bearing mice received or not a single injection of anti-CTLA-4 (200 µg ip) 2 days before CRT followed by three injections of anti-PD-1 and/or CTLA-4 antibodies (200 µg ip each) 3 days post CRT. Tumor growth of CTRL and CRT-treated mice with or without anti-CTLA-4/PD-1 therapy. Tumor responses (progressive disease (PD), partial response (PR), complete response (CR)) are indicated. (B) MC38 tumor-bearing mice received or not a single injection of anti-CTLA-4 (200 µg ip) 2 days before CRT followed by three injections of anti-PD-1 and/or CTLA-4 antibodies (200 µg ip each) 3 days post CRT. Tumor growth of CTRL and CRT-treated mice with or without anti-CTLA-4/PD-1 therapy. Tumor responses (progressive disease (PD), partial response (PR), complete response (CR)) are indicated. (C) Survival curves of MC38 tumor-bearing mice. Data are representative of two experiments with 6–8 mice/group, the Bonferroni method was used. ***p<0.001. (D) MC38 tumor-free mice that were treated with CRT+anti-CTLA-4/PD-1 were rechallenged with TC1 tumor cells. Experimental scheme is depicted. (E) Tumor growth curve of TC1 tumors engrafted to untreated or MC38 tumor-free mice previously treated by CRT+anti-CTLA-4/PD-1. (F) Kinetic of TC1 tumor growth in CTRL and MC38 tumor-free mice previously treated with CRT+anti-CTLA-4/PD-1. (G) Tumor growth curve of MC38 tumors engrafted to untreated or MC38 tumor-cured mice previously treated by CRT+anti-CTLA-4/PD-1. (H) Splenocytes from MC38-cured mice previously treated by CRT+anti-CTLA-4/PD-1 were assessed ex vivo for specific interferon (IFN)-ɣ production in presence of the A9M neoepeptide by IFN-ɣ ELIspot assay. Functional analysis of anti-A9M CD8+ T cell responses are shown. Data are representative of one independent experiment and are expressed as mean±SEM. Kruskal-Wallis test was used; *p<0.05.
Finally, we tested this combination approach in MC38 tumor, a second model of colorectal cancer, syngeneic in C57BL/6 mice. This tumor has additional advantage of being a microsatellite instable (MSI) CRC model known to be more sensitive to checkpoint inhibitors.36 Although tumor control was observed in all mice treated with anti-CTLA-4/PD-1, complete remissions were only achieved in MC38 tumor-bearing mice treated with the combo CRT+anti-CTLA-4/PD1 (60%) (figure 7B,C). Although the cured mice failed to reject primary TC1 graft (figure 7D,E), the growth of this tumor appeared to be slower in cured mice than in untreated control mice (figure 7E,F). In contrast, cured-mice successfully rejected a second challenge with MC38 cells and also exhibited functional CD8 T cells directed against A9M peptide, a neoepitope expressed by MC38 cells, thus demonstrating that the immune protection triggered by CRT was tumor specific (figure 7G,H).
Collectively, our results strongly support the capacity of CRT to establish a highly inflamed TME, suitable for ICI effectiveness.
Discussion/conclusion
Many synergistic combinational therapies have been designed to improve the success of current ICI.37 Among them, the combination of ICI with conventional cytotoxic therapies is currently used or evaluated in routine clinical practice in many solid tumors.2 8 9 In this context, concurrent CRT also gained significant interest in the clinic as combinatorial strategy with ICI. CRT represents a standard curative treatment for several locally advanced cancers.38 The addition of CT to radiation synergistically improves locoregional control through the induction of irreversible DNA damages.38
In this study, we performed an in-depth understanding of the immunological effects of CRT on TME. Our results demonstrated the potent ability of CRT to convert a poorly immunogenic TME into a highly inflamed one.
The findings in patients with colorectal cancer demonstrated that a neoadjuvant CRT (nCRT) creates a higher inflamed TME than nRT. The TME from most patients treated by nCRT displayed a transcriptomic signature related to activated and memory Th1 polarization as compared with the group treated by nRT alone. Although this cohort is limited, our results described a positive correlation between the inflamed signature induced by nCRT and the histological response.22 Indeed, more than 65% of best histological response (Dworak ≥2) occurred in patients exhibiting a hot/lukewarm TME after neoadjuvant therapy. The majority of high-inflamed tumors were observed after nCRT, suggesting that nCRT synergistically exert an immune activation in the TME. The TME of patients with rectal cancer exposed to nCRT was more enriched in PD-L1 expressing cells than those treated by nRT alone. Indeed, more than 80% of tumor from patients treated by nCRT exhibited a high score of PD-L1 expression. Many evidences support that the level of PD-L1 expression in TME is correlated to the efficacy of ICIs and thus, PD-L1 status became a standard predictive biomarker for anti-PD-1/PD-L1 therapy decision in some cancers.39 Of note, less than 10% of tumors untreated by a neoadjuvant therapy (surgery exclusive) exhibited a high score of PD-L1 expression. The difference of in-situ immune reaction between nCRT and nRT may be related to a synergistic immune effect. Indeed, like RT, capecitabine also displays immune stimulatory effects which justified its combination with immunotherapy.40–42 However, we cannot exclude that the difference of in-situ immune levels between nRT and nCRT tumors may be explained by tumoral-associated features such as mismatch repair, KRAS, BRAF mutational status and differentiation grade, rather than treatments received. Nevertheless, as treatment regimens are not associated to these features, the probability of unbalanced frequencies is decreased in treatment groups and so these parameters should not interfere with observed differences. The treatment duration does not seem to have major impact on immune microenvironment as all patients with nRT that had LC or SC RT exhibited a cold homogeneous immune signature except one patient with LC in Nanostring-based transcriptomic analysis. Thus, these results suggest that the immune activation triggered by nCRT could create a more suitable TME for ICI action rather than nRT.
To study more precisely the immunological changes induced by CRT in the TME, we performed a high throughput translational study in mouse tumor models exposed to RT, CT or CRT.
The study was conducted in C57BL/6 mice using HPV16 E7 +TC1 tumor and in BALB/c mice with CT26, a syngeneic model of colon cancer. These malignancies are typically treated by platinum-based CRT in clinical settings. Thus, cisplatin and 5-fluorouracil, two common radio-sensitizing cytotoxic drugs for human cancers, followed by RT at focal 8 Gy were administered to tumor-bearing mice.43 44
Like in patients with colorectal cancer, transcriptomic data from TILs isolated in CT26 and TC1 tumors showed that inflammatory responses, cellular-mediated immunity and the INF-γ signaling pathway were synergistically enriched in CRT-exposed TME. Kinetic analysis of T-cells from CRT-exposed TME indicates that CRT promotes a massive and early expansion of CD8+ T-cells within the tumor during the first 7 days, followed by a contraction phase at days 15–21. The importance of newly T-cell migration was supported by results showing that T-cells depletion during the expansion phase (day 7) abrogated the ability of CRT to delay tumor growth in contrast to T cell depletion performed prior CRT. These findings are in line with report by Shinto and colleagues showing increased CD8+ T-cell infiltration in tumor biopsies from patients with rectal cancer treated by CRT.18 Furthermore, our recent findings in patients with rectal cancer showed a positive association between the signs of local cytotoxic immune activation and the production type-I interferon-associated molecules and the response to neoadjuvant CRT.45 These results highlight that the effectiveness of CRT relies on its capacity to foster early expansion of functional tumor-reactive CD8+ T cells in the TME.
Another important result of this study both in human and mouse concerns the potent capacity of CRT to trigger tumor-specific CD103+ tissue resident memory CD8+ T cells expansion and activation in the TME both in TC1 and CT26 models.
TRM are usually confined within non-lymphoid tissues, and rapidly display effector functions on antigen stimulation. Intratumoral TRM cells have been detected in several solid tumors and are thought to play a critical role in cancer immunosurveillance as well as in immunotherapy.28 30 46 We found that genes encoding Notch and Runx3 transcription factors, two master regulators involved in CD8+TRM cells induction and maintenance30 47 were highly upregulated and positively correlated to TRM signature after CRT. This capacity of CRT to promote strong TRM stimulation may explain the positive correlation observed between the magnitude of TRM signature and the best histological response after nCRT in the rectal cancer cohort. Recent studies in mice suggested that irradiated intratumoral TRM cells, which are more radio-resistant than circulating T cells mediate tumor control in the absence newly-infiltrating T cells.48 Although the dependence of CRT on intratumoral TRM activation was not formally demonstrated in this study, our results indicate that both de novo effector T cells infiltration and TRM cells expansion can mediate tumor control after CRT.
Searching for the mechanism underlying the in situ T cell priming mediated by CRT, we demonstrated that fully activated CD103+ DCs from TDLN are involved in the robust antitumor T cell activation observed after CRT. This observation suggests that these CD103+ DCs migrate through TDLN to stimulate T cells and also able to prime CD103+ TRM cells in situ.26 49 This observation is also in line with previous data suggesting that avoiding irradiation of tumor-draining lymph nodes (TDLN) supports immune activation.50 Indeed, in this study, tumors were engrafted in the abdominal flank for technical convenience, thus allowing the radiation field to be selectively delivered to the tumor. Accordingly, we observed that DCs from TDLN of mice treated with RT alone were able to effectively stimulate naïve T cells, such as DCs from CRT exposed tumors (not shown). Further investigations with orthotopic models or using genetically engineered mouse models would be needed to properly mimic human cancer settings.
Although we found that CRT triggers adaptive immune activation in the TME, this does not really translate into inhibition of tumor growth. Hence, the rate of complete and durable responses observed in our mouse tumor models did not exceed 15%. This raises the question of why the antitumor immunity primed by CRT is not sufficient to eradicate tumor in most mice. One explanation relies in the ambivalent effect of RT capable to promote immune suppressive cells such as Tregs and MDSCs.32 51 Here, the suppressive side effects observed after CRT were inherent to radiation and not to CT (cisplatin and 5 fluorouracil), which did not induce Tregs expansion but can deplete MDSC in vivo.10 In line with this, we demonstrated that temporal depletion of Tregs increased CRT-induced antitumor CD8+ TILs and in turn, improved the efficiency of CRT.
Because the induction of T-cell exhaustion has been involved in acquired resistance to CT or RT,52–54 we hypothesized that this phenomenon could be synergistically activated by CRT. Consistently, our data revealed overexpression of immune checkpoints (PD-1, TIM-3) on TILs expanded after CRT. Furthermore, the respective ligands of these receptors, especially PD-L1 was found to be upregulated early after CRT and its expression on tumor cells positively correlated with the dynamic PD-1+CD8+TILs, suggesting an adaptive IFN-ɣ-mediated immune resistance in the TME.55 The adaptive resistance phenomenon was also found in the TME of rectal patients treated with nCRT.
All above indicates that platinum-based CRT establishes a highly inflamed TME, enriched in TILs and TRM cells, PD-L1 and IFN-ɣ signaling, factors required for the successful responsiveness to ICI.4 12 Then, we evaluated concurrent combination of CRT with ICI in HPV16 E7 +TC1 tumor as a model of head and neck cancers known to be sensitive to immunotherapy and in CT26, a microsatellite stable phenotype (MSS) colon cancer which is less sensitive to ICI. Results from these two models show that CRT sensitized TC1 and CT26 to PD-1 or CTLA-4 blockade therapy. However, this combination strategy was not able to induce complete tumor eradication in most mice. In contrast, our results reveal that combining CRT with dual CTLA-4 and PD-1 blockade induced drastic tumor eradication in both in TC1 and CT26 model. In these two tumor models, around 75% of tumor-bearing mice achieved complete tumor regression as compared with 17% and 10% when CRT was combined with a single ICI in CT26 and TC1 models, respectively. These results suggest that both CTLA-4 and PD-1 inhibition is required for optimal sustaining of CRT-induced adaptive antitumor T-cell immunity. This is supported by the ability of the combinational therapy to promote robust and long-lasting antitumor T cell immunity that confer resistance against a second tumor challenge. Previous reports indicated that concurrent blockade of the PD-1/PD-L1 and CTLA-4 pathways may have complementary cellular mechanisms distinct from monotherapy, leading to better tumor control.36 56 For example, highly exhausted-phenotype CD8+T cells were expanded following anti-PD-1 monotherapy but not after anti-CTLA-4/PD-1 bitherapy.57 Since CTLA-4 is highly expressed on Tregs, the anti-CTLA-4 could also contribute to inhibit suppressive Tregs cells induced after CRT.56 58
Interestingly, we confirmed these results in a third model of MC38 tumor used as MSI phenotype which represents a prototype of immune-sensitive tumor. In MC38 model, the heat promoting effect of CRT also resulted in a better efficiency compared with anti-CTLA-4/PD-1 bitherapy. Nevertheless, combining with CT or RT alone would probably do the same. The CRT regimen used here represents a limit of this study since a single fraction of 8 Gy does not reflect the current protocol used in the clinic. However, previous studies showed that the delivery of 8 Gy per fraction induced CD8 T cells recruitment in the tumor.44 Thus, we choose this dose for the present study. Moreover, it has recently been reported that various fractionation RT dose and schemes differentially modulate the immune response in TME and thus, tumor control when associated with ICI.59 60 Hence, the immune responses mediated by a fractionated radiation protocol in combination with more relevant chemotherapies also deserve further investigations.
Multiple combinations of concurrent/sequential CRT plus ICI are currently evaluated in clinic or used as standard of care in some indications.2 15 16 Although the safety profile of these combinational therapies does not seem to limit their development, the optimal timing to introduce ICI therapy is still questioned.
In conclusion, this study deeply dissects CRT-mediated immune mechanisms and demonstrates the ability of CRT to synergistically promote an inflamed TME, robust adaptive antitumor T-cell immunity, two features that are suitable for ICIs action. Our results strengthen the rational to concurrently combine CRT to ICI for optimal antitumor response.
Data availability statement
Data are available upon reasonable request. RNAseq data from mouse tumor exposed to chemoradiotherapy is available in a public two years following the publication.
Ethics statements
Ethics approval
The study was perfomed in accordance with the Declaration of Helsinki. Approval of all centers’ Institutional Review committee was obtained for the study and patients signed informed consents. All experimental studies were approved by the local ethics committee in accordance with the European Union's Directive 2010/63.
Acknowledgments
We thank all the patients for their contributions, all medical doctors, nurses and technicians from the Departments of Radiotherapy of the University Hospital of Besançon, especially Caroline Bonin and Tony Lim and the European Georges Pompidou Hospital (Paris) for their support to collect the data. We also thank the animal technicians for their technical support. We thank Pr. Carpentier for for kindly providing us the A9M neopeptide. This work was supported by grants from the Fonds de Dotation de Recherche en Santé Respiratoire, La Ligue Contre le Cancer, and Conseil Régional Bourgogne Franche Comté.
References
Supplementary materials
Supplementary Data
This web only file has been produced by the BMJ Publishing Group from an electronic file supplied by the author(s) and has not been edited for content.
Footnotes
Twitter @boidot_romain
Contributors Conceptualization: OA. Cytotoxic drugs preparation and radiation procedures in mice: CB, CL, SP, TL, MK, EM, SS, CM and FT. Preclinical tumor models: ELMJ, LR, MD, LB, MA JRP, FB, and JB. Transcriptomics techniques and data analysis in mice: RB, PR, MD, ELMJ, AK, CE, and EC. Immunological study and data analysis in mice: ELMJ, LR, LB, AM, MD, LS, JB, FB, and JRP. Patients enrolment: SS, XS, EM, JB, GP, and MV. Transcriptomics analysis, immuno-histochemistry, and immune monitoring in patients with cancer: AK, FP, CE, CL, EG, AR, and LB. Writing with input from all authors: ELMJ, MD, CE, AK, FP, and OA. Supervision: OA. Funding acquisition: OA.
Funding This work was supported by grants from Fonds de Dotation de Recherche en Santé Respiratoire, La Ligue Contre le Cancer and the Conseil Régional of Bourgogne Franche Comté.
Competing interests None declared.
Provenance and peer review Not commissioned; externally peer reviewed.
Supplemental material This content has been supplied by the author(s). It has not been vetted by BMJ Publishing Group Limited (BMJ) and may not have been peer-reviewed. Any opinions or recommendations discussed are solely those of the author(s) and are not endorsed by BMJ. BMJ disclaims all liability and responsibility arising from any reliance placed on the content. Where the content includes any translated material, BMJ does not warrant the accuracy and reliability of the translations (including but not limited to local regulations, clinical guidelines, terminology, drug names and drug dosages), and is not responsible for any error and/or omissions arising from translation and adaptation or otherwise.