Article Text

Abstract
Purpose Regulatory T cells (Tregs) heavily infiltrate triple-negative breast cancer (TNBC), and their accumulation is affected by the metabolic reprogramming in cancer cells. In the present study, we sought to identify cancer cell-intrinsic metabolic modulators correlating with Tregs infiltration in TNBC.
Experimental design Using the RNA-sequencing data from our institute (n=360) and the Molecular Taxonomy of Breast Cancer International Consortium TNBC cohort (n=320), we calculated the abundance of Tregs in each sample and evaluated the correlation between gene expression levels and Tregs infiltration. Then, in vivo and in vitro experiments were performed to verify the correlation and explore the underlying mechanism.
Results We revealed that GTP cyclohydrolase 1 (GCH1) expression was positively correlated with Tregs infiltration and high GCH1 expression was associated with reduced overall survival in TNBC. In vivo and in vitro experiments showed that GCH1 increased Tregs infiltration, decreased apoptosis, and elevated the programmed cell death-1 (PD-1)-positive fraction. Metabolomics analysis indicated that GCH1 overexpression reprogrammed tryptophan metabolism, resulting in L-5-hydroxytryptophan (5-HTP) accumulation in the cytoplasm accompanied by kynurenine accumulation and tryptophan reduction in the supernatant. Subsequently, aryl hydrocarbon receptor, activated by 5-HTP, bound to the promoter of indoleamine 2,3-dioxygenase 1 (IDO1) and thus enhanced the transcription of IDO1. Furthermore, the inhibition of GCH1 by 2,4-diamino-6-hydroxypyrimidine (DAHP) decreased IDO1 expression, attenuated tumor growth, and enhanced the tumor response to PD-1 blockade immunotherapy.
Conclusions Tumor-cell-intrinsic GCH1 induced immunosuppression through metabolic reprogramming and IDO1 upregulation in TNBC. Inhibition of GCH1 by DAHP serves as a potential immunometabolic strategy in TNBC.
- immunotherapy
- breast neoplasms
- indoleamine-pyrrole 2,3-dioxygenase
- lymphocytes
- tumor-infiltrating
Data availability statement
Data are available upon reasonable request.
This is an open access article distributed in accordance with the Creative Commons Attribution Non Commercial (CC BY-NC 4.0) license, which permits others to distribute, remix, adapt, build upon this work non-commercially, and license their derivative works on different terms, provided the original work is properly cited, appropriate credit is given, any changes made indicated, and the use is non-commercial. See http://creativecommons.org/licenses/by-nc/4.0/.
Statistics from Altmetric.com
Introduction
Triple-negative breast cancer (TNBC) is defined by the lack of expression of the estrogen receptor and progesterone receptor and no amplification of human epidermal growth factor receptor 2. TNBC represents 12%–17% of all breast cancer cases, yet it carries the worst prognosis as a result of its aggressive characteristics and limited treatment options.1 2 Particularly, TNBC is a heterogeneous disease,3 4 which hinders the efficacy of single treatment modality. Xiao et al5 used an original multiomics dataset of 386 patients from our institute and classified TNBC microenvironment into three clusters: the immune-desert cluster, the innate immune-inactivated cluster, and the immune-inflamed cluster. With the same dataset, Gong et al6 identified three metabolic pathway-based subtypes of TNBC, characterized by the dysregulation of lipid synthesis, glucose and nucleotide metabolism, and mixed metabolic pathways. These findings indicate the necessity of a rational combinational therapy for TNBC, including immunotherapies and metabolism-targeting therapeutics.
Regulatory T cells (Tregs) are a subset of T cells that express CD4, CD25, and forkhead box protein P3 (FOXP3). Equipped with highly immunosuppressive capacity, Tregs heavily infiltrate human tumors, comprising 10%–50% of CD4+ T cells in the tumor bed.7 Higher infiltration of Tregs or a higher ratio of Tregs to CD8+ T cells has been associated with reduced survival and an increased tendency to metastasize in various types of cancers.7 8 Tregs exert their immunosuppressive activity through a myriad of mechanisms and molecules, including the secretion of immunosuppressive cytokines, direct cytolysis, and metabolic disruption.9 Hence, manipulating Tregs has a great potential as a new anticancer strategy. Tregs accumulation and aggregation in the tumor microenvironment (TME) are reportedly due to the metabolic reprogramming of tumor cells, chemokine-induced recruitment, and resistance to reactive oxygen species (ROS).9–11
Metabolic reprogramming is a newly emerged hallmark of tumor cells.12 Depending on the genetic landscape, microenvironment, cellular origin, and functional phenotype, various metabolic pathways in cancer cells can be dysregulated to facilitate tumor growth and invasion.13 These metabolic alterations also change the physicochemical properties of the TME and further affect infiltrating immune cells, depriving them of essential nutrients and metabolic fitness.11 Thus, interventions targeting dysregulated metabolic pathways hold great promise for boosting the efficacy of immunotherapy.
In the present study, we aimed to investigate tumor-cell-intrinsic metabolic modulators in TNBC that were related to Tregs infiltration and to investigate potential therapeutics that would synergize with immunotherapy.
Methods
Clinical samples
Clinical information with survival status, RNA-sequencing (RNA-seq) data (tumor tissues: n=360; paired normal tissues: n=88), and tissue microarray data (n=244) of the present study were obtained from patients in the Fudan University Shanghai Cancer Center (FUSCC) TNBC Project (FUSCC cohort).5 6 All tissue samples within this study were retrieved with approval from the FUSCC Ethics Committee, and written informed consent was provided by each patient. The latest follow-up of our cohort was completed on January 22, 2020, with a median follow-up duration of 65.4 months. Expression profiles and somatic copy number variation data of the Molecular Taxonomy of Breast Cancer International Consortium (METABRIC) and The Cancer Genome Atlas (TCGA) cohorts were downloaded from website (http://www.cbioportal.org/). TNBC sample selection of the METABRIC cohort was based on expression data.
Calculation of Tregs abundance and gene set enrichment analysis (GSEA)
The abundance of Tregs in each sample of the three cohorts was calculated with the expression data using the single sample GSEA (“GSVA” function in R) tool, as described previously.5 The pan-tissue aryl hydrocarbon receptor (AHR) signature consisting of 166 genes was generated by merging of the genes curated from the Gene Expression Omnibus database (https://www.ncbi.nlm.nih.gov/geo/) and the Transcription Factor Target Gene Database (http://tfbsdb.systemsbiology.net/) by Sadik et al.14 Thirty-two genes involved in the tryptophan (Trp) pathway collected from the PathCards database (https://pathcards.genecards.org) comprised the Trp utilization gene set.15 Ordered by the mRNA level of GTP cyclohydrolase 1 (GCH1), the top and bottom 20% of patients in each cohort were respectively defined as GCH1-high and GCH1-low cohorts in GSEA analysis (GSEA software V.4.1.0). Genes with a correlation with GCH1 higher than 0.4 were defined as GCH1-related genes.
Immunohistochemistry (IHC)
Immunodetection of GCH1 was conducted with a tissue microarray of samples from 244 patients with TNBC. Sections were deparaffinized, preheated, and antigen-retrieved via heat induction (pH=8); incubated with an anti-GCH1 antibody (Santa Cruz, Cat#271482) at 4℃ overnight, visualized with diaminobenzidine (DAB), and counterstained with hematoxylin. Two independent pathologists who were blinded to the clinicopathological information interpreted the IHC results. The staining score, ranging from 0 to 3, was generated by multiplying the percentage of positive staining (0–1) by the staining intensity (0–3). The high-expression cohort was defined as patients with a staining score not less than two.
Immunofluorescence
Cells were fixed with 4% paraformaldehyde (Yeasen, Cat#36314ES76); permeabilized with 0.1% Triton X-100; blocked with 5% goat serum; incubated with an anti-AHR antibody (Abcam, Cat#ab190797), sequentially with a secondary antibody conjugated to Alexa 488; and, finally, sealed with mounting medium with DAPI (Abcam, Cat#ab104139).
Human Tregs isolation and coculture system
Human peripheral blood mononuclear cells (PBMCs) were isolated by Ficoll (Solarbio, Cat#P8900) density gradient centrifugation. Tregs were purified from PBMCs with the CD4+CD25+CD127dim/− regulatory T cell isolation kit (Miltenyi Biotec, Cat#130-094-775) according to the manufacturer’s instructions. The isolated Tregs were cultured in Roswell Park Memorial Institute (RPMI) 1640 medium containing 10% fetal bovine serum (FBS), 100 U/mL interleukin 2 (BioLegend, Cat#589106), 1 µg/µl anti-CD3 (BioLegend, Cat#300314), and 1 µg/µl anti-CD28 (BioLegend, Cat#302934). After stimulation for 3 days, Tregs were cocultured with tumor cells at a 5:1 ratio for 48 hours in a transwell system with 0.4 µm pores (Corning, Cat#3413). Then, Tregs were collected and stained for apoptosis and programmed cell death-1 (PD-1) analysis.
Animal experiments and treatment protocol
4T1 cells with ectopic expression of GCH1 or knockdown of GCH1 were injected into the fat pads of 6–8-week-old female BALB/c immunocompetent mice. For evaluation of Tregs depletion, anti-CD25 (BioXcell, Cat#BP0012) or isotype IgG1 (BioXcell, Cat#BP0088) antibodies were intraperitoneally injected every 3 days (200 µg per mouse). In the experiment with combination therapy, mice inoculated with 4T1 cells overexpressing GCH1 were randomly divided into four different treatment groups after tumors were palpable. 2,4-Diamino-6-hydroxypyrimidine (DAHP) (100 mg/kg, Sigma-Aldrich, Cat#D19206) or dimethyl sulfoxide (DMSO) was administered orally twice daily, in combination with the intraperitoneal injection of anti-PD-1 (BioXcell, Cat#BP0273) or isotype rat IgG2a (BioXcell, Cat#BP0089) (100 µg per mouse, every 3 days) antibodies. Tumor volumes, recorded every 3 days, were calculated by the formula volume = width2×length/2. Protocols involving animals were approved by the animal welfare committee of Shanghai Medical College at Fudan University.
Harvested tumors were processed into single-cell suspensions. Briefly, tumors were first minced into submillimeter pieces and then digested with 0.5 mg/mL collagenase type I (Sigma-Aldrich, Cat#SCR103), 2.5 U/mL hyaluronidase (Sigma-Aldrich, Cat#H1136), and 1 mg/mL deoxyribonuclease (DNase) Ⅰ (Roche, Cat#RN4501) at 37°C for 1 hour under constant shaking. Tissue dissociations were then filtered with 70 µm cell strainers (BD Biosciences) and lysed with red blood cell lysis buffer (BioLegend, Cat#420302). Isolated mononuclear cells were collected and subjected to cell staining for flow cytometry analysis.
Flow cytometry
Cells were incubated with the recommended dilutions of fluorochrome-conjugated monoclonal antibodies against the following antigens: mouse CD45 (BioLegend, Cat#103128), mouse CD3 (BioLegend, Cat#100222), mouse CD4 (BioLegend, Cat#100422), mouse CD8a (BioLegend,Cat #100708), mouse PD-1 (BioLegend, Cat#135210), mouse CD25 (BioLegend, Cat#101912), human CD4 (BioLegend, Cat#357409), human CD25 (BioLegend, Cat#302625), and human PD-1 (BioLegend, Cat#329908). Intracellular staining of FOXP3 (BioLegend, Cat#320008) was performed with Foxp3/Transcription Factor Staining Buffer Set (eBioscience, Cat#00-5523-00) according to the manufacturer’s instructions after surface staining. For intracellular staining of mouse interferon γ (IFN-γ) (BioLegend, Cat#505810), the cells were stimulated with Cell Activation Cocktail (BioLegend, Cat#423303) for 6 hours and then subjected to surface and intracellular staining. Tregs were gated by the markers CD4+CD25+FOXP3+, while CD8+ T cells were gated by CD45+CD3+CD8+. An Annexin V-FITC/PI Apoptosis Detection Kit (Yeasen, Cat#40302ES60) was used to evaluate the apoptosis of Tregs and CD8+ T cells. The apoptosis was evaluated as cells with Annexin V staining (including early and late apoptosis). The levels of ROS were detected with the ROS Assay Kit (Beyotime, Cat#S0033S). Data analysis was performed using FlowJo software (V.10).
RNA isolation and real-time quantitative reverse transcription PCR (qRT-PCR)
Total RNA was isolated using TRIzol reagent (Invitrogen, Cat#15596018). First-strand cDNA was synthesized using PrimeScript RT Master Mix (TaKaRa, Cat#RR036). Real-time quantitative PCR (qPCR) was performed using SYBR Premix Ex Taq (TaKaRa, Cat#RR420). The primers used for qPCR are listed in online supplemental table 1.
Supplemental material
Cell culture, treatment, and transfection
The human breast cancer cell lines BT549, Hs578T, and MDA-MB-453 and human embryonic kidney (HEK) 293 T cells, together with the murine breast cancer cell line 4T1, were obtained from American Type Culture Collection and maintained under standard conditions.
For investigation of Trp metabolites and DAHP on indoleamine 2,3-dioxygenase 1 (IDO1) expression, cells were challenged with tetrahydrobiopterin (BH4, 10 µM, Sigma-Aldrich, Cat#T4425), L-5-hydroxytryptophan (5-HTP, 0.25–2 mM, MedChemExpress, Cat#HY-N0122), serotonin (10 µM, MedChemExpress, Cat#HY-B1473), N-acetyl-5-hydroxytryptamine (NAS, 100 µM, MedChemExpress, Cat#HY-107854), melatonin (1 µM, MedChemExpress, Cat#HY-B0075), and DAHP (0.25–4 mM).
Human GCH1 cDNA, AHR cDNA, and mouse Gch1 cDNA were cloned into the pCDH-CMV-MCS-EF1-puro plasmid from System Biosciences. Three recommended short hairpin RNA (shRNA) sequences designed by the Sigma-Aldrich shRNA designer were cloned into the pLKO.1 vector for stable knockdown of GCH1. Amino acid substitutions and base deletions were generated following the instructions of the KOD-Plus Mutagenesis Kit (TOYOBO, Cat#SMK-101). The standard protocol of Neofect DNA transfection reagent (TengyiBio, Cat#TF201201) was applied for all transient plasmid transfections. The small interfering RNA (siRNA) purchased from RiboBio (Guangzhou, China) was transfected into cells with Lipofectamine RNAiMAX Transfection Reagent (Thermo Fisher Scientific, Cat#13778030). The primer sequences for transfection are listed in online supplemental tables 2 and 3. All transfections were validated with qPCR or western blot.
Western blot
Proteins extracted from cells or tissues were run on a sodium dodecyl sulfate polyacrylamide gel and then transferred to polyvinylidene difluoride (PVDF) membranes (Millipore). The membranes were probed with antibodies against the following antigens: GCH1 (Abcam, Cat#ab264392), IDO1 (Proteintech, Cat#13268-1-AP), AHR (Proteintech, Cat#17840-1-AP), histone deacetylase 1 (HDAC1, Proteintech, Cat#10197-1-AP), glyceraldehyde-3-phosphate dehydrogenase (GAPDH, Proteintech, Cat#60004-1-Ig), Flag (Sigma-Aldrich, Cat#F1804), and Vinculin (Abcam, Cat#ab129002). In some experiments, the protein content in the nuclear and cytoplasmic fractions was isolated using Nuclear and Cytoplasmic Extraction Reagents (Thermo Fisher Scientific, Cat#78833) according to the supplier’s instructions. The ImageJ program was applied to quantify the immunoblotting bands.
Chromatin immunoprecipitation (ChIP) followed by qPCR (ChIP-qPCR)
ChIP-qPCR was performed with the SimpleChIP Enzymatic Chromatin IP Kit (Cell Signaling Technology, Cat#9002S) according to the manufacturer’s instructions. In brief, BT549 cells treated with 5-HTP (1 mM) for 48 hours were immunoprecipitated with an anti-AHR antibody (Cell Signaling Technology, Cat#83200). All data were presented as the corresponding fold change. An anti-rabbit IgG (Cell Signaling Technology, Cat#2729) antibody was used as a negative control. The primer sequences used for ChIP-qPCR are listed in online supplemental table 1.
Luciferase assays
HEK-293 T cells were transfected with the Renilla luciferase plasmid pRL-SV40, the firefly luciferase plasmid pGL3 cloned with the IDO1 promoter, and the pCDH-AHR plasmid for 48 hours. Then, the cells were treated with 5-HTP (500 µM) for 24 hours and subjected to dual luciferase analyses with the Dual-Luciferase Reporter Assay System Kit (Promega, Cat#E1910). The results were displayed as fold induction after normalization of the firefly luciferase activity to the Renilla activity.
Colony formation and Cell Counting Kit-8 (CCK-8) assays
For the colony formation assay, cells were seeded in a six-well plate and then fixed and stained with 0.2% crystal violet solution after 14 days. For the CCK-8 assay, the absorbance at 450 nm was determined 2 hours after the addition of 10 µl of CCK-8 solution (Vazyme, Cat#A311-01).
ELISA
The BH4 levels in the supernatant of cells were detected with the ELISA Kit (MyBioSource, Cat#MBS733839). Experiments were conducted following the manufacturer’s instructions.
Liquid chromatography with tandem mass spectrometry (LC–MS/MS) analysis
Sample extracts were analyzed using an ultraperformance liquid chromatography (UPLC, Shim-pack UFLC SHIMADZU CBM30A, https://www.shimadzu.com/) and tandem mass spectrometry (MS/MS, QTRAP, https://sciex.com/) systems. Briefly, cell samples (107 cells per sample), supernatant samples (50 µl per sample), and breast cancer tissue samples (25 mg per sample) were thawed on ice and then mixed with 1000 µl of extract solution. Metabolite extraction, LC–MS/MS analysis, compound identification and quantification, and differential metabolite analysis were performed as reported previously.16
Statistical analysis
All statistical analyses were performed using GraphPad Prism V.6.0 software. Pearson correlation was used to assess the relationship between gene expression and Tregs infiltration. Two-tailed unpaired or paired Student’s t-tests were used to compare the differences between the two groups. Two-way analysis of variance (ANOVA) tests were used for analyzing tumor outgrowth data and in vitro cellular growth data. The results of in vitro experiments are presented as the mean±SD from at least three independent experiments. P<0.05 was considered significant.
Results
GCH1 positively correlates with Tregs infiltration in TNBC
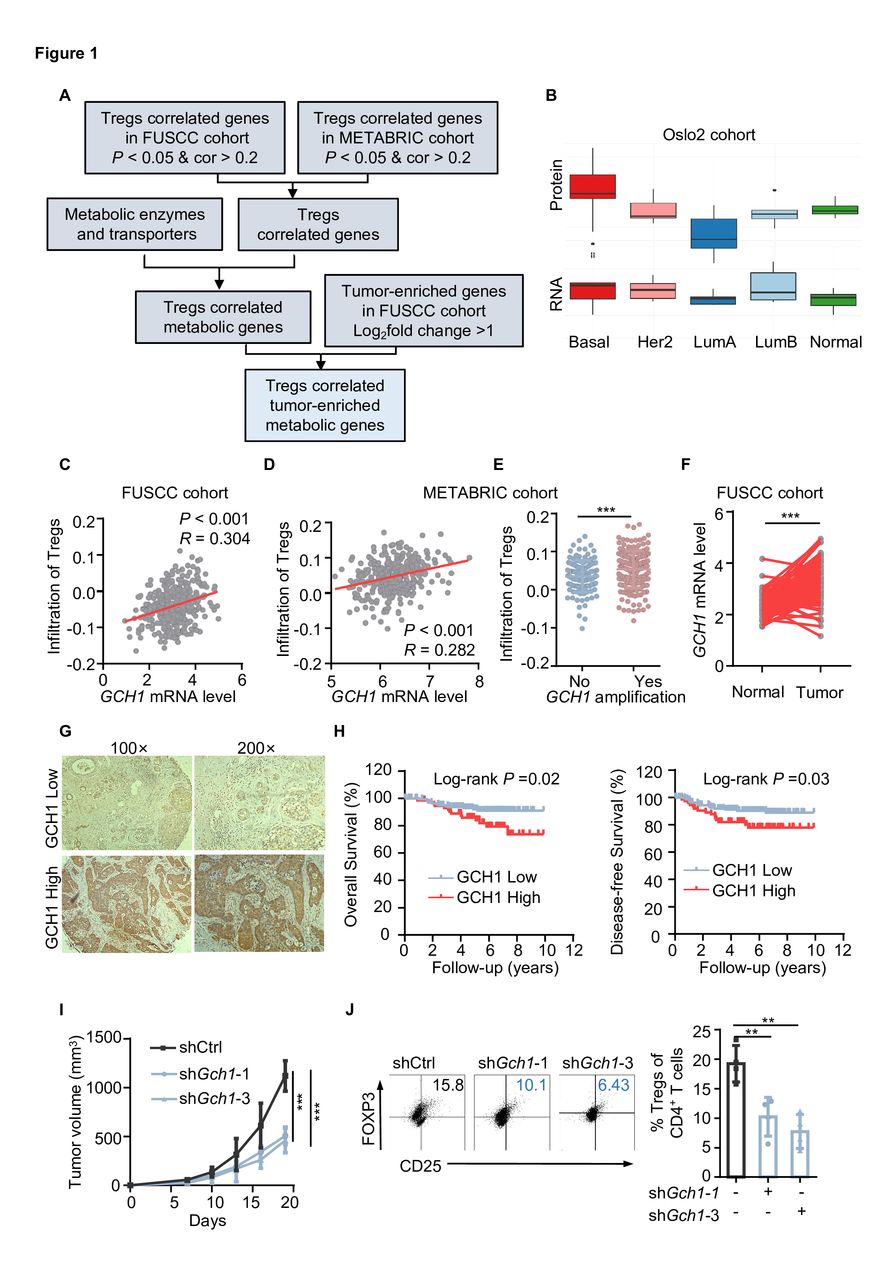
We first estimated the abundance of Tregs in the FUSCC and METABRIC TNBC cohorts and calculated the correlation between gene expression and Tregs abundance. In total, 1280 genes were positively related to Tregs infiltration in both cohorts. Next, metabolic enzymes and transporters were screened,17 and the gene expression levels in tumor tissue and paired normal tissue were compared. Finally, 18 tumor-enriched metabolic genes were found to be relevant to Tregs infiltration (figure 1A and online supplemental figure S1A). Based on the RNA-seq data from Cancer Cell Line Encyclopedia, GCH1 was relatively enriched in breast cancer cell lines (online supplemental figure S1A). Additionally, GCH1 expression was higher in the basal subtype than in the other subtypes of the Oslo2 Landscape cohort (figure 1B), with a positive mRNA–protein correlation (cor=0.4281). Concretely, the mRNA level of GCH1 was positively associated with Tregs infiltration in the FUSCC and METABRIC TNBC cohort (figure 1C and D). In addition, the infiltration of Tregs was more abundant in the group with GCH1 amplification (figure 1E). The correlation between GCH1 and Tregs infiltration was validated in the TCGA TNBC cohort (online supplemental Figure S1B). Compared with adjacent normal breast tissue, GCH1 was relatively enriched in the tumor tissue (figure 1F and online supplemental figure S1C). Through IHC staining, we found that GCH1 was commonly expressed in TNBC samples (figure 1G) and was associated with reduced overall survival and disease-free survival in FUSCC cohort (figure 1H).

GTP cyclohydrolase 1 (GCH1) positively correlates with regulatory T cells (Tregs) infiltration in triple-negative breast cancer (TNBC). (A) Schematic diagram depicting the screening of metabolic genes that are positively related to Tregs infiltration in TNBC cohorts. (B) The protein and mRNA abundance of GCH1 in different subtypes of breast cancer tissues (n=9 each, Oslo2 Landscape cohort). Her2, human epidermal growth factor receptor 2; LumA, luminal A; LumB, luminal B. (C and D) Correlation between the GCH1 mRNA level and Tregs infiltration in the Fudan University Shanghai Cancer Center (FUSCC) cohort (C) and the Molecular Taxonomy of Breast Cancer International Consortium (METABRIC) TNBC cohort (D) determined by Pearson correlation analysis. (E) The infiltration of Tregs with GCH1 amplification in the METABRIC TNBC cohort. (F) GCH1 mRNA level in the adjacent normal and tumor tissues in the FUSCC cohort. (G) Immunohistochemistry detection of GCH1 in the FUSCC cohort. (H) Kaplan-Meier analysis of overall survival and disease-free survival in the FUSCC cohort (n=168 in the GCH1-low cohort and n=76 in the GCH1-high cohort). (I) Volumes of tumors harvested from mice injected with a total of 5×10⁵ 4T1 cells expressing control or Gch1 short hairpin RNA. (J) Representative dot plot of Tregs analyzed by flow cytometry (gated on CD4+ T cells) and the corresponding quantitative results (n=4 each). The data are presented as the mean±SD (E, I, and J): two-tailed unpaired Student’s t-test for E and J, paired t-test for F, and two-way analysis of variance (ANOVA) test for I. **P<0.01 and ***P<0.001. FOXP3, forkhead box protein P3; shCtrl, short hairpin control; shGch1, short hairpin Gch1.
Next, we knocked down GCH1 expression in 4T1 cells (online supplemental figure S1D) and conducted an in vivo experiment to verify the correlation between GCH1 and Tregs infiltration. As shown in online supplemental figure S1E,F, GCH1 downregulation did not alter the proliferation capacity of cancer cells in vitro, yet it reduced tumor growth in vivo (figure 1I and online supplemental figure S1G). Flow cytometry analysis of Tregs revealed that GCH1 downregulation significantly decreased the infiltration of Tregs (assessed by the ratio of Tregs and the total number of Tregs per gram of tumor tissue)(figure 1J and online supplemental figure S1H). Together, these results demonstrate that GCH1 is positively associated with Tregs infiltration and indicates poorer survival in TNBC.
GCH1 promotes Tregs infiltration, reduces apoptosis, and increases the PD-1+ fraction
To further determine the specific role of tumor-intrinsic GCH1 in shaping the Tregs immune phenotype, we ectopically expressed GCH1 in 4T1 cells and implanted the cells into immunocompetent BALB/c mice (online supplemental figure S2A). In vitro experiments confirmed that no proliferative potential was gained via GCH1 overexpression (online supplemental figure S2B,C); however, it significantly accelerated tumor growth (figure 2A and online supplemental figure S2D) and increased Tregs infiltration in vivo (figure 2B and online supplemental figure S2E). Compared with the control tumors, Tregs in tumors overexpressing GCH1 exhibited a decreased frequency of apoptosis and an increased proportion of PD-1 positivity (figure 2C,D). As the pivotal ingredient of the immune microenvironment, CD8+ T cells were also analyzed by flow cytometry (online supplemental figure S2F). GCH1 overexpression in tumor cells decreased CD8+ T cell infiltration (figure 2E and online supplemental figure S2G), induced apoptosis (figure 2F), increased PD-1+ cells (figure 2G), and diminished the production of IFN-γ (figure 2H), indicating the exhaustion state of CD8+ T cells. The above findings suggest that GCH1 overexpression in TNBC yields an immunosuppressive microenvironment facilitating tumor growth. Next, another in vivo study was conducted to evaluate the efficacy of Tregs depletion on tumor growth in the two groups. Compared with the isotype control, Tregs depletion significantly attenuated tumor growth in the tumors overexpressing GCH1 (figure 2I and online supplemental figure S2H), indicating that the protumor effect of GCH1 mainly depended on the existence of Tregs.
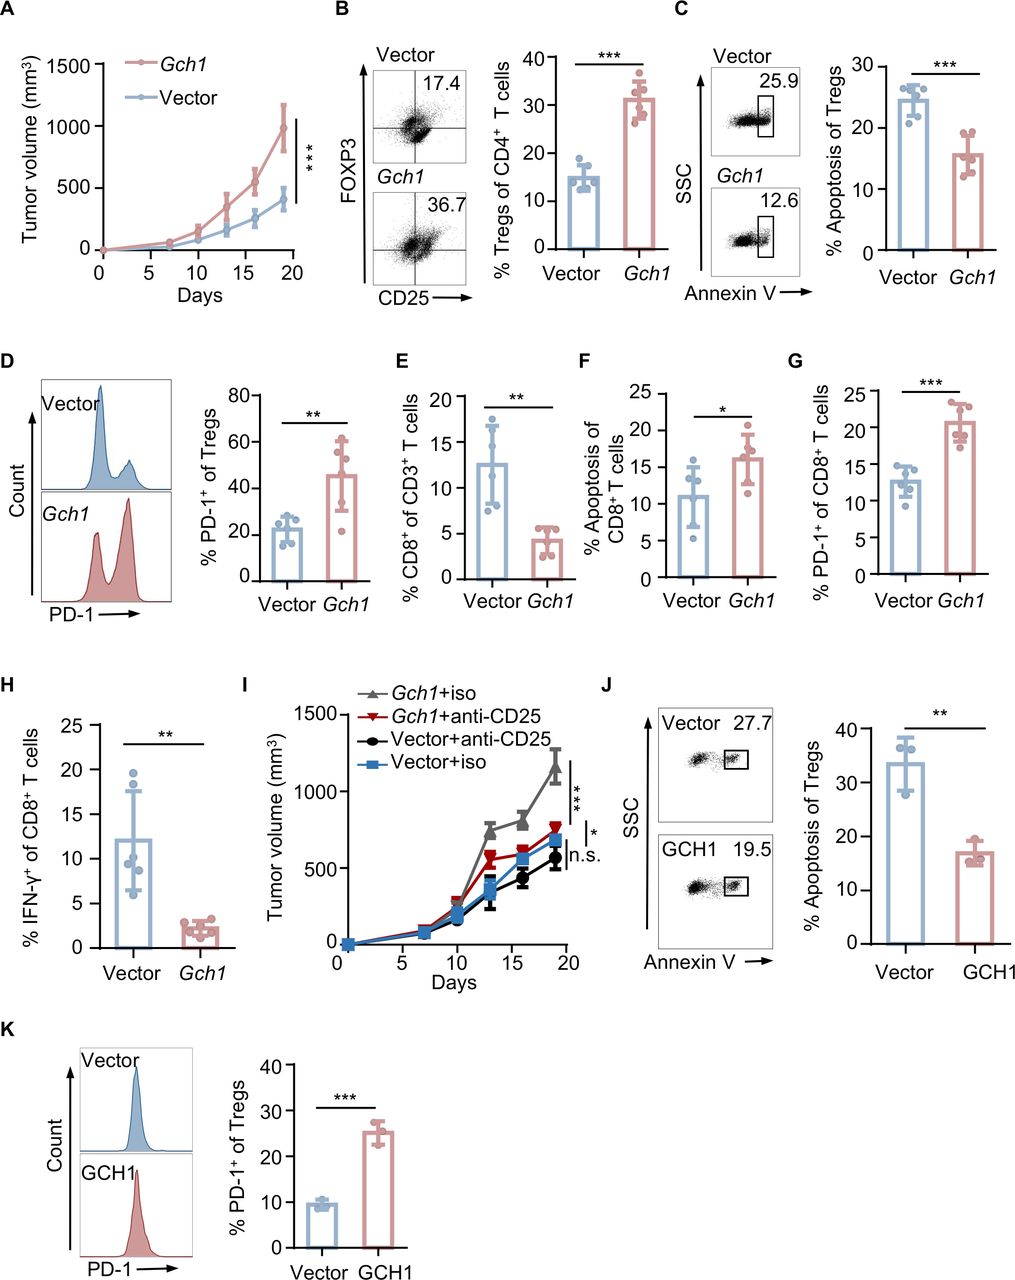
GTP cyclohydrolase 1 (GCH1) increases regulatory T cells (Tregs) infiltration, reduces apoptosis, and increases the programmed cell death-1 (PD-1)+ fraction. Tumors were harvested from mice with orthotopic injection of a total of 3×10⁵ 4T1 cells expressing a control empty vector (Vec) or GCH1 (n=6 each). (A) Tumor volumes. (B) Representative dot plot of Tregs analyzed by flow cytometry and the corresponding quantitative results. (C) Representative dot plot of Tregs apoptosis analyzed by flow cytometry and the corresponding quantitative results. (D) Representative histograms of PD-1 on Tregs analyzed by flow cytometry and the corresponding quantitative results. (E, F, G, and H) Quantitative results of CD8+ T cell infiltration (E), apoptosis (F), PD-1 expression (G), and interferon-γ (IFN-γ) production (H) analyzed by flow cytometry. (I) Volumes of tumors from mice with orthotopic injection of a total of 3×10⁵ 4T1 cells expressing Vec or GCH1. The mice were treated with isotype IgG or an anti-CD25 antibody after the tumors were palpable. (J and K) Representative dot plot or histograms and the corresponding quantitative results of apoptosis (J) and PD-1 expression (K) of Tregs cocultured with BT549 cells expressing Vec or GCH1. The data are presented as the mean±SD (A, B, C, D, E, F, G, H, I, J, and K). Two-way analysis of variance (ANOVA) test for A and I; two-tailed unpaired Student’s t-test for B, C, D, E, F, G, H, J, and K; n=3 independent experiments (J and K). *P<0.05; **P<0.01; ***P<0.001; n.s., not significant. FOXP3, forkhead box protein P3; iso, isotype; SSC, side scatter.
To further validate the association between GCH1 and Tregs, we performed coculture experiments of Tregs with human breast cancer cell lines with GCH1 modulation. Based on the expression level in TNBC cell lines (online supplemental figure S2I), we used BT549 cells for the ectopic expression of GCH1, and we downregulated GCH1 expression in MDA-MB-453 cells using shRNAs (online supplemental figure S2J). Consistent with the results from the in vivo experiments, GCH1 overexpression reduced Tregs apoptosis and increased PD-1+ cells (figure 2J,K), while GCH1 downregulation had the opposite effects (online supplemental figure S2K,L). Taken together, these data suggest that GCH1 modulates the infiltration, viability, and PD-1 positivity of Tregs.
GCH1 augments Tregs infiltration via IDO1 upregulation
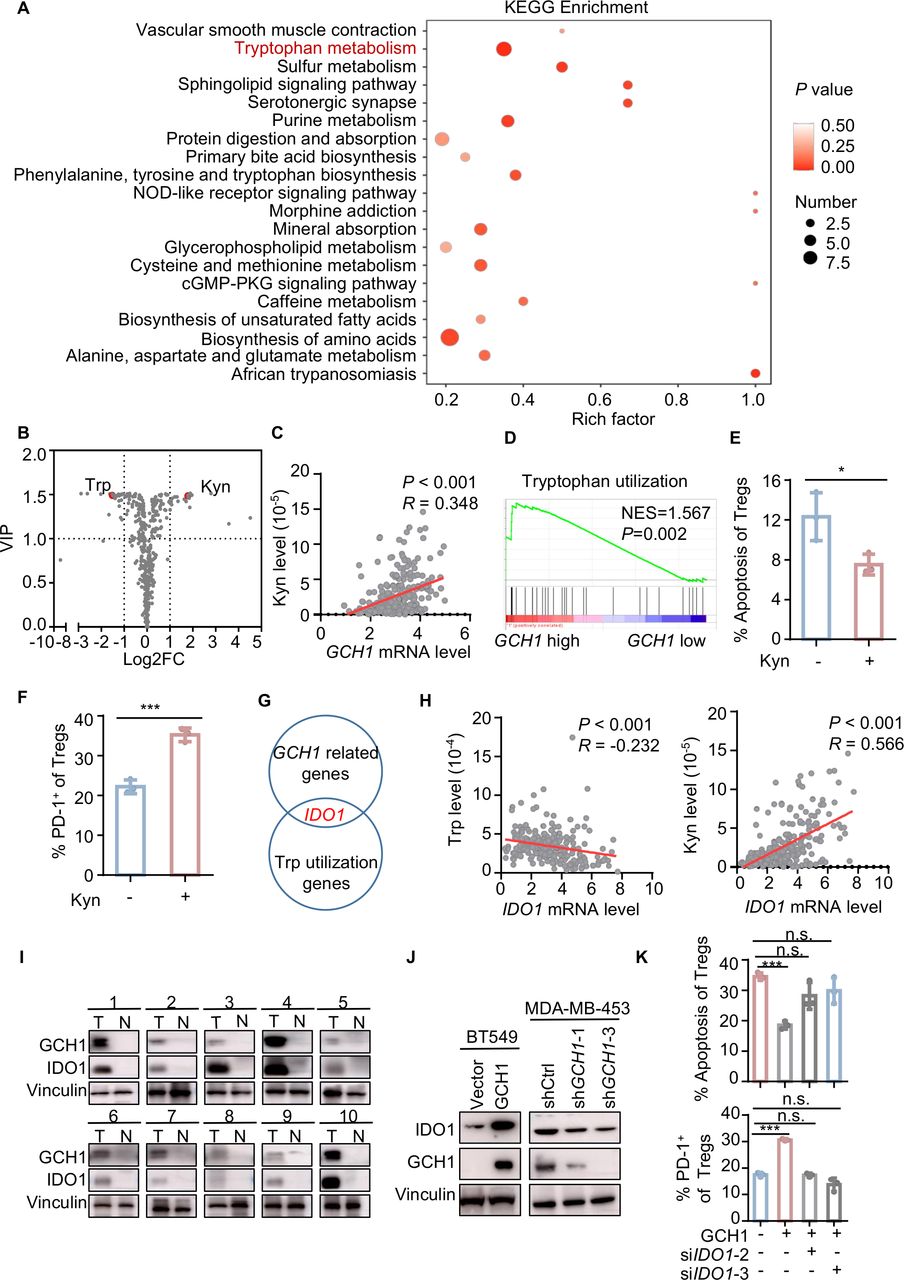
GCH1 is the initial and rate-limiting enzyme for BH4 synthesis, and BH4 functions as an essential cofactor of aromatic amino acid hydroxylases and nitric oxide synthase.18 Thus, we explored the metabolic alterations that could be induced by GCH1 modulation. Kyoto Encyclopedia of Genes and Genomes enrichment of metabolites in the supernatants of GCH1-overexpressing cells indicated that one of the most significantly altered pathways involved Trp metabolism (figure 3A), exhibiting a decrease of Trp and an increase of kynurenine (Kyn) (figure 3B). Additionally, the Kyn level of breast cancer tissue was significantly associated with the mRNA expression of GCH1 in the FUSCC cohort (figure 3C). GSEA showed that Trp utilization was enriched in TNBC cohorts with high levels of GCH1 (figure 3D and online supplemental figure S3A). Consistent with this finding, Kyn supplementation resulted in a decrease in the apoptosis of Tregs and an increase in the PD-1+ fraction of Tregs (figure 3E,F). Here, we also assessed the levels of ROS and Tregs-relevant chemokines,9 and we found that GCH1 overexpression, Kyn supplementation, or Trp deficiency did not facilitate Tregs accumulation (online supplemental figure S3B,C). These findings suggest that GCH1 modulates the immune phenotype and apoptotic phenotype of Tregs via the reprogramming of Trp. To determine the key factors connecting GCH1 with Trp metabolism, we merged the Trp utilization gene set with the GCH1-related gene set in the FUSCC cohort and found that IDO1 was the only candidate in both gene sets (figure 3G). The mRNA level of IDO1 was positively correlated with that of GCH1 and Tregs infiltration in the FUSCC, METABRIC, and TCGA TNBC cohorts (online supplemental figure S3D–F). Moreover, a negative correlation between the mRNA level of IDO1 and Trp level and a strong positive correlation between the mRNA level of IDO1 and Kyn level were demonstrated in the FUSCC cohort (figure 3H). In breast cancer tissues, higher GCH1 expression coexisted with IDO1 enrichment (figure 3I), and a positive correlation between GCH1 and IDO1 at the protein level was noted in Oslo2 Landscape cohort (online supplemental figure S3G). Next, we validated the correlation in cancer cell lines. IDO1 expression was significantly upregulated in GCH1-overexpressing cells, while GCH1 knockdown downregulated the expression of IDO1 (figure 3J and online supplemental figure S3H–J). To investigate the significance of IDO1 in GCH1-induced immunosuppression, BT549 cells overexpressing GCH1 were transfected with siRNA targeting IDO1 (siIDO1) (online supplemental figure S3K) and then cocultured with Tregs. The effects that tumor-cell-intrinsic GCH1 exerted on the apoptosis and PD-1 expression of Tregs were blunted by IDO1 downregulation (figure 3K). Together, these data suggest that GCH1 reprograms Trp metabolism and upregulates IDO1 expression, which mediates the phenotypic alterations of Tregs.

GTP cyclohydrolase 1 (GCH1) augments regulatory T cells (Tregs) infiltration via indoleamine 2,3-dioxygenase 1 (IDO1) upregulation. (A) Kyoto Encyclopedia of Genes and Genomes (KEGG) enrichment of differential metabolites detected by liquid chromatography with tandem mass spectrometry (LC–MS/MS) in the supernatants of BT549 cells overexpressing GCH1 compared with control cells. (B) Volcano plot of metabolites detected by LC–MS/MS in the supernatants of BT549 cells overexpressing GCH1 compared with control cells. (C) Correlation between the GCH1 mRNA level and Kyn levels detected in breast cancer tissue with LC–MS/MS in the Fudan University Shanghai Cancer Center (FUSCC) cohort (n=258) determined by Pearson correlation analysis. (D) Gene set enrichment analysis plot showing enriched tryptophan (Trp) utilization in the FUSCC GCH1 high cohort. (E and F) Quantitative results of apoptosis (E) and programmed cell death-1 (PD-1) expression (F) of Tregs treated with kynurenine (Kyn, 200 µM) for 24 hours and analyzed by flow cytometry. (G) Merged image of GCH1-related genes in the FUSCC cohort with Trp utilization genes. (H) Correlation between the IDO1 mRNA level and the Trp levels (n=241) and between the IDO1 mRNA level and the Kyn levels (n=258) in breast cancer tissues in the FUSCC cohort determined by Pearson correlation analysis. (I) GCH1 and IDO1 levels detected by western blot in patients with TNBC. (J) Western blot images showing IDO1 levels in BT549 cells overexpressing GCH1 and MDA-MB-453 cells with GCH1 knockdown. (K) Quantitative results of apoptosis and PD-1 expression of cocultured Tregs. Tregs were cocultured with BT549 cells expressing vector or GCH1 transfected with short interfere RNAs targeting IDO1. The data are presented as the mean±SD (E, F, and K): two-tailed unpaired Student’s t-test for E, F, and K and n=3 independent experiments (E, F and K). *P<0.05; ***P<0.001; n.s., not significant. cGMP, cyclic guanosine monophosphate; FC, fold change; Kyn, kynurenine; NES, normalized enrichment score; NOD, nucleotide oligomerization domain; PKG, cGMP-dependent protein kinase; shCtrl, short hairpin control; shGCH1, short hairpin GCH1; siIDO1, small interfering RNA targeting IDO1; Trp, tryptophan; VIP, variable importance in projection.
GCH1 upregulates IDO1 via AHR activation
Next, we explored the mechanism of IDO1 upregulation. AHR is a ligand-activated transcription factor that regulates a variety of biological processes, and Trp derivatives constitute an important category of its endogenous ligands.19 Thus, we questioned whether AHR was activated in GCH1-overexpressing cells. Indeed, GSEA analysis indicated that the AHR signature was enhanced in GCH1-high cohorts (figure 4A). In addition, AHR was positively associated with GCH1 and IDO1 (online supplemental figure S4A–C). Consistently, increased nuclear AHR localization and an elevated AHR ratio of nucleus/cytosol (Nuc/Cyt) were observed in GCH1-overexpressing cells (figure 4B and C) compared with control cells. Accordingly, a reduced AHR ratio of Nuc/Cyt was detected in GCH1-knockdown 4T1 cells (online supplemental figure S4D). Additionally, the upregulation of IDO1 was confirmed in AHR-overexpressing cells (figure 4D). Further, AHR knockdown reversed the upregulation of IDO1 in GCH1-overexpressing cells at both the transcriptional and translational levels (figure 4E,F and online supplemental figure S4E). Taken together, these data suggest that GCH1 upregulates IDO1 via AHR activation.

GTP cyclohydrolase 1 (GCH1) upregulates indoleamine 2,3-dioxygenase 1 (IDO1) via aryl hydrocarbon receptor (AHR) activation. (A) Gene set enrichment analysis plot showing enriched AHR signature in the Fudan University Shanghai Cancer Center (FUSCC), Molecular Taxonomy of Breast Cancer International Consortium (METABRIC) triple-negative breast cancer (TNBC), and The Cancer Genome Atlas (TCGA) TNBC cohorts. (B) Representative immunofluorescence image of AHR in BT549 cells expressing vector (Vec) or GCH1. Scale bar=10 µm. (C) Cytoplasmic and nuclear protein fractions of the AHR protein in cells expressing Vec or GCH1. (D) Relative IDO1 transcription levels detected by quantitative reverse transcription PCR (qRT-PCR) analysis and IDO1 levels detected by western blot in cells expressing Vec or AHR. (E) Relative IDO1 and AHR transcription levels detected by qRT-PCR analysis and IDO1 levels detected by western blot in BT549 cells expressing Vec or GCH1 transfected with small interfering RNA targeting AHR (siAHR). (F) Relative Ido1 and Ahr transcription levels detected by qRT-PCR analysis and IDO1 levels detected by western blot in 4T1 cells expressing Vec or GCH1 treated with siAhr. The data are presented as the mean±SD (D, E, and F): two-tailed unpaired Student’s t-test for D, E, and F; n=3 independent experiments (D, E and F). ***P<0.001. GAPDH, glyceraldehyde-3-phosphate dehydrogenase; HDAC1, histonedeacetylase 1; NES, normalized enrichment score; siAHR, small interfering RNA targeting AHR.
GCH1/5-HTP metabolic axis activates AHR for IDO1 upregulation
Next, we screened the potential Trp metabolites that activated AHR in GCH1-overexpressing cells. Trp degradation is mainly divided into the Kyn pathway and serotonin pathway, which are initially catalyzed by IDO1 and Trp hydroxylase (TPH), respectively (figure 5A).20 The intracellular concentration of BH4, determined by GCH1,21 regulates the activity of TPH.22 23 Thus, serotonin pathway activation is expected to concur with GCH1 upregulation. Indeed, increased intracellular levels of NAS and 5-HTP were observed in cells overexpressing GCH1 (figure 5B). We therefore exposed cancer cell lines to these TPH-derived metabolites to investigate whether they modulated IDO1 expression. In contrast to other metabolites, a 5-HTP challenge dramatically upregulated IDO1 in both BT549 and Hs578T cells (figure 5C and online supplemental figure S5A). Further experiments demonstrated that 5-HTP, at concentrations below the half-maximal inhibitory concentration (IC50) (online supplemental figure S5B), upregulated IDO1 in a concentration-dependent and time-dependent manner (figure 5D,E and online supplemental figure S5C,D). Additionally, supplementation of 5-HTP restored IDO1 expression in GCH1-knockdown cell lines (figure 5F and online supplemental figure S5E). Furthermore, AHR was activated following 5-HTP exposure, as shown by nuclear translocation (figure 5G) and an elevated AHR ratio of Nuc/Cyt (figure 5H). Next, we knocked down AHR in cancer cells and then exposed the cells to 5-HTP. The upregulation of IDO1 induced by 5-HTP supplementation was abolished by AHR knockdown in multiple cell lines (figure 5I and online supplemental figure S5F,G). Because AHR is a transcription factor, we surveyed the IDO1 gene promoter region for potential AHR binding sites (ABS) (online supplemental figure S5H) and found two predicted sites, ABS1 and ABS2, in the PROMO database (http://alggen.lsi.upc.es/cgi-bin/promo_v3/promo/promoinit.cgi?dirDB=TF_8.3) (online supplemental figure S5I). Next, ChIP-qPCR was performed with primers targeting ABS1 or ABS2 and confirmed that AHR bound to the promoter of IDO1 (figure 5J and online supplemental figure S5J). Furthermore, when we concomitantly expressed AHR and an IDO1 promoter–luciferase reporter in HEK-293 T cells, we observed that supplementation of 5-HTP induced a significant increase in the luciferase activity (figure 5K). Further luciferase analysis with pGL3 vectors carrying IDO1 promoter with ABS deletion mutations showed that AHR directly promoted IDO1 transcription through both ABS1 and ABS2 (figure 5L). Together, these data suggest that GCH1/5-HTP metabolic axis induces the activation of AHR and subsequently transcriptionally upregulates IDO1 expression.

GTP cyclohydrolase 1 (GCH1)/L-5-hydroxytryptophan (5-HTP) metabolic axis activates aryl hydrocarbon receptor (AHR) to upregulate indoleamine 2,3-dioxygenase 1 (IDO1). (A) Schematic diagram depicting the two main pathways of Trp metabolism. (B) Relative N-acetyl-5-hydroxytryptamine (NAS) and 5-HTP levels in BT549 cells expressing vector or GCH1 detected by liquid chromatography with tandem mass spectrometry. (C) Relative IDO1 transcription levels detected by quantitative reverse transcription PCR (qRT-PCR) analysis and IDO1 levels detected by western blot in BT549 cells treated with dimethyl sulfoxide (DMSO), tetrahydrobiopterin (BH4, 10 µM), 5-HTP (500 µM), serotonin (10 µM), NAS (100 µM), and melatonin (1 µM) for 24 hours. (D and E) Relative IDO1 transcription levels detected by qRT-PCR analysis and IDO1 levels detected by western blot in BT549 cells treated with 5-HTP at different concentrations for 24 hours (D) and with 5-HTP (500 µM) for different durations (E). (F) IDO1 levels detected by western blot in MDA-MB-453 cells expressing control or GCH1 short hairpin RNAs treated with 5-HTP (500 µM) for 24 hours. (G and H) Representative immunofluorescence images of AHR (G) and the cytoplasmic and nuclear protein fractions of the AHR protein (H) in BT549 cells treated with phosphate buffer saline (PBS) or 5-HTP (500 µM) for 24 hours. Scale bar=10 µm. (I) Relative IDO1 transcription levels detected by qRT-PCR analysis and IDO1 levels detected by western blot in BT549 cells treated with small interfering RNA targeting AHR (siAHR) for 48 hours followed by 5-HTP (500 µM) supplementation for 24 hours. (J) Chromatin immunoprecipitation followed by quantitative PCR analysis of BT549 cells treated with 5-HTP (1 mM) for 48 hours. (K) Analysis of luciferase activity in human embryonic kidney (HEK) 293 T cells. HEK-293 T cells concomitantly expressing an IDO1 promoter–luciferase reporter and AHR were treated with 5-HTP (500 µM) or PBS for 24 hours. (L) Analysis of luciferase activity in HEK-293 T cells. HEK-293 T cells concomitantly expressing an IDO1 promoter–luciferase reporter (ABS–WT) or IDO1 promoter mutation–luciferase reporter (ABS1-Del and ABS2-Del) and AHR were treated with 5-HTP (500 µM) for 24 hours. The data are presented as the mean±SD (B, C, D, E, I, J, K, and L): two-tailed unpaired Student’s t-test for B, C, D, E, I, J, K, and L; n=3 independent experiments (B, C, D, E, I, J, K, and L). *P<0.05; **P<0.01; ***P<0.001; n.s., not significant. 5-HTP, L-5-hydroxytryptophan; AADC, dopa decarboxylase; AANAT, aralkylamine N-acetyltransferase; ABS, AHR binding site; ASMT, acetylserotonin O-methyltransferase; BH4, tetrahydrobiopterin; Del, deletion; DMSO, dimethyl sulfoxide; GAPDH, glyceraldehyde-3-phosphate dehydrogenase; HDAC1,histonedeacetylase 1; Kyn, kynurenine; NAS, N-acetyl-5-hydroxytryptamine; PBS, phosphate buffer saline; shGCH1, short hairpin GCH1; siAHR, small interfering RNA targeting AHR; TPH, tryptophan hydroxylase; WT, wild type.
DAHP reverses GCH1-induced immunosuppression
To investigate whether the association between GCH1 and the immunosuppressive microenvironment was dependent on its enzymatic activity, we generated cell lines with stable expression of GCH1 mutations. GCH1 with A181H and M211I missense mutations has been reported to show no catalytic activity.24 Indeed, ELISA indicated that the synthesis of BH4 was not altered in BT549 cells expressing the A181H or M211I mutation (figure 6A). Consistent with these findings, the ectopic expression of GCH1 with A181H or M211I mutation did not induce IDO1 upregulation (figure 6B and online supplemental figure S6A) or elevate the AHR ratio of Nuc/Cyt (figure 6C). Compared with coculturing with control cells, Tregs cocultured with BT549 cells expressing the A181H or M211I mutation showed no significant difference in terms of apoptosis or the PD-1+ fraction (figure 6D). DAHP was considered to be a selective inhibitor of GCH1 enzymatic activity and was proposed to form a ternary complex with GCH1.25 The half-maximal effective concentration of DAHP on the catalytic activity of GCH1 was previously reported to range from 1.5 to 3 mM in cell culture experiments,26 which was substantially lower than the IC50 value we observed (online supplemental figure S6B,C). To evaluate whether DAHP could downregulate IDO1, we exposed cells to different concentrations of DAHP. As expected, DAHP downregulated IDO1 at a level as low as 0.5 mM 3 hours after supplementation (figure 6E and online supplemental figure S6D,E). Collectively, these results suggest that GCH1 inhibition by DAHP downregulates IDO1 expression.

2,4-Diamino-6-hydroxypyrimidine (DAHP) reverses the immune suppression induced by GTP cyclohydrolase 1 (GCH1). (A) Tetrahydrobiopterin (BH4) levels detected with ELISA in the supernatants of BT549 cells expressing vector (Vec), GCH1, or GCH1 mutations (A184H and M211I). (B and C) Indoleamine 2,3-dioxygenase 1 (IDO1) levels (B) and the cytoplasmic and nuclear protein fractions of the aryl hydrocarbon receptor (AHR) protein (C) detected by western blot in BT549 cells expressing Vec, GCH1, or GCH1 mutations (A184H and M211I). (D) Apoptosis and programmed cell death-1 (PD-1) levels of regulatory T cell (Tregs) cocultured with BT549 cells expressing Vec, GCH1, or GCH1 mutations (A184H and M211I) and analyzed by flow cytometry. (E) IDO1 levels in MDA-MB-453 cells treated with different concentrations of DAHP for 24 hours determined by western blot analysis. (F) Tumor volumes. Tumors were harvested from mice with orthotopic injection of a total of 3×10⁵ 4T1 cells overexpressing GCH1. Mice were treated with DAHP, an anti-PD-1 antibody, or the combination after the tumors were palpable (n=6 each). (G) Quantitative results of infiltration and apoptosis in Tregs and infiltration, apoptosis, and interferon-γ (IFN-γ) production in CD8+ T cells analyzed by flow cytometry. (H) Schematic diagram of GCH1 inducing immunosuppression in triple-negative breast cancer. GCH1 reprogrammed tryptophan (Trp) metabolism, increased the intracellular level of L-5-hydroxytryptophan (5-HTP), activated AHR, upregulated IDO1, and finally induced an immunosuppressive environment. DAHP could reverse the GCH1-induced immunosuppression and enhance the antitumor effect of PD-1 blockade immunotherapy. The data are presented as the mean±SD (A, D, F, and G): two-tailed unpaired Student’s t-test for A, D, and G; two-way analysis of variance (ANOVA) test for F; and n=3 independent experiments (A and D). *P<0.05; **P<0.01; ***P<0.001; n.s., not significant. DMSO, dimethyl sulfoxide; GAPDH, glyceraldehyde-3-phosphate dehydrogenase; HDAC1,histonedeacetylase 1; iso, isotype; Kyn, kynurenine.
Next, we investigated the effect of DAHP with an in vivo experiment. DAHP alone or in combination with an anti-PD-1 antibody was administered to mice bearing syngeneic breast tumors overexpressing GCH1 (online supplemental figure S6F). DAHP significantly inhibited tumor growth and enhanced the antitumor effect of the PD-1 blockade immunotherapy (figure 6F and online supplemental figure S6G). In addition, the combination treatment decreased Tregs infiltration, promoted Tregs apoptosis, augmented CD8+ T cell abundance, inhibited CD8+ T cells apoptosis, and boosted the IFN-γ production of CD8+ cells (figure 6G). Together, these data indicate that DAHP reverses the immunosuppression induced by GCH1 and synergizes with PD-1 blockade therapy.
Discussion
Our study shows that GCH1 overexpression reprograms Trp metabolism, increases the intracellular level of 5-HTP, activates AHR, upregulates IDO1, and finally induces an immunosuppressive TME. Moreover, we find that the inhibition of GCH1 with DAHP enhances tumor response to anti-PD-1 immunotherapy (figure 6H).
Partly due to Trp depletion and/or Kyn accumulation, IDO1 can induce the anergy of CD4+ T cells and the differentiation and activation of Tregs.27 28 In addition, IDO1 has been associated with the mechanism of resistance to immunotherapy; thus, multiple clinical trials have evaluated the combination of IDO1 inhibitors with immune checkpoint blockade (ICB).29 However, the phase III ECHO-301/KEYNOTE-252 trial did not demonstrate a prolonged progression-free survival for patients with melanoma with the combination treatment of epacadostat (an IDO1 inhibitor) and pembrolizumab (an anti-PD-1 monoclonal antibody).30 Alternative strategies are being explored to substitute for IDO1 inhibitors in the context of ICB, including the inhibition of other metabolic immune checkpoints involved in the Trp metabolism,14 depletion of Kyn by engineered kynureninase,29 and inhibition of AHR.31 Herein, our study identified GCH1 as an alternative immunometabolic target and DAHP as a suppressor of IDO1 expression. Crosstalk between BH4 synthesis and Trp metabolism has been reported previously,32 33 and concurrent activation of IDO1 and GCH1 was found in chronic inflammation,34 aging and aging-associated disorders,35 and hematopoietic stem cells.36 We hypothesize that the mechanisms behind the IDO1 upregulation by GCH1 overexpression are as follows. The first possibility is substrate competition, where, along with increased BH4 levels and enhanced TPH catalytic ability, GCH1 overexpression reduced Trp availability. Because over 95% of free Trp is degraded through IDO1,28 cancer cells upregulate IDO1 expression to obtain the substrate. This possibility was supported by the finding that NAS from the serotonin pathway could increase IDO1 catalytic activity.37 The second possibility is the maintenance of BH4 balance. Xanthurenic acid (XA) degraded from Kyn is a potent inhibitor of sepiapterin reductase, which is the terminal enzyme in the BH4 synthesis pathway.32 38 Therefore, XA accumulation induced by IDO1 upregulation could strengthen the brake on BH4 synthesis. These findings indicate GCH1 as a promising target for cancer therapy, especially in combination with immunotherapy. While GCH1 induced immunosuppression mainly in an IDO1-dependent manner, it is also worth noting that GCH1 expression, Kyn supplementation, and Trp deprivation can impact the expression of chemokines that direct effector T cell trafficking, including CXCL9, CXCL10, and CXCL11.39 Thus, GCH1-driven immunosuppression in the TME may also be driven, in part, by reduced recruitment of effector T cells, which is yet to be further investigated.
5-HTP is degraded from Trp by TPH and is further hydroxylated into serotonin.20 Our study, for the first time, identifies 5-HTP as a direct agonist of AHR in TNBC cells, although it had been reported to activate AHR in combination with aspartate aminotransferase.40 Emerging evidence suggests that the AHR activity is deeply associated with autoimmune disease and cancer, rendering it an actionable target for immunotherapy.19 Kyn-activated AHR transduced the tumor immune escape function by promoting Tregs differentiation,29 41 inducing CD8+ T cell exhaustion,31 and enhancing the transcription of immunosuppressive mediators.29 Interestingly, the upregulation of IDO1 by AHR has also been reported.42 43 Li et al44 showed that IDO1 expression in tolerogenic dendritic cells was maintained by an autocrine IDO1–Kyn/AHR–IDO1 loop. Here, we demonstrated that IDO1 upregulation was mediated by AHR activation via 5-HTP. However, the possibility that Kyn participated in the long-term modulation of IDO1 may not be ruled out, given that Kyn was enriched in the TME (figure 3).
Highly expressed by tumor-resident Tregs, PD-1 is recognized as a stimulatory receptor on the surface of Tregs, contrary to the well-accepted inhibitory impact of PD-1 on effector T cells.39 45 46 Tregs, activated in the presence of IDO1, upregulate FoxO3a and sequentially PD-147 and then create sustained suppression though the PD-1/PTEN feedback loop.27 Thus, PD-1 blockade could be expected to block the immunosuppression mediated by Tregs in addition to rejuvenating exhausted effector T cells. Indeed, we observed a mild inhibition of tumor growth after four cycles of a single anti-PD-1 antibody (online supplemental figure S6G). This enhanced antitumor effect of PD-1 blockade in our study may be attributable to the increase in PD-1+ immune cells in GCH1-overexpressing tumors, indicating that GCH1 overexpression may sensitize tumors to PD-1 blockade immunotherapy. Further studies are warranted to comprehensively capture the nature of PD-1 on Tregs.
Our study demonstrated that GCH1 overexpression resulted in the decreased apoptosis of Tregs and increased apoptosis of CD8+ T cells in vivo. This seemingly conflicting finding was supported by other studies that reported differential apoptosis alterations of T cells to Kyn based on the expression of FOXP3, cell subtypes, and the activation state.48–50 In our study, GCH1 induced PD-1 elevation in both Tregs and CD8+ T cells, while PD-1 exerted different impacts on the apoptosis of the two cell types.39 45 46 Additionally, the accumulation of Tregs could suppress the viability and function of CD8+ T cells.9 However, the precise mechanism underlying this phenomenon warrants further exploring.
In conclusion, our study reveals that GCH1 induces immunosuppression through a 5-HTP–AHR–IDO1-dependent mechanism and that metabolic intervention of this pathway in combination with immunotherapy might be a promising strategy for TNBC treatment.
Data availability statement
Data are available upon reasonable request.
Ethics statements
Ethics approval
All animal experiments were approved by the animal welfare committee of Shanghai Medical College at Fudan University. The use of human samples was approved by the FUSCC Ethics Committee.
References
Supplementary materials
Supplementary Data
This web only file has been produced by the BMJ Publishing Group from an electronic file supplied by the author(s) and has not been edited for content.
Footnotes
J-LW and S-YW contributed equally.
Contributors J-LW, S-YW, and YS-Y performed the experiments. J-LW and YX conducted the calculation and the statistical analysis. XJ, X-EX, XH, and D-QL provided crucial suggestions for experimental design. J-LW and S-YW wrote the manuscript. XJ and Y-ZJ revised and proofread the manuscript. Y-ZJ and Z-MS conceived the study and supervised the project.
Funding The authors have not declared a specific grant for this research from any funding agency in the public, commercial or not-for-profit sectors.
Competing interests None declared.
Provenance and peer review Not commissioned; externally peer reviewed.
Supplemental material This content has been supplied by the author(s). It has not been vetted by BMJ Publishing Group Limited (BMJ) and may not have been peer-reviewed. Any opinions or recommendations discussed are solely those of the author(s) and are not endorsed by BMJ. BMJ disclaims all liability and responsibility arising from any reliance placed on the content. Where the content includes any translated material, BMJ does not warrant the accuracy and reliability of the translations (including but not limited to local regulations, clinical guidelines, terminology, drug names and drug dosages), and is not responsible for any error and/or omissions arising from translation and adaptation or otherwise.