Article Text

Abstract
Background Although cancer immunotherapy is one of the most effective advanced-stage cancer therapies, no clinically approved cancer immunotherapies currently exist for colorectal cancer (CRC). Recently, programmed cell death protein 1 (PD-1) blockade has exhibited clinical benefits according to ongoing clinical trials. However, ongoing clinical trials for cancer immunotherapies are focused on PD-1 signaling inhibitors such as pembrolizumab, nivolumab, and atezolizumab. In this study, we focused on revealing the distinct response mechanism for the potent CD73 ectoenzyme selective inhibitor AB680 as a promising drug candidate that functions by blocking tumorigenic ATP/adenosine signaling in comparison to current therapeutics that block PD-1 to assess the value of this drug as a novel immunotherapy for CRC.
Methods To understand the distinct mechanism of AB680 in comparison to that of a neutralizing antibody against murine PD-1 used as a PD-1 blocker, we performed single-cell RNA sequencing of CD45+ tumor-infiltrating lymphocytes from untreated controls (n=3) and from AB680-treated (n=3) and PD-1-blockade-treated murine CRC in vivo models. We also used flow cytometry, Azoxymethane (AOM)/Dextran Sulfate Sodium (DSS) models, and in vitro functional assays to validate our new findings.
Results We initially observed that the expressions of Nt5e (a gene for CD73) and Entpd1 (a gene for CD39) affect T cell receptor (TCR) diversity and transcriptional profiles of T cells, thus suggesting their critical roles in T cell exhaustion within tumor. Importantly, PD-1 blockade significantly increased the TCR diversity of Entpd1-negative T cells and Pdcd1-positive T cells. Additionally, we determined that AB680 improved the anticancer functions of immunosuppressed cells such as Treg and exhausted T cells, while the PD-1 blocker quantitatively reduced Malat1high Treg and M2 macrophages. We also verified that PD-1 blockade induced Treg depletion in AOM/DSS CRC in vivo models, and we confirmed that AB680 treatment caused increased activation of CD8+ T cells using an in vitro T cell assay.
Conclusions The intratumoral immunomodulation of CD73 inhibition is distinct from PD-1 inhibition and exhibits potential as a novel anticancer immunotherapy for CRC, possibly through a synergistic effect when combined with PD-1 blocker treatments. This study may contribute to the ongoing development of anticancer immunotherapies targeting refractory CRC.
- tumor microenvironment
- drug therapy
- combination
- immunotherapy
- tumor biomarkers
Data availability statement
All data relevant to the study are included in the article or uploaded as supplementary information. The raw data are available from Sequence Read Archive (SRA) under accession number SUB8983993.
This is an open access article distributed in accordance with the Creative Commons Attribution Non Commercial (CC BY-NC 4.0) license, which permits others to distribute, remix, adapt, build upon this work non-commercially, and license their derivative works on different terms, provided the original work is properly cited, appropriate credit is given, any changes made indicated, and the use is non-commercial. See http://creativecommons.org/licenses/by-nc/4.0/.
Statistics from Altmetric.com
Background
Cancer immunotherapy has generated unparalleled and durable responses in regard to several cancers and is a pillar of advanced-stage cancer therapy.1 Colorectal cancer (CRC) is one of the most prominent causes of cancer-related deaths and exhibits high rates of morbidity and mortality.2 Recent clinical trials examining the use of immune checkpoint inhibitors (ICIs) are anticipated to improve survival rates in CRC.3 4 Nevertheless, no clinically approved ICI for the treatment of CRC exists currently. Ongoing clinical trials examining cancer immunotherapies are focused on programmed cell death protein 1 (PD-1) signaling inhibitors such as pembrolizumab, nivolumab, and atezolizumab.3 5–7 To extend the beneficial effects of cancer immunotherapy to more patients, ongoing efforts are aimed at developing new target-based cancer immunotherapeutic drugs. Adenosine signaling has emerged as a key metabolic pathway that regulates tumor immunity.8–10 CD73 (also known as Nt5e or ecto-5-nucleotidase) is a novel immune checkpoint enzyme that plays a key role in tumor growth and metastasis.11 This enzyme converts extracellular ATP to immunosuppressive adenosine in concert with CD39 (also known as Entpd1). Specifically, most tumors and their adjacent tissue microenvironment harness the CD73-mediated adenosynergic mechanism for immune surveillance escape. In this study, we investigated the distinct response mechanism of the potent and selective CD73 inhibitor AB680 that is currently undergoing phase I clinical trials.12 13 We revealed that AB680 and PD-1 blockers can differentially reshape intratumoral immune profiles according to the results of full-scale immune profiles generated using single-cell RNA sequencing (scRNA-seq). Based on recent technical progress, scRNA-seq has gained widespread use due to its ability to measure diversity or heterogeneous populations of immune cells.14 This approach exhibits excellent potential for identifying new cellular and molecular factors that function in response to ICIs. This is the first report to compare the results of scRNA-seq analysis of CD73-inhibitor and PD-1-blocker-treated tumors, and our results provide novel insights into the response mechanism activated by the CD73 inhibitor and indicate that this mechanism is distinct from that activated by the PD-1 blocker.
Materials and methods
Animal studies
For tumor-bearing models, BALB/c mice were purchased from Dooyeol Biotech (Daejeon, Republic of Korea). We used 6-week to 8-week-old male mice that were housed in a pathogen-free animal facility. All animal experiments were approved by the Institutional Animal Use and Care Committee of the Korea Research Institute of Chemical Technology and performed in accordance with the Guide for the Care and Use of Laboratory Animals published by the US National Institutes of Health. Tumor-bearing models were established by subcutaneous injection of 1×10⁶ CT26 cells (ATCC CRL-2638; ATCC, Manassas, Virginia, USA) into the right flanks of mice. Five days after inoculation, the mice were randomly separated into control, AB680-treated, and PD-1 blocker-treated groups. The CD73 inhibitor AB680 (20 mg/kg) (MedChemExpress, Monmouth Junction, New Jersey, USA) was administered from day 0 to day 15 after initiation via the intraperitoneal route. A PD-1 blocking antibody (6 mg/kg) (BioLegend, San Diego, California, USA) was administered intravenously every 3 days from day 0 onward into the tail vein. Tumors were measured every 3 days using calipers, and their volumes were calculated according to the following formula: volume (mm3)=(d2×D)/2, where d and D represent the shortest and longest tumor diameters, respectively.
AOM-DSS murine model
All animal experiments were approved by the Institutional Animal Use and Care Committee of the Korea Research Institute of Chemical Technology and performed in accordance with the Guide for the Care and Use of Laboratory Animals published by the US National Institutes of Health. A colitis-associated cancer model mouse was made by intraperitoneal injection of 10 mg/kg azoxymethane (AOM) (Sigma-Aldrich, St. Louis, Missouri, USA) and by oral administration of 2.5% Dextran Sulfate Sodium (DSS) with a molecular weight of 36,000–50,000 (MP Biomedicals, Santa Ana, California, USA). Five-week-old male C57BL/6J mice (Dooyeol Biotech) were acclimatized for the first week. At 6 weeks of age, mice were randomly divided into a control healthy group (n = 8), AOM/DSS group (n = 8) and AOM/DSS+AB680 or PD-1 blockade-treated group (n = 8). Seven days after AOM injection, 2.5% DSS was given in the drinking water over 7 days, followed by 14 days of regular water. Three cycles of DSS treatment were repeated. AB680 (10 mg/kg) (MedChemExpress) was administered from day 0 to day 21 after the end of third cycle of DSS treatment via the intraperitoneal route. A PD-1 blocking antibody (6 mg/kg) (BioLegend, San Diego, California, USA) was administered intravenously every 3 days from day 0 to 21 after the end of third cycle of DSS treatment in the tail vein. All mice were sacrificed at the end of the experiments, and the colon were obtained. Each colon was cut open longitudinally, and the normal tissue of the proximal colon, dysplasia tissue of the middle colon and cancer tissue of the distal colon were distinguished and assessed using a stereoscopic microscope. For flow cytometry analysis, we generated cell suspension of minced colon tissues using an Intestine Dissociation Kit (Miltenyi Biotec, Bergisch Gladbach, Germany) following the manufacturer’s protocol.
Cell sorting
The whole tumor was harvested from a sacrificed mouse and placed into 10 mL ice-cold Dulbecco’s phosphate-buffered saline (PBS) in a 50 mL falcon tube, and the CT26 tumor tissue (tumor size is ~3–4 mm) was then cut and minced thoroughly with a scalpel for 1–2 min into fragments that were approximately 0.5 mm and smaller. We generated cell suspensions of minced tumors using a Tumor Dissociation Kit (Miltenyi Biotec, Bergisch Gladbach, Germany) following the manufacturer’s protocol. Cell suspensions were stained with anti-mouse CD45 monoclonal antibodies (BD Biosciences, Franklin Lakes, New Jersey, USA), washed, and then resuspended in PBS containing Hank’s balanced salt solution supplemented with 4% fetal bovine serum (Gibco). CD45-positive tumor-infiltrating lymphocytes (TILs) were isolated to almost 100% purity using an Aria cytometer (BD Biosciences).
Human peripheral blood collection and in vitro T cell proliferation assay
Peripheral blood from healthy donors was obtained from the Red Cross Blood Center (Daejeon, Republic of Korea) according to established guidelines. The methods and protocols used in this study were approved by the Institutional Review Board of the Red Cross, and written informed consent for study participation was obtained from donors. Donor information was not disclosed. For the T cell proliferation assay, human T cells were isolated at >95% purity from peripheral blood based on negative selection using the RosetteSep Human T Cell Enrichment Cocktail (STEMCELL Technologies, Vancouver, Canada). Isolated human T cells were labeled with various concentrations of Carboxyfluorescein succinimidyl ester (CFSE) (Invitrogen, USA) at 37°C for 15 min. The labeled cells were collected, washed with fresh medium, counted, seeded in 96-well plates (1×10⁵ cells/well), and stimulated with magnetic beads coated with anti-CD3 and anti-CD28 antibodies (Invitrogen) at a 1:1 cell:bead ratio. After 96 hours, the cells were collected and stained with 7-AAD (20 min at room temperature). Samples of unlabelled and stimulated cells were stained with anti-CD45-APC mAb (BD Biosciences) and anti-IFNγ-PE mAb (BD Biosciences). Immediately after this step, the cells were analyzed using a flow cytometer (MACSQuant Analyzer VYB, Miltenyi Biotec).
Antibodies and flow cytometry
For the fluorescence-activated cell sorting (FACS) analysis, we stained cells with anti-mouse CD45, CD3, CD4, CD8, CD25, F4/80, CD11b, Ly6c, PD-1, CD73, CD39-monoclonal antibodies, 7ADD, and Annexin V (BD Biosciences) following the manufacturer’s protocol.
The cells were incubated on ice for 20 min, washed with chilled Annexin V binding buffer, and analyzed. Staining data were collected using a MACSQuant Analyzer VYB (Miltenyi Biotec, Bergisch Gladbach, Germany).
Single-cell library preparation and sequencing scRNA-seq libraries from three untreated control TILs (C1–C3), three CD73 inhibitor-treated TILs (KM1–KM3), and three PD-1 blockade-treated TILs (PD1-1–PD1-3) were prepared using Chromium Single Cell 3 Reagent Kits (v2) that were comprised of a Single Cell 3 Library & Gel Bead Kit v2 (PN-120237), a Single Cell 3 Chip Kit v2 (PN-120236), and an i7 Multiplex Kit (PN-120262) (10x Genomics) according to the Single Cell 3 Reagent Kits (v2) User Guide. Libraries were sequenced on an Illumina HiSeq X Ten System with 150 bp paired-end reads and one sample per lane.
Preprocessing of scRNA-seq data
The sequencing data produced by droplet-based scRNA-seq15 were demultiplexed and converted to FASTQ format using Illumina bcl2fastq software. The Cell Ranger Single-Cell Software Suite (V.3.0.2) was used to perform sample demultiplexing, barcode processing and single-cell 3 gene counting. The cDNA insert was aligned with the GRCh38 reference genome. Further analyses, including quality control, identification of highly variable genes, dimensionality reduction, standard unsupervised clustering algorithms, and the discovery of differentially expressed genes (DEGs), were performed using the Seurat package in R (V.3.1.4).16 We visually inspected the distributions and determined the thresholds for all samples as described by Plasschaert et al.17 We discarded low-quality cells with log10 (total feature count)≤2.5 or that exhibited a proportion of mitochondrial gene expression ≥20. We also used Scrublet18 to exclude cells that were predicted to be doublets.
Clustering analysis
We used the FindVariableFeatures in the Seurat package to identify highly variable genes and then performed principal component analysis with the top 2000 variable genes. Clusters were partitioned with FindClusters in the Seurat package, and cells were projected into a two-dimensional space with uniform manifold approximation and projection (UMAP). DEGs in each cluster were identified using FindMarkers in the Seurat package. We also used the SingleR19 method.
DEG analysis of pseudo-bulk profiles from scRNA-seq
To exclude potential bias due to the different cell counts of each individual in a given cluster or a group of clusters, we calculated the sum of the UMI counts across all cells from each sample to generate pseudo-bulk profiles. DEGs were identified using the DESeq2 package in R (V.1.26.0)20 based on the average expression level (mean CPM) in each individual. DEGs with a p value <0.05 and |log2(FC: fold change)|>1 were used for Gene Ontology (GO) functional enrichment analysis with the Database for Annotation, Visualization and Integrated Discovery (DAVID) website.21 22
Trajectory analysis
Single-cell trajectory analysis was performed using the Monocle2 package (V.2.14.0).23 To chronically sort cells by pseudo-time using the orderCells in Monocle2, we selected the top 1000 DEGs identified by the FindAllMarkers in the Seurat package. To visualize and interpret the results using the plot_cell_trajectory in Monocle2, the dimension was reduced using the DDRTree method.
Cellular interaction analysis
Cell–cell interaction analysis was conducted using CellPhoneDB,24 a public repository of interactions between ligands and receptors. We used the CellphoneDB Python package (V.2.1.2) for the analysis, and the single-cell expression data of hematopoietic stem cells (HSCs), T cells, and myeloid cells from all samples were used as the input.
Kaplan-Meier analysis
We used Gene Expression Profiling Interactive Analysis (GEPIA),25 which is an interactive web server for analysis of RNA sequencing data including 9736 tumors and 8587 normal samples from The Cancer Genome Atlas (TCGA) and the Genotype-Tissue Expression (GTEx) project, to perform survival analysis based on gene expression levels. We generated Kaplan-Meier plots to assess prognostic values of NT5E, ENTPD1 and PDCD1 expression in patients with colon adenocarcinoma. The patients were classified into high and low expression groups using the median expression of genes as the cut-off value.
Statistical analysis
All statistical tests were performed on directed pairwise comparisons. Unpaired t-tests were performed to analyze differences between two groups. Significance is displayed as *p<0.05; **p<0.01; ***p<0.001. Statistical analyses were done using Prism (GraphPad, La Jolla, California, USA).
Results
scRNA-seq of AB680-treated, PD-1 blocking antibody-treated, and untreated TILs to characterize cellular composition and lineage
To understand the mode of action of the potent and selective CD73 inhibitor AB680, we used CT26, an ICI-responsive CRC-cell-line-bearing in vivo mouse model, to investigate whole-scale cellular diversity and transcriptional profile changes in TILs through the use of scRNA-seq (figure 1A). To depict the baseline cellular composition, lineage, and interaction of TILs from tumors with or without AB680 or PD-1 blocker treatment, we sorted and profiled CD45+ TILs from each tumors of the control (n=3), AB680 (n=3) and PD-1 blocker groups (n=3) using droplet-based scRNA-seq (figure 1A). We also performed flow cytometry analysis of TILs to confirm our scRNA-seq results (figure 1A). Notably, AB680 and the PD-1 blocker both exhibited potent tumor growth inhibition activity compared with that of the control (figure 1B,C). We also demonstrated that combined treatment utilizing AB680 and the PD-1 blocker could additively reduce tumor growth in comparison to that achieved using each individual treatment (figure 1B,C). As a result, a total of 75,373 cells were retained, and these included 24,784 from control, 29,463 from the AB680-treated group, and 21,126 from the PD-1 blocker-treated group (online supplemental table 1). Subsequently, we performed unsupervised clustering analysis and used UMAP26 to visualize the cells and cellular proportions according to cell type (figure 1D). Notably, myeloid cells were more abundant than were T cells, B cells, and natural killer (NK) cells (figure 1D,E). We classified our clusters into five broad cellular lineages (myeloid cells, granulocytes, T cells, NK cells, and B cells) by combining the results of the singleR package and the expression profiles of cell type-specific marker genes (figure 1D,F). Most cellular lineages were not significantly different between the control and treated groups, with the exception of myeloid cells (figure 1G).
Supplemental material

Differential cellular composition and lineage of AB680 treated, and programmed cell death protein 1 (PD-1) blocker treated and untreated tumor-infiltrating lymphocytes (TILs). (A) Workflow of the study design. Single-cell RNA sequencing (scRNA-seq) was conducted with CD45+ TIL cells extracted from three untreated controls, AB680-treated and PD-1 blocking antibody-treated tumors. Eight tumors per group were used for fluorescence-activated cell sorting (FACS) analysis. (B) Five days after inoculation of CT26 cells (1×10⁶ cells/mouse), AB680 (20 mg/kg) or the PD-1 blocking antibody (20 mg/kg) was administered from day 0 to day 15 after initiation of treatment via the intraperitoneal route, as described in the Materials and methods section (n=9 mice). Tumor sizes were measured at day 3. (C) At day 15, mice were sacrificed and the extracted tumors were weighted. (D) Uniform manifold approximation and projection (UMAP) plot for clusters including all samples. (E) Proportion of clusters in each sample. (F) Heatmap representing cluster-specific gene expressions. The yellow color represents high expression, and purple represents low expression. (G) Proportions of clusters among the controls, AB680-treated, and PD-1 blocker treated TILs. The error bar denotes SEM (t-test, *p<0.05, **p<0.05, ***p=0.001). NS, non-significant.
Reclustering analysis of T cells revealed differential cellular proportions among AB680 and PD-1 blocker-treated and control TILs: depletion of intratumoral MALAT1+ Treg cells and CD4+ exhausted T cells was observed in PD-1 blocker treated TILs, but not in AB680 blocker-treated TILs.
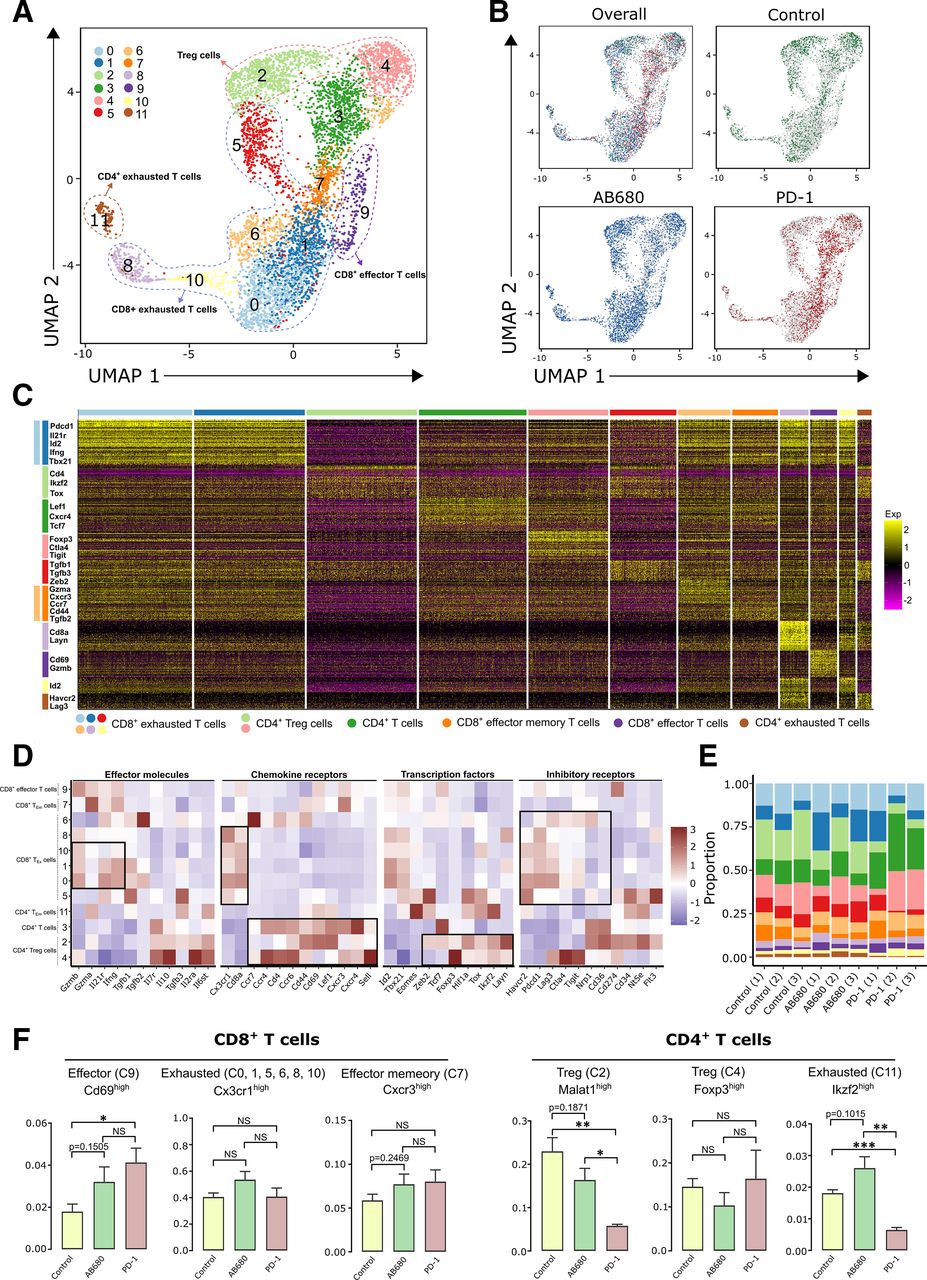
Although the total numbers of T cells were not significantly different among the control, AB680, and PD-1 blocker-treated groups (figure 1H), reclustering analyses of T cells identified 12 T cell subclusters that included six CD8+ exhausted (CD8+ Tex) T cells (C0, C1, C5, C6, C8, and C10), one CD8+ effector T cell (C9), one CD8+ effector memory (CD8+ Tem) T cell (C7), two CD4+ regulatory T (Treg) cells (C2, C4), one CD4+ helper T cell (C3), and one CD4+ Tex (C11) that exhibited differential distribution (figure 2A,B). We identified subclusters of T cells possessing the expression pattern of major T-cell lineage markers (figure 2C). Specifically, we also identified the expression patterns of important genes that can be used for identifying T cell subclusters (figure 2D). Importantly, the majority of CD8+ T cells (six subclusters: C0, C1, C6, C7, C8, and C10) from all eight clusters of CD8+ T cells exhibited exhausted phenotypes that expressed high levels of Havcr2, Lag3, Ctla4, and Tigit (figure 2D). High expression of effector molecules such as Gzmb, Ifng, and Cx3cr1 in exhausted CD8+ T cells (Tex) was also noted (figure 2D). Although the diversity of the T-cell subclusters was similar among the controls and the two treated groups (figure 2E), we observed that CD8+ effector T cells (C9) were significantly upregulated in the PD-1 blocker-treated group compared with that in the control group. The AB680-treated CD8+ effector T cells (C9) were also similarly increased; however, the increase was not significant (figure 2F). No significant proportional changes were observed among the controls and the two treated groups in regard to Cx3cr1high CD8+ Tex cells and Cxcr3high CD8+ effector memory T cells (C7) (figure 2F). Regarding proportional changes in CD4+ T cells, we observed that one (C2) of the two Treg subclusters and the Ikzf2high CD4+ Tex cells (C11) were significantly reduced in the PD-1 blocker-treated group compared with that in the control; however, this was not observed in the AB680-treated group (figure 2F). Lastly, we analyzed proportions of CD8+ T cells to CD4+ T cells from TILs of CT26 tumor-bearing mice through FACS analysis to confirm the result of those proportions from our scRNA-seq results (online supplemental figure 1a-c). Although proportions of CD8+ T cells to CD4+ T cells did not show significant difference among the control, AB680, and PD-1 blocker-treated groups from our scRNA-seq results (online supplemental figure 1a), AB680 treatment showed a trend to increase ratio of CD8+ T cells to CD4+ T cells compared with the control group. Thus, we evaluate the effect of AB680 on proportions of CD8+ T cells to CD4+ T cells through FACS analysis of TILs from eight mice per control, AB680, and PD-1 blocker-treated groups (online supplemental figure 1b,c). As shown in online supplemental figure 1c, ratios of CD8+ T cells to CD4+ T cells were significantly increased by treatment of AB680, and PD-1 blocker compared with control.

Distinct T cell subclusters of AB680 treated, and programmed cell death protein 1 (PD-1) blocker treated and untreated tumor-infiltrating lymphocytes (TILs). (A) Uniform manifold approximation and projection (UMAP) plot for T cell subclusters. (B) UMAP plots for the group-specific distribution of T cells. (C) Heatmap representing cluster-specific gene expressions. (D) Heatmap for the expression profile of marker genes (z-score of log2(CPM+1)) used to identify the cell type of each subcluster and to determine the degree of depletion. Red and blue colors denote upregulated and downregulated genes, respectively. (E) Proportion of clusters in each sample. (F) Box-and-whisker plot comparing the proportion of cells within a T cell subcluster effector CD8+ T cell (C9) between the controls and the PD-2 blocker (t-test, *p < 0.05), within MALAT1high Treg T cells (C2) between the controls and the PD-2 blocker (t-test, **p = 0.01), and within CD4+ exhausted T cells (C11) between the controls and PD-2 blocker (t-test, ***p = 0.001). NS, non-significant.
PD-1 blockade resulted in increased T-cell receptor (TCR) diversity of Entpd1-negative T cells
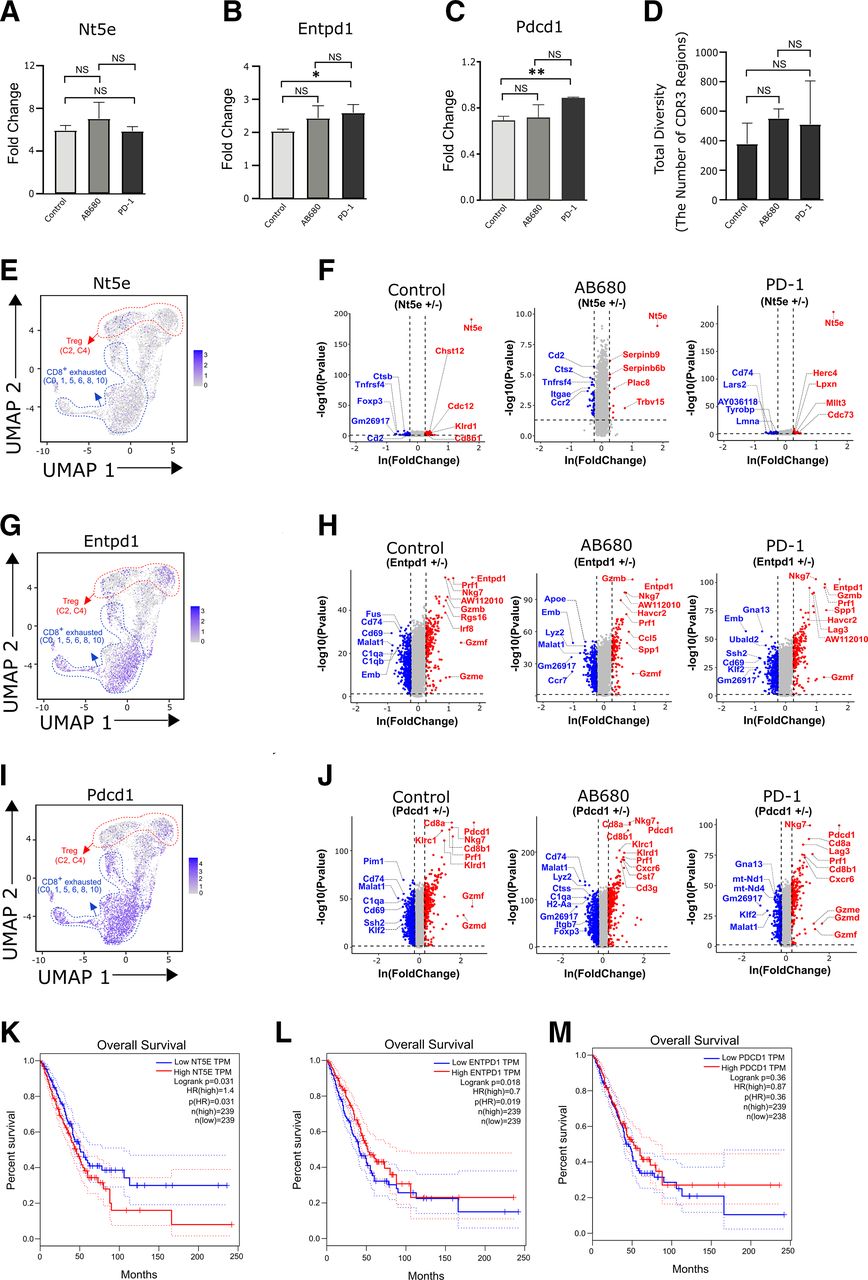
The ectoenzymes CD73 and CD39 increase the concentration of extracellular adenosine in the microenvironment in proximity to these enzyme-expressing cells.11 27 28 Thus, it is important to analyze the cellular and molecular differences between Nt5e-positive and Entpd1-positive and Nt5e-negative and Entpd1-negative cells. Increased TCR diversities as assessed by the number of unique CDR3 regions of each individual strongly suggest that T cells can react to more diverse tumor antigens. According to a previous report,29 antigen-specific clonal activation increased the TCR diversity of intratumoral T cells. Based on this, we initially analyzed TCR clonal diversity among Nt5e±, Entpd1±, and Pdcd1± T cells. We observed that T cells expressing the Nt5e gene (a gene for CD73) exhibited significantly reduced TCR diversity compared with that of Nt5e-negative T cells (online supplemental figure 2a). The fold change of Nt5e negative T cells to Nt5e positive T cells was approximately 6 (figure 3A). Similarly, Entpd1 (a gene for CD39) negative T cells had approximately twice as much TCR diversity as Entpd1-positive T cells (online supplemental figure 2b). However, Pdcd1 (a gene for PD-1 protein)-negative and positive T cells did not show significant differences in TCR diversities (online supplemental figure 2c). Importantly, there was a significant effect in TCR diversities by treatment of PD-1 blockade (figure 3B,C, online supplemental figure 2b). PD-1 blocker significantly increased TCR diversity fold change of Entpd1-negative T cells to Entpd1-positive T cells (figure 3B) by increasing TCR diversity of PD-1 blockade-treated Entpd1-negative T cells compared with untreated Entpd1-negative T cells (online supplemental figure 2b). Conversely, PD-1 blocker significantly decreased TCR diversity fold change of Pdcd1-negative T cells to Pdcd1-positive T cells (figure 3C) by increasing TCR diversity of Pdcd1-positive T cells (online supplemental figure 2c). However, there was no significant difference in the TCR diversity between the control and drug-treated total T cells (figure 3D). We also analyzed the percentages of Nt5e, Entpd1, and Pdcd1-positive T cells compared with total T cells (online supplemental figure 2d). 9.93±1.82, 31.1±6.04 and 54.3±6.98 percentage (%) of T cells were Nt5e, Entpd1, and Pdcd1-positive T cells in tumors, respectively (online supplemental figure 2d). Taken together, PD-1 blockade significantly increased TCR diversity of Entpd1-negative T cells and Pdcd1-positive T cells suggesting improved antigen-specific clonal activation.

T cell receptor (TCR) diversity and distinct transcriptional profiles related to the expression of NT5E, ENTPD1, and PDCD1 in T cells. Fold changes of TCR diversity of (A) Nt5e-negative to Nt5e-positive T cells. (B) Entpd1-negative to Entpd1-positive T cells, and (C) Pdcd1-negative to Pdcd1-positive T cell in the control, AB680-treated and programmed cell death protein 1 (PD-1) blockade-treated intratumoral T cells.(D) TCR diversity among the control, AB680-treated, and PD-1 blocker-treated intratumoral T cells. (E) Uniform manifold approximation and projection (UMAP) plot for the expression of Nt5e in T cells. (F) Volcano plots for the differentially expressed genes (DEGs) of Nt5e-positive T cells compared with negative T cells. Red and blue dots denote upregulated and downregulated DEGs, respectively, with a p value <0.05 and a |ln(FC: fold change)|>0.25. (G) UMAP plot for the expression of Entpd1 in T cells. (H) Volcano plots for the DEGs of Entpd1-positive T cells compared with the negative T cells. Red and blue dots denote upregulated and downregulated DEGs, respectively, with a p value <0.05 and a |ln(FC: fold change)|>0.25. (I) UMAP plot for the expression of Pdcd1 in T cells. (J) Volcano plots for the DEGs of Pdcd1-positive T cells compared with negative T cells. Red and blue dots denote upregulated and downregulated DEGs, respectively, with a p value <0.05 and a |ln(FC: fold change)|>0.25. (K) Kaplan-Meier plot for overall survival rates between Nt5e high and low expression colorectal cancer (CRC) patients. (L) Kaplan-Meier plot for overall survival rates between Entpd1 high and low expression CRC patients. (M) Kaplan-Meier plot for overall survival rates between Pdcd1 high and low expression CRC patients. NS, non-significant.
Distinct transcriptional profiles related to the expression of Nt5e, Entpd1, and Pdcd1 in T cells
To understand the potential biological roles of adenosine and PD-1 signaling on T cells, we analyzed the difference in full-scale transcription between negative and positive Nt5e, Entpd1, and Pdcd1 expression in T cells. As shown in online supplemental figure 2d, Nt5e was only expressed in 9.93±1.82% of intratumoral T cells. It was mainly expressed in Treg and CD8+ exhausted T cells (figure 3E). To understand the characteristic transcriptional profile of Nt5e-positive T cells, we performed DEG analysis of Nt5e-negative T cells and Nt5e-positive T cells (figure 3F). We observed significantly upregulated levels of Cdc12, Klrd1, and Cd86 in Nt5e-positive T cells compared with those in Nt5e-negative T cells (figure 3F). AB680 and PD-1 treatments resulted in distinct transcriptional changes in Nt5e-positive T cells (figure 3F). Enptd1 was also expressed primarily in Tregs (C2, C4) and exhausted T cells (figure 3G). Entpd1 was expressed in 31.1%±6.04% of intratumoral T cells (figure 3D). A large proportion of genes were differentially regulated in Entpd1-positive T cells compared with levels in Entpd1-negative T cells (figure 3H). Importantly, AB680 treatment significantly increased the expression of Gzmb, Gzmd, Gzmf, Prf1, and Irf8 in Entpd1-positive T cells compared with that in the control (figure 3H). Pdcd1 was primarily expressed in Tregs and CD8+ exhausted T cells (figure 3I), and Pdcd1-positive T cells exhibited differential expression compared with that observed in Pdcd1-negative T cells (figure 3J). AB680 treatment and PD-1 blockade regulated gene expression in Pdcd1-positive T cells through different pathways (figure 3J). Differential transcription of Nt5e-negative T cells and Nt5e-positive T cells was correlated with different biological and signaling pathways (online supplemental figure 2e). Hypoxia and the glycolysis pathway were significantly upregulated in Nt5e-positive T cells compared with levels in Nt5e-negative T cells (online supplemental figure 2e). Conversely, TNFα signaling via the NF-κB pathway was downregulated in Nt5e-positive T cells compared with Nt5e-negative T cells (online supplemental figure 2e). Importantly, TNFα signaling via the NF-κB pathway was also downregulated in both Entpd1-positive T cells and Pdcd1-positive T cells (online supplemental figure 2f,g). Moreover, glycolysis and hypoxia pathways were also significantly upregulated in Entpd1-positive T cells and Pdcd1-positive T cells (online supplemental figure 2f,g). However, differentially regulated pathways such as the complement pathway (only by Entpd1-positive and Pdcd1-positive T cells and not by Nt5e-positive T cells) and the oxidative phosphorylation pathway (by Pdcd1-positive T cells) by Nt5e-positive, Entpd1-positive, and Pdcd1-positive T cells were also observed (online supplemental figure 2e-g). We also show the frequencies in the form of violin plots for NT5e, Entpd1, and Pdcd1 to demonstrate the proportion of Nt5e, Entpd1, and Pdcd1-postive cells in all treatment groups (online supplemental figure 3). As shown in figure 3K, patients with CRC possessing low expression of Nt5e exhibited significantly increased overall survival rates compared with those of patients with CRC possessing high expression of Nt5e. However, the expression level of Entpd1 did not affect the overall survival of patients with CRC (figure 3I). Similarly, low expression of Pdcd1 did not alter the overall long-term survival rates of patients with CRC (figure 3M).
Distinct transcriptional profiles associated with the immune-exhausted phenotype were observed in AB680-treated and PD-1 blocker-treated intratumoral Treg cells
We identified two distinct Treg populations (C2 and C4). The proportion of total Tregs (C2+C4) was not significantly different among the groups (online supplemental figure 4a). However, AB680 and PD-1 blocker treatments triggered transcriptional changes in control Treg cells (online supplemental figure 4b). Specifically, two Treg populations (C2 and C4) expressed high levels of Foxp3, which is a well-known marker of Tregs30 (figure 4A). However, DEG analysis of the two Treg populations revealed significantly upregulated expression of Malat1 in the C2 cluster (figure 4B), and this was previously reported to be associated with Treg differentiation from the Th17/Treg precursor.31 We observed that Foxp3 expression was significantly higher than that in the other T cell populations (figure 4A,C). These two Tregs possessed distinct transcriptional profiles in regard to genes such as Zeb1, Ikzf2, Il2ra, Ctla4, and Il-10 (figures 2D, 4B,C). We observed that treatment with AB680 and PD-1 blockers altered gene expression in both of the Treg populations (figure 4B,C). Importantly, AB680 treatment significantly upregulated the effector molecule genes Gzma, Gzmd, Gzme, and Nkg7 in Tregs (C2), and PD-1 blocker treatment did not upregulate these genes (figure 4D). In regard to the cytokine production profiles, Ab680 treatment resulted in increased Ifng (figure 4d). Furthermore, AB680 treatment downregulated the expression levels of Entpd1, Havcr2, and Zeb1 (figure 4d) and the PD-1 blocker significantly upregulated Treg markers such as Malt1, Cd274, and Ikzf2 in Tregs (C2) (figure 4B-D). Nevertheless, AB680 did not cause changes in the proportions of different Tregs (figure 4F), and AB680 treatment decreased the expression of immune-exhausted phenotype-associated genes in intratumoral Treg cells (figure 4D) to a greater extent than did PD-1 blockade. To confirm our findings, we analyzed Treg populations within tumors using flow cytometry (figure 4E). As presented in figure 3E, we confirmed that Foxp3+ Treg cells were significantly reduced in PD-1 blocker-treated tumors. Although AB680 treatment significantly downregulated the proportion of Foxp3+ Treg cells, its effect on Treg proportion was significantly weaker than was that induced by PD-1 blockade (figure 4E,F). Furthermore, we confirmed a significantly upregulated expression of interferon-γ (IFNγ) and granzyme B (GzB) in Treg cells in the AB680-treated group compared with levels in the control group according to flow cytometry analysis, and this was not observed after treatment with the PD-1 blocker (figure 4F).

Treg and CD4+ exhausted T cell subclusters. (A) Uniform manifold approximation and projection (UMAP) plot for the expression of the marker gene, Foxp3, which characterizes Treg cell subclusters. (B, C) Volcano plots for the differentially expressed genes (DEGs) of Treg cell subclusters 2 and 4, compared with the other clusters. Red and blue dots denote upregulated and downregulated DEGs, respectively, with a p value <0.05 and a |ln(FC: fold change)|>0.25. (D) Heatmap for the expression profile of marker genes (z-score of log2(CPM+1)) used to identify the cell type of Treg subcluster (C2) and to determine the degree of changes in the gene expression caused by the AB680 and programmed cell death protein 1 (PD-1) blocker treatment. Red and blue colors denote upregulated and downregulated genes, respectively. (E) Representative dot plots show the percentage (%) of CD25+, Foxp3+, and Treg cells from CD4+ T cells extracted from the control, AB680-treated, and the PD-1 blocker-treated tumor-infiltrating lymphocytes (TILs) through fluorescence-activated cell sorting (FACS) analysis. (F) Graphical representation of the percentages (%) of Treg cells from CD4+ T cells extracted from eight different control TILs, AB680-treated TILs, and PD-1 blocker-treated TILs. Short horizontal lines indicate the means (t-test, NS, non-significant; *p<0.05; **p<0.01). (G) UMAP plot for the expression of marker genes, IKZF2 and TOX, to characterize exhausted T-cell subclusters. (H) Heatmap for the expressions of marker genes used to identify the cell type of each subcluster. Red and blue colors denote upregulated and downregulated genes, respectively, which were used to determine the degree of changes by the AB680 and PD-1 blocker treatment. (I) Volcano plots for DEGs of exhausted CD4+ T cell subcluster (C11) compared with those of the other clusters. NS, non-significant.
Distinct transcriptional profiles associated with the immune-exhausted phenotype were observed in AB680-treated and PD-1 blocker-treated intratumoral CD4+ and CD8+ Tex cells
As shown in figure 4G, one CD4+ Tex cell population (C11) and six CD8+ Tex cell populations (C0, C1, C5, C6, C8, and C10) expressed high levels of the transcription factors Ikzf2 and Tox, both of which are well-known genes associated with T cell exhaustion.32 33 Additionally, DEG analysis of the CD4+ Tex population revealed the presence of significantly upregulated inhibitory molecules such as Ikzf2, Lag3, Havcr2, and Entpd1 in the C11 cluster (figure 4H,I).34 Our volcano blot (figure 4I) revealed that gene expression was significantly altered in response to AB680 treatment and PD-1 blockade in CD4+ Tex cells (C11). Specifically, significant upregulation of Gzma and Gzmd was observed in the AB680-treated CD4+ Tex cells (C11) and not in cells treated with the PD-1 blocker (figure 4G,I). In our study, we observed that Cx3cr1 was highly expressed in six CD8+ Tex cell populations (C0, C1, C5, C6, C8, and C10) (figure 5A). The six CD8+ Tex cell populations exhibited high expression of Nt5e, Pdcd1, Foxp3, Ikzf2, Havcr2, and Entpd1, all of which are known for their immunosuppressive roles (figure 2D).34–36 AB680 treatment and PD-1 blockade reduced the expression levels of Pdcd1, Foxp3, and Entpd1 compared with those of the control CD8+ Tex cells (figure 5B). Nevertheless, we found that AB680-treated CD8+ Tex cells upregulated the expression of Ifng, while the PD-1 blocker did not (figure 5B). Furthermore, AB680-treated CD8+ Tex cells exhibited decreased expression of Lag3 and Havcr2, while the PD-1 blocker-treated cells did not (figure 5B). To confirm our results, we analyzed the expression pattern of CX3CR1 in CD8+ T cells using flow cytometry (figure 5C). Notably, inhibitory molecules such as LAG3 and HACR2 (also known as TIM3) were highly expressed in CX3CR1+ CD8+ TILs derived from control mice (figure 5C). Furthermore, we confirmed significant upregulation of GzB and IFNγ in AB680-treated CD8+ Tex cells through the use of flow cytometry (figure 5D). These results are consistent with our findings that were obtained using scRNA-seq (figure 5B).
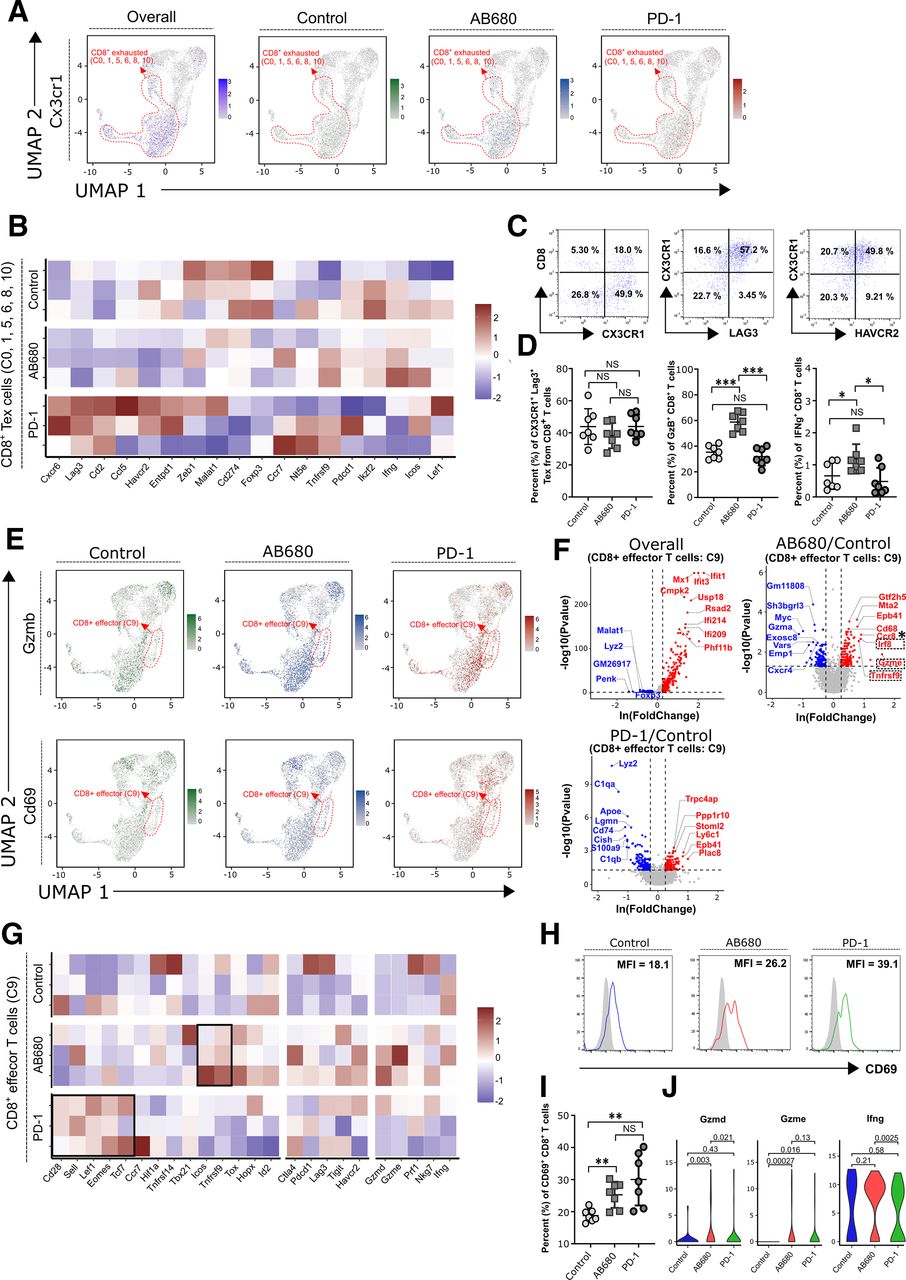
CD8+ exhausted T cell and effector CD8+ T cell subclusters. (A) Uniform manifold approximation and projection (UMAP) plot for the expression of the marker gene, CX3CR1, characterizing CD8+-exhausted T cell subclusters. (B) Heatmap for the expression profile of marker genes (z-score of log2(CPM+1)) used to identify the cell type of CD8+-exhausted T cells (C0, 1, 5, 6, 8, 10) and to determine the degree of changes in gene expression by the AB680 and programmed cell death protein 1 (PD-1) blocker treatment. Red and blue colors denote upregulated and downregulated genes, respectively. (C) Representative dot plots show the percentage (%) of CX3CR1+ CD8+ T cells from T cells and their expressions of Lag3 and Havcr2 extracted from control tumor-infiltrating lymphocytes (TILs) through fluorescence-activated cell sorting (FACS) analysis. (D) Graphical representation of the percentages (%) of CX3CR1+ Lag+ CD8+ T cells, GzB+ CX3CR1+ CD8+ T cells, and IFNγ+ CX3CR1+ CD8+ T cells extracted from control TILs, AB680-treated TILs, and PD-1 blocker-treated TILs. Short horizontal lines indicate the means (t-test, NS, non-significant; *p<0.05; ***p<0.001). (E) UMAP plot for the expression of marker genes, Gzmb and CD69, characterizing effector CD8+ T cell subclusters. (F) Volcano plots for the DEGs of the effector CD8+ T cell subcluster (C9) compared with other clusters. Red and blue dots denote upregulated and downregulated DEGs, respectively, with a p value <0.05 and a |ln(FC: fold change)|>0.25. (G) Heatmap for the expression profiles of marker genes (z-score of log2(CPM+1)) used to identify the cell type of the effector CD8+ T cell subcluster (C9) and to determine the degree of changes in the AB680 and PD-1 blocker treatments. Red and blue colors denote upregulated and downregulated genes, respectively. (H) Representative histograms show the Mean fluorescence of intensity(MFI) for CD69 expressed in CD8+ T cells extracted from the control, AB680-treated, and PD-1 blocker treated TILs through FACS analysis. (I) Graphical representation of the percentages (%) of CD69+ CD8+ T cells extracted from control TILs, AB680-treated TILs and PD-1 blocker-treated TILs. Short horizontal lines indicate the means (t-test, NS, non-significant; *p<0.05; **p<0.01).
AB680 triggered the effector function of exhausted CD8+ T cells in a limited manner, while PD-1 blockade did not affect this process
As shown in figure 2D, one CD8+ effector T cell population (C9) was identified that possessed relatively high expression levels of Gzmb, Gzma, Ifng, and CD69 and low expression levels of Tox, Ikzf2, Foxp3, and Havcr2. There was no significant proportional change in the C9 cluster of AB680-treated TILs; however, the PD-1 blocker significantly increased the proportion of C9 clusters (figure 2F). There was a transcriptional change in the regulation of gene expression, including the expression of Gzme, Irf8, TNFRSF9 (also known as 41-BB), and Icos, after AB680 exposure (figure 5F,G). Importantly, this transcriptional change that was triggered by AB680 was distinct from that triggered by the PD-1 blocker (figure 5F). Furthermore, we analyzed the proportion of CD69+ CD8+ T cells using flow cytometry (figure 5H,I). Notably, we observed that CD69, a marker protein for TCR signaling-mediated activation of T cells,37 was increased in AB680-treated and PD-1 blocker-treated CD8+ T cells, thus highlighting their role to at least partially activate exhausted CD8+ T cells. Importantly, we observed a relatively low level of CD69 expression in AB680-treated CD8+ effector T cell population (C9) compared with that in the PD-1 blocker-treated group (figure 5H,I). Interestingly, AB680 treatment triggered the expression of Tox, a process that is well known to be indicative of T cell exhaustion,32 33 in the CD8+ effector T cell population (C9). This suggested that AB680 treatment, and not PD-1 blockade, triggered the effector function of exhausted CD8+ T cells. However, we observed that the expression of Gzmd and Gzme was significantly increased in AB680 blocker-treated effector CD8+ T cells and that only Gzme was significantly increased in PD-1 blocker-treated effector CD8+ T cells, thus suggesting a distinct immune activation mechanism of AB680 (figure 5J).
Partial depletion of M2 macrophages was observed in PD-1 blocker-treated TILs, and enrichment of inflammatory M1 macrophages was observed in AB680-treated TILs according to a reclustering analysis of the myeloid lineage cells
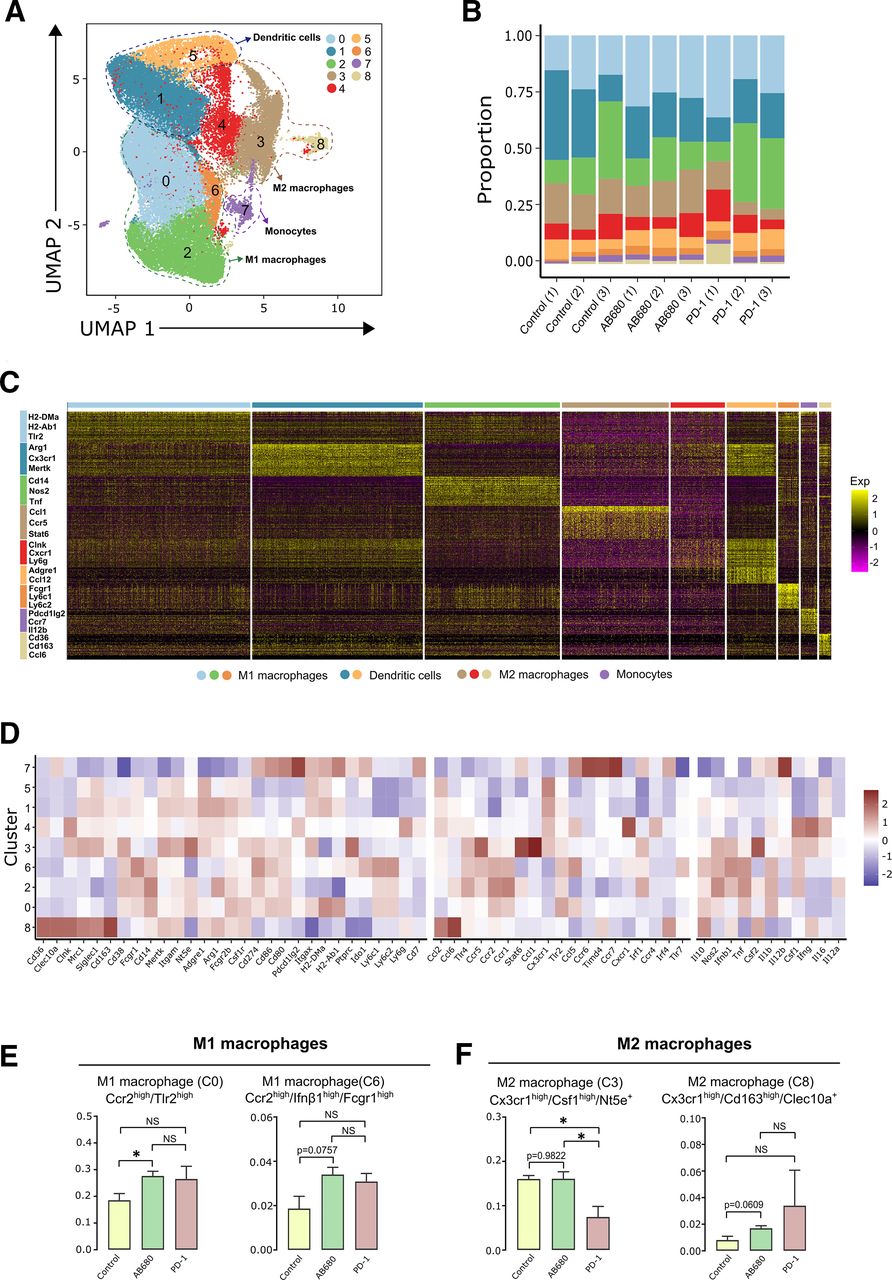
To understand the changes in the cellular composition, lineage, and interaction of myeloid cells from tumors in the presence or absence of AB680 and PD-1 blocker treatment, reclustering analysis of the myeloid cells was used to identify nine myeloid cell subclusters that included three M1 macrophages (C0, C2, and C6), two monocytes (C7 and C9), three M2 macrophages (C3, C4, and C8), and two dendritic cells (DCs) (C1 and C5) (figure 6A). We identified subclusters of myeloid cells possessing an expression pattern of major myeloid cell lineage markers with a similar diversity of subclusters in each tumor (figure 6B,C, online supplemental figure 5). Based on our trajectory analysis, three different directions of cellular differentiation were defined (online supplemental figure 6a). One direction was from monocytes (C7, C9) to M1 macrophages (C0, C2, C6) and the other was from monocytes (C7, C9) to M2 macrophages (C3, C4, C8) and to DCs (C1, C5) (figure 6A). We also determined the expression patterns of important genes that can be used for the identification of myeloid cell subclusters (figure 6D). Specifically, we determined that Cx3cr1 was limited to M2 macrophages and DCs (online supplemental figure 4a). As shown in figure 6D, we observed that several genes such as Nt5e, Clec10a, Csf1, Tlr2, and Ccr2 were expressed in limited amounts. Thus, we identified M2 macrophage subclusters that consisted of Nt5e+/Cx3xr1high/Csfhigh M2 (C3) and Clec10a+/Cx3cr1high/CD163high M2 (C8) macrophages (figure 6F). Although the diversity of myeloid cell subclusters was similar among the control and the two treated groups (figure 6B), we observed that one of the M1 macrophages (C0) was significantly increased in the AB680-treated tumors compared with that in the control (figure 6E). Additionally, another M1 macrophage cluster (C6) was increased in the AB680-treated tumor compared with that in the control with a p value=0.0757 (figure 6E). However, AB680 treatment did not affect the proportion of M2 cells (figure 6F, online supplemental figure 6b). Conversely, PD-1 blockade significantly downregulated the proportion of M2 macrophages (C3), while it did not affect M1 macrophages. Taken together, AB680 treatment and PD-1 blockade differentially regulated the proportion of myeloid cells in tumors. Notably, AB680 and PD-1 differentially regulated gene expression in myeloid cells (online supplemental figure a-c). As shown in online supplemental figure 7a, we observed that the AB680-treated Tlr2+ M1 macrophages (C0) were significantly upregulated for Gzma, Irf7, and Ly6c1, while PD-1 blocker-treated Tlr2+ M1 macrophages (C0) were significantly upregulated for the expression of Malt1, Btg2, and Cxcl9 (online supplemental figure 7a). Similarly, AB680 significantly increased the expression of Gzma in Nt5e+ M2 macrophages (C3) and Fcgr1high macrophages (C6) (online supplemental figure 7b,c). Furthermore, AB680 treatment downregulated the expression of S100a8 in Tlr2+ M1 macrophages (C0), Nt5e+ M2 macrophages (C3), and Fcgr1high macrophages (C6) (online supplemental figure 7a-c).

Myeloid cell subclusters. (A) Uniform manifold approximation and projection (UMAP) plot for myeloid cell subclusters. (B) Proportion of clusters in each sample. (C) Heatmap representing cluster-specific gene expressions. (D) Heatmap for the expression profile of marker genes (z-score of log2(CPM+1)) used to identify the cell type of each subcluster and to determine the degree of depletion. Red and blue colors denote upregulated and downregulated genes, respectively. (E) Box-and-whisker plot comparing the proportion of cells within the myeloid cell M1 macrophages (C0) with the controls and AB680, between the controls and the PD-2 blocker (t-test, *p = 0.05). (F) Box-and-whisker plot comparing the proportion of cells within M2 macrophages (C3) between the controls and the PD-2 blocker (t-test, *p = 0.05). NS, non-significant; PD-1, programmed cell death protein 1.
Distinct immune-stimulating intercellular interactions between AB680-treated and PD-1 blocker-treated T cells and macrophages
Next, to gain insight into the differential interactions among Treg (C2), CD8+ Tex, M1 macrophages (C2), and M2 macrophages (C3) treated with AB680 and the PD-1 blocker, we investigated the crosstalk between the macrophage clusters (C0 and C3) and T cells using cellphoneDB.24 In regard to the interaction between M2 (C3) and Treg cells (C2), the predicted interaction between Ereg on Treg cells (C2) and Egfr from M2 macrophages (C3) was more prominent in AB680-treated tumors than it was in the controls (online supplemental figure 8a). But PD-1 did not affect those interaction (online supplemental figure 8a). However, PD-1 did not affect these interactions (online supplemental figure 7a). Conversely, the predicted interaction between Ephb2 on Treg cells (C2) and Epna5 from M2 macrophages (C3) was more prominent in PD-1-treated tumors than it was in the controls (online supplemental figure 8a). For the interaction between M1 (C2) and Treg cells (C2), the predicted interaction between IL-6 on Treg cells (C2) and Hrh1 from M1 macrophages (C2) was more prominent in AB680-treated tumors than it was in the controls (online supplemental figure 8b). Importantly, interactions between Tgfb2 on Treg (C2) and Tgfbeta receptors 1 and 2 on M1 macrophages (C2) were commonly absent in both AB680-treated and PD-1 blocker-treated tumors (online supplemental figure 7b). In regard to the interaction between M1 (C2) and CD8+ Tex cells (C0, 1, 5, 6, 8, and 10), the interactions between Plxnb3 (plexin B3), Jag2, and Pgf on M1 macrophages and Sema5a (Semaphorin 7a), Notch2, and Flt1 on CD8+ Tex cells became undetectable (online supplemental figure 8c).
The anticancer effect of AB680 treatment and PD-1 blockade in the in vivo AOM/DSS model
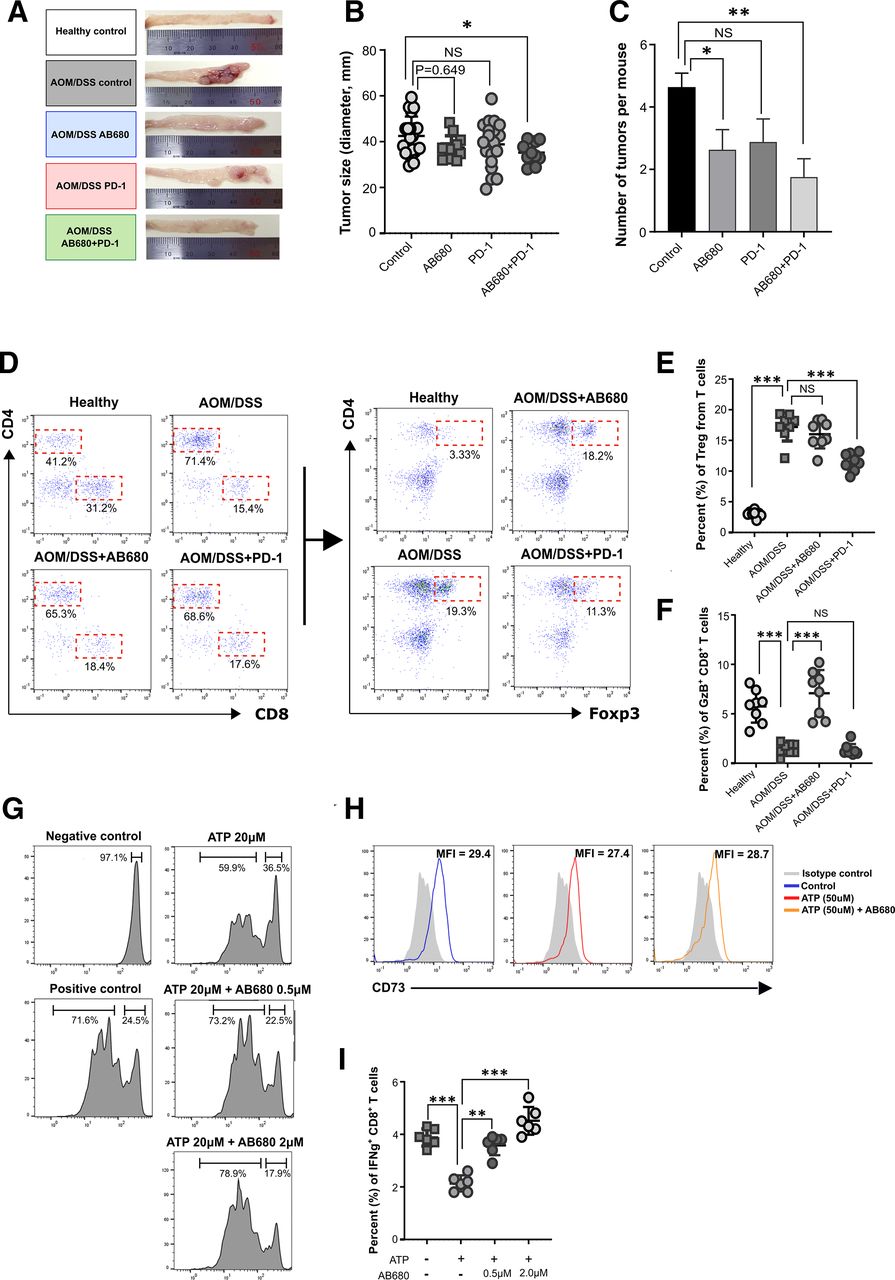
To understand the effect of AB680 and PD-1 blockers on the colitis-associated cancer mouse model, we administered AB680 and PD-1 blocker for 21 days after the third cycle of DSS treatment. To analyze the anticancer effects, we measured the diameters of tumors in the large intestine of mice (figure 7A). As shown in figure 7B, the average diameters for 35 tumors derived from eight mice in the control group (AOM/DSS), 18 tumors from eight mice in the AB680 group (AOM/DSS+AB680), 27 tumors from eight mice in the PD-1 group (AOM/DSS+PD-1), and 14 tumors from eight mice in the AB680+PD-1 group (AOM/DSS+AB680+PD-1) were 42.525±8.42 mm, 37.45±5.08 mm, 38.84±10.22 mm, and 35.2±4.75 mm, respectively. The tumor diameters of the AB680+PD-1 group were significantly reduced compared with those of the control group (figure 7B). The number of tumors per mouse in the AB680 and AB680+PD-1 groups was also significantly reduced compared with that in the control group (figure 7C). To understand the immunological changes in the large intestine, we analyzed CD4+ T cells, CD8+ T cells, and Tregs (figure 7D). Notably, AOM/DSS treatment triggered a robust increase in CD4+ T cells and CD4+ Foxp3+ Tregs in the large intestine (figure 7D). These immunological changes could be altered by PD-1 blockade and not by AB680 (figure 7D,E). Conversely, GzB+ CD8+ T cells were significantly reduced in AOM/DSS mice compared with numbers in healthy controls (figure 7F). The downregulated GzB+ CD8+ T cells were significantly recovered in response to AB680 treatment and not by PD-1 treatment (figure 7F). These results were consistent with our data from the CRC-cell-line-harboring in vivo tumor mouse model.
The effect of AB680 and programmed cell death protein 1 (PD-1) blockade on the in vivo AOM-DSS colorectal cancer (CRC) model. After sacrifice of mice as described in the Materials and methods section, (A) representative images for tumors in large intestines of mice for the AOM/DSS-induced control (n=8), AOM/DSS+AB680 (10 mg/kg) treated (n=8), AOM/DSS+PD-1 blockade (10 mg/kg) treated (n=8) and AOM/DSS+AB680 (10 mg/kg)+PD-1 blockade (10 mg/kg) treated group (n=8). (B) The diameters of all tumors in large intestines of mice for each group. (C) The number of tumors per mouse were measured for each group. Data are presented as mean ± SEM (t-test, NS, non-significant; *p<0.05; **p<0.01). (D) Percentages of CD4+ T cells and CD8+ T cells and the percentages of CD4+ Foxp3+ Tregs of large intestinal tissues from healthy and AOM-DSS murine models with or without AB680 or PD-1 blocker treatment. These results are representative from all independent experiments (n=8 per each group). The graphical results show (E) the percentages (%) of CD4+ Foxp3+ Treg per total T cells and (F) the percentages (%) of GzB+ CD8+ T cells of large intestinal tissues. Data are presented as mean ± SEM (t-test, NS, non-significant; ***p<0.001). (G) The histograms show the proliferating CD8+ T cells in the in vitro culture with or without ATP (20 µM) and AB680 (0.5 and 20 µM). These results are representative from three independent experiments. (H) The representative histograms show the mean fluorescence of intensity (MFI) for CD73 expression level of CD8+ T cells in the in vitro culture with or without ATP (20 µM) and AB680 (20 µM). These results are representative from three independent experiments. (I) The graphical result shows the percentages (%) of IFNγ+ CD8+ T cells after the in vitro culture with or without ATP (20 µM) and AB680 (0.5 and 20 µM) (n=6). Data are presented as mean±SEM (t-test, **p<0.01; ***p<0.001).
AB680 directly boosted in vitro T cell proliferation and IFNγ production
To verify the direct effect of AB680 on the regulation of proliferation and IFNγ production in CD8+ T cells, we purified human T cells and tested the effect of AB680 on T cell proliferation and IFNγ production within the in vitro culture (figure 7G,I). First, we showed the similar levels of CD73 expression on control (untreated), 20 µM APT treated and 20 µM ATP plus AB680-treated human CD8+ T cells, which were isolated from human peripheral blood, suggesting ATP and AB680 do not affect the expression of CD73 on human CD8+ T cells (figure 7H). Notably, 20 µM of extracellular ATP significantly downregulated proliferation of CD8+ T cells (figure 7G). It should be caused by conversion of extracellular ATP to adenosine. Those conversion could be inhibited by treatment of AB680, resulting in the recovery of T cell proliferation similar level to positive control (untreated group) (figure 7G). Furthermore, we measured IFNγ production from CD8+ T cells through flow cytometry analysis (figure 7I). For those purpose, we permeabilized and stained the fixed CD8+ T cells with anti-IFNγ mAb for analysis. Importantly, we found that ATP treatment significantly reduced IFNγ producing CD8+ T cells compared with untreated group (figure 7I). However, AB680 treatment could increase IFNγ producing CD8+ T cells compared ATP-treated CD8+ T cells (figure 7I). Those results strongly suggest that AB680 has a potent direct effect to boost CD8+ T cell function under the microenvironment equipped with enriched extracellular ATP or adenosine.
Discussion
The tumorigenic mechanism of extracellular adenosine has been widely studied in a number of solid tumors, including ovarian cancer38 and non-small-cell lung cancer.15 Recently, the significance of adenosine in gastrointestinal cancers, including CRC,39 has also been highlighted. Thus, novel drug candidates targeting adenosine-related mechanisms such as ciforadenant (previously known as CPI-444) and AB-680 that act as A2AR antagonists and CD73 inhibitors, respectively, have been developed.28 40 In humans, CD4+CD25highFOXP3+ regulatory T cells (Treg) are predominantly CD39+,41 while CD39 and CD73 are overexpressed in tumor-associated macrophages (TAMs)42 and tumor cells.43 These previous reports are consistent with our results (figures 3G and 7C). The abundance of TAMs is correlated with poor prognosis in various tumors, ask they can induce resistance to antitumor treatments (ie, chemotherapy, anti-PD1, and others).44 45 Additionally, the polarization of M2 macrophages is stimulated by adenosine. In this study, we observed that the increase in the proportion of Ccr2+ Tlr2high M1 macrophages was one of the major mechanisms boosting the anticancer immunity of AB680 (figure 6F). These results are consistent with those of previous studies46 47 that suggested the importance of M1 macrophages for anticancer immunity. In this study, we confirmed that Cx3cr1 was primarily expressed in DC and M2 macrophages, while Ccr2 was predominantly expressed in M1 macrophages (figure 6D,E, online supplemental figure 5b). This is consistent with the results of other previous studies.48 Conversely, PD-1 blockade significantly downregulated the proportion of Cx3cr1high/Csf1high/Nt5e+ M2 macrophages (C3), and it did not affect M1 macrophages. Taken together, our data strongly suggest that the regulation of the M1/M2 macrophage proportion represents a major mechanism of action of AB680 and PD-1 blockers in regard to boosting their anticancer effects.
Next, we determined that the majority of intratumoral T cells were Tex and Treg cells (figure 2A, E). In this study, PD-1 blocker treatment exhibited a potent effect in reducing the numbers of Malat1high Treg and CD4+ Tex cells (figure 2E). The compositional regulation of PD-1 blocker treatment may provide an important benefit in regard to tumor regression due to its ability to increase TCR diversity in some portions of T cells (figure 3B,C, online supplemental figure 2b,c). Interestingly, PD-1 blocker treatment selectively increased the TCR diversities of entpd1-negative T cells and Pdcd1-positive T cells (online supplemental figure 2b,c). This may be explained by the compensatory immunoregulatory mechanism of PD-1 that functions to suppress the TCR diversity signal in addition to the adenosine signal. Therefore, extracellular ATP/adenosine hampers the efficacy of anti-PD-1 immune checkpoint blockade in a manner that is likely due to a compensatory immunoregulatory mechanism.49 50 A subset of patients with melanoma undergoing anti-PD1 immunotherapy exhibited upregulation of tumor-derived CD73 expression.51 Moreover, a recent clinical trial examining the use of ciforadenant plus atezolizumab (an anti-PD-L1 antibody) for treating renal cell cancer revealed that the combination therapy improved efficacy.52 The patients in this study were primarily resistant or refractory to anti-PD-1/PD-L1 therapies and represented PD-L1-negative tumors, thus indicating the complementary roles of adenosine and PD-L1 within the tumor microenvironment. However, to date, there is still a poor understanding of how extracellular adenosine limits the effectiveness of PD-1 blockers. Our data strongly support the previous assumption that ATP/adenosine could suppress intratumoral immune cells in a different manner compared with that of PD-L1/PD-1, and we described this in our current study. Thus, inhibition of ATP/adenosine signaling may represent one of the most efficient and synergistic therapeutic approaches in combination with PD-1 blockers for the treatment of CRC. To summarize, our report detailing the applicability of the CD73 inhibitor AB680 and its mode of action in the context of CRC may provide novel insight for understanding its potential and efficacy in the treatment of CRC. Moreover, our study may aid in the development of a novel treatment method for patients with refractory CRC who do not respond to existing chemotherapy anticancer drugs and PD-1 antagonists.
Data availability statement
All data relevant to the study are included in the article or uploaded as supplementary information. The raw data are available from Sequence Read Archive (SRA) under accession number SUB8983993.
Ethics statements
Ethics approval
All animal experiments were approved by the Institutional Animal Use and Care Committee of the Korea Research Institute of Chemical Technology and performed in accordance with the Guide for the Care and Use of Laboratory Animals published by the U.S. National Institutes of Health.
References
Supplementary materials
Supplementary Data
This web only file has been produced by the BMJ Publishing Group from an electronic file supplied by the author(s) and has not been edited for content.
Footnotes
MK, YKM and JJ contributed equally.
Contributors CHL designed the study. MK and YKM performed experiments. JJ, HP and SL analyzed scRNA-seq data. SL and CHL wrote the manuscript with feedback from MK, YKM, JJ, and HP.
Funding This work was supported by Korea Institute of Planning and Evaluation for Technology in Food, Agriculture, Forestry (IPET) through Animal Disease Management Technology Development Program from the Ministry of Agriculture, Food and Rural Affairs (MAFRA) of the Korean government (grant no. 318070-3) and Intramural Research Fund (SI2131-10) of KRICT. This research was also supported by the Basic Science Research Programs through the National Research Foundation of Korea (NRF) funded by the Ministry of Science and ICT (MSIT) (NRF-2018R1C1B6008448) and the Ministry of Education (NRF-2018R1A6A1A03025810).
Competing interests None declared.
Provenance and peer review Not commissioned; externally peer reviewed.
Supplemental material This content has been supplied by the author(s). It has not been vetted by BMJ Publishing Group Limited (BMJ) and may not have been peer-reviewed. Any opinions or recommendations discussed are solely those of the author(s) and are not endorsed by BMJ. BMJ disclaims all liability and responsibility arising from any reliance placed on the content. Where the content includes any translated material, BMJ does not warrant the accuracy and reliability of the translations (including but not limited to local regulations, clinical guidelines, terminology, drug names and drug dosages), and is not responsible for any error and/or omissions arising from translation and adaptation or otherwise.