Article Text

Abstract
Background Triple-negative breast cancer (TNBC) is the most aggressive subtype of breast cancer and lacks definite treatment targets. Tumor immune microenvironment (TIME) heterogeneity has a profound impact on the immunotherapy response. Tumors with non-inflamed TIME derive limited benefit from immunotherapy. However, what drives the formation of the non-inflamed TIME in TNBC remains unclear.
Methods Using our multiomics database of TNBC, we conducted an analysis to explore the key genomic events driving the formation of the non-inflamed TIME in TNBC. In vitro and in vivo studies further revealed potential mechanisms and the efficacy of combination treatment with immunotherapy.
Results With transcriptomic and genomic data, we systematically analyzed the TIME of TNBC and revealed that the classical basal-like subtype of TNBC consisted of two distinct microenvironment phenotypes, defined as the ‘inflamed’ and ‘non-inflamed’ subtypes. We performed further screening and demonstrated that MYC amplification and overexpression led to low immune infiltration and cytolytic activity in TIME. Mechanistically, MYC bound to DNMT1 promoter and activated DNMT1 transcription in TNBC cells, thus suppressing the Cyclic GMP-AMP synthase (cGAS)-STING pathway via an epigenetic regulatory way. In MYC-overexpressing TNBC, decitabine, an Food and Drug Administration (FDA)-approved DNA methyltransferase inhibitor, converted tumors from non-inflamed to inflamed tumors by enhancing T cell infiltration. Furthermore, the combination of decitabine with programmed cell death protein 1 (PD-1) inhibitor reversed T cell exhaustion and improved T cell function in mouse models, which elicited potent antitumor activity in MYC-overexpressing TNBC.
Conclusions Our work elucidates that the classic oncogene MYC induces immune evasion by repressing innate immunity. Furthermore, we provide a rationale for combining DNA methyltransferase inhibition with immunotherapy for the treatment of MYC-overexpressing TNBC.
- immunity
- innate
- immunotherapy
- tumor escape
- tumor microenvironment
Data availability statement
All data relevant to the study are included in the article or uploaded as online supplemental information.
This is an open access article distributed in accordance with the Creative Commons Attribution Non Commercial (CC BY-NC 4.0) license, which permits others to distribute, remix, adapt, build upon this work non-commercially, and license their derivative works on different terms, provided the original work is properly cited, appropriate credit is given, any changes made indicated, and the use is non-commercial. See http://creativecommons.org/licenses/by-nc/4.0/.
Statistics from Altmetric.com
Background
Breast cancer is the second-leading cause of cancer-related death in women, with more than 40 000 annual deaths predicted to occur worldwide in 2020.1 2 Triple-negative breast cancer (TNBC) accounts for 15%–20% of breast cancer cases and is immunohistochemically characterized by the absence or minimal expression of estrogen receptor and progesterone receptor and lack of human epidermal growth factor receptor 2 amplification.3 TNBC is also a highly aggressive and heterogeneous disease associated with a high probability of distant metastasis and poor overall survival in the short term.4 With the rapid development of cancer genome sequencing in recent years, the heterogeneity of TNBC has been further dissected. The work by Lehmann et al classified TNBC into six subtypes in 2011.5 Following this, two studies at our center further identified four transcriptome-based subtypes in TNBC: luminal androgen receptor (LAR), immunomodulatory (IM), basal-like immune-suppressed (BLIS), and mesenchymal-like (MES).6 7 Furthermore, several reports have also established the heterogeneity of TNBC in terms of tumor immune microenvironment (TIME).8–10 In 2019, our team classified 386 TNBC samples into three microenvironment clusters with distinct potential immune escape mechanisms.8 By integrating spatial resolution of immune cells with laser capture microdissection gene expression profiling, Gruosso et al9 also defined four distinct TIME stratifications in TNBC.
TNBC lacks definite targeted therapies and chemotherapy has still been the mainstay treatment in TNBC now.3 4 Given the urgent need for novel and effective treatments for this disease, clinical exploration of immune checkpoint blockade (ICB) is occurring rapidly.11 Indeed, ICB has shown promise in improving clinical outcome for TNBC patients.12 Several clinical trials, including IMpassion130, KEYNOTE 522 as well as IMpassion031 trials, have demonstrated the efficacy of chemotherapy plus ICB in the metastatic and neoadjuvant settings for TNBC.13–15 However, ICB seems to be effective in only a subset of TNBC patients. For example, clinical trials with single-agent anti-programmed cell death protein 1 (PD-1) or anti-programmed cell death ligand protein 1 (PD-L1) therapy had yielded the disappointing clinical response rates of approximately 20% in metastatic TNBC.16 17 Thus, the mechanisms underlying the poor response to ICB deserve intense investigation.
Indeed, tremendous efforts have been made to investigate the biomarkers predicting the efficacy of ICB in recent years. In general, PD-L1 is regarded as a reliable biomarker for ICB, and patients with negative PD-L1 expression seemed to derive less benefit from ICB than those with positive expression in the IMpassion130 trial.13 In addition to PD-L1 expression, the presence of an existing antitumor T cell response is considered to be substantially important for boosting the antitumor efficacy of immunotherapies, including ICB.18 19 Tumors with a lack of immune infiltration are also known as immunologically non-inflamed tumors, in which ICB shows no or limited benefit.20 21 Previous studies have identified several genetic alterations of the tumor leading to the non-inflamed immuno-phenotype, such as activation of oncogenic WNT-β-catenin signaling and loss of LKB1 or PTEN.22–24 However, few studies have investigated the events that lead to low immune infiltration in TNBC. Here, we pursued the identification of key genomic events driving the non-inflamed TIME and investigated a candidate combination therapeutic strategy for improving immunotherapeutic efficacy in TNBC.
Materials and methods
Samples and datasets
Detailed information of the samples was described in our previous study.6 Briefly, we retrospectively selected patients with TNBC who underwent surgeries at the Department of Breast Surgery, Fudan University, Shanghai Cancer Center (FUSCC; Shanghai, China) from 2007 to 2014 to develop a multiomic TNBC dataset. In previous studies, our team classified TNBC into four transcriptome-based (LAR, IM, BLIS and MES) or three microenvironment-based subtypes (cluster 1, cluster 2 and cluster 3).6 8 In the current study, to more accurately select homogenous ‘inflamed tumors’ and ‘non-inflamed tumors’, we focused on and selected the samples of ‘inflamed tumor’ belonging to IM and cluster 3 as well as ‘non-inflamed tumor’ belonging to BLIS and cluster 1 (online supplemental figure S1A). In addition, two pathologists evaluated stromal and intratumoral tumor-infiltrating lymphocytes (sTILs and iTILs, respectively) in H&E-stained pathological sections on the basis of established guidelines.25 All the tissue samples included in this study were obtained with approval from the independent ethics committee/Institutional Review Board of the FUSCC Ethical Committee, and each patient provided written informed consent.
Supplemental material
Calculation of signature scores for immune-and MYC-related pathways
We referred to the study by Ronney et al26 to obtain the gene list of immune-related pathways. In general, signatures of the cytolytic activity (CYT), common immune cells, immunostimulatory pathways and immunoinhibitory pathways were included in our analysis. Subsequently, we used single-sample gene set enrichment analysis (ssGSEA, ‘GSVA’ function in R) to calculate the signature score for each immune-related pathway. The CYT represents the CYT of CD8+ T cells and NK cells, which was calculated by the log average (geometric mean) of GZMA and PRF1.26
In addition, we referred to the paper published in Cell in 2018, which described the landscape of ten classical oncogenic signaling pathways in TCGA, to establish the MYC signature.27 In detail, we first extracted genes related to the MYC pathway from the paper. Then, we classified these genes into two groups, based on their activated or repressed functions in the MYC pathway. After that, we used the ssGSEA method to calculate the activating score and repressing score of the MYC pathway in each sample. The MYC signature score was calculated as the activating score minus the repressing score.
Animal studies
To establish orthotopic models, either 66cl4-shMYC-NC/1/3 or 4T1-MYC-vec/oe cells in 50 µL of DMEM medium were injected into the fourth mammary gland of 6-week-old female BALB/c or NSG mice (66cl4: 1×10⁶ cells; 4T1: 5×10⁵ cells). For CD8+ T cell depletion experiments, 6-week-old female BALB/c mice were treated with rat IgG2b (BioXCell, clone LTF-2, 100 µg injected intraperitoneally on day 1, followed by 50 µg on day 3 and 50 µg weekly for the remainder of the experiment) or anti-mouse CD8a (BioXCell, clone 2.43, 100 µg injected intraperitoneally on day 1, followed by 50 µg on day 3 and 50 µg weekly for the remainder of the experiment). For in vivo combination therapy, mice were treated with diluent or decitabine alone (S1200, Selleck, 0.8 mg/kg, intraperitoneal injection, every day) or in combination with isotype IgG (BioXcell, clone 2A3, 100 µg injected intraperitoneally, on days 3, 7, 10, 14) or anti-PD-1 antibody (BioXcell, clone RMP1-14, 100 µg injected intraperitoneally, on days 3, 7, 10, 14).
Tumor growth was measured 2–3 times per week using calipers. The primary tumors were harvested for analysis once they reached a 3–5 week time point or a volume of 1 or 2 cm3 using the formula: volume = (width2 ×length)/2. Mice were humanely sacrificed after measurement. For experimental accuracy, these data were also included.
Immunohistochemistry
An anti-CD3 antibody (99940, Cell Signaling Technology) and anti-CD8 antibody (98941, Cell Signaling Technology) were used at 1:200 and 1:400 dilutions, respectively, using the Gene Tech DAB Detection Kit with EDTA antigen retrieval. An granzyme B antibody (ab255598, Abcam) was run at a 1:2000 dilution using the Gene Tech DAB Detection Kit with citrate antigen retrieval. Immunohistochemistry (IHC) analysis of positive cells was performed by manual counting of positive and total cells in five fields/tumor using ImagePro Plus. Human breast cancer tissue arrays were stained by IHC with anti-MYC (ab32072; Abcam; 1:200), anti-DNMT1 (ab188453; Abcam; 1:200), anti-STING (13647; Cell Signaling Technology; 1:200) antibodies. A positive control tissue sample with invasive breast cancer known to express high levels of each marker was evaluated. For negative controls, the primary antibody was replaced with the corresponding IgG. All stained slides were examined under a light microscope by two independent observers. Images (×40 magnification) were acquired using a Zeiss Axioimager M1 microscope with Plan-Apochromat ×40/0.8 air. Written informed consent regarding tissue and data use for scientific purpose was obtained from all the patients.
Flow cytometry
For in vitro analysis, cells were washed with phosphate-buffered saline (PBS) and dissociated from the plates with Accutase (Gibco) for 5–10 min at 37°C to generate single-cell suspensions. For in vivo studies, tumors were excised postmortem and enzymatically digested using a mixture of 0.5 mg/mL collagenase type I (Sigma-Aldrich), 1 mg/mL dispase (Roche), and 1 mg/mL hyaluronidase (Sigma-Aldrich) with antibiotics, 30 min at 37°C. Dissociates were passed through a 40 µm filter to collect single-cell suspensions. Single-cell suspensions were washed twice in flow staining buffer and incubated with the appropriate flow antibodies at 4°C for 30 min in the dark. For intracellular staining of mouse granzyme B, cells were stimulated with Leukocyte Activation Cocktail (550583, BD Biosciences) for 6 hours and then subjected to surface, finally intracellular staining using Cytofix/Cytoperm Soln Kit (554714, BD Biosciences). A live/dead stain was used to discriminate viable and dead cells. All the antibodies used for flow cytometry are listed in online supplemental table S1. The results were analyzed with FlowJo X.
Supplemental material
ELISA
The levels of CCL5, CXCL10 and interferon β (IFNβ) in the supernatant of cells were detected with corresponding ELISA kits (FZ-C111200 for CCL5, FZ-C113936 for CXCL10 and FZ-C110284 for IFNβ, XLPCC). Experiments were conducted following the manufacturer’s instructions.
Human CD8+ T cell isolation and coculture system
Human peripheral blood mononuclear cells (PMBCs) were isolated by lymphocyte separation medium (LTS1077, TBD) via density gradient centrifugation. First, PMBCs were seeded in 6-well plates that was preincubated with 1 µg/µl anti-CD3 and 1 µg/µl anti-CD28 3 hours prior (300314 and 302934, BioLegend). The PMBCs were cultured in RPMI 1640 medium containing 10% fetal bovine serum (FBS), 100 U/mL interleukin 2 (IL-2) (589106, BioLegend). After stimulation for 3 days, CD8+ T cells were sorted with anti-CD8 (301008, BioLegend). Next, CD8+ T cells were cocultured with tumor cells at a 5:1 ratio for 24 hours in a Transwell system with 3.0 µm pore size (3402, Corning). The migrated cells in bottom wells were finally collected, stained and calculated.
RNA isolation, quantitative PCR and RNA-sequencing
For reverse transcription PCR, RNA from cells was extracted from cells using TRIzol (Invitrogen) and reverse transcribed into cDNA using a PrimeScriptTM RT reagent kit with gDNA Eraser (TaKaRa) following the manufacturer’s instructions. Real-time PCR was performed using SYBR Premix Ex Taq (TaKaRa) on the ABI 7900 thermocycler (Thermo Fisher Scientific) following the manufacturer’s instructions. The primers used for the quantitative reverse transcription PCR (RT-qPCR) analyses are summarized in online supplemental table S2. RNA-sequencing (RNA-seq) and analysis was performed as described in previous study28 and the RNA-seq data have been uploaded in online supplemental table S3.
Supplemental material
Immunoblotting
Cell lysates (30 µg) were resolved by sodium dodecyl sulfate polyacrylamide gel electrophoresis (SDS-PAGE), transferred to PVDF membranes (Millipore), and incubated with the indicated primary antibodies. Corresponding protein–antibody complexes were detected using enhanced chemiluminescence system (Bio-Rad, Molecular Imager ChemiDOC XRS+). The following antibodies were used: anti-MYC (ab32072; abcam; 1:1,000), anti-PD-L1 (ab213524; abcam; 1:1,000), anti-HLA Class I ABC (15 240–1-AP; Proteintech; 1:1000), anti-STING (13647; Cell Signaling Technology; 1:1,000), anti-DNMT1 (5032; Cell Signaling Technology; 1:1,000), anti-Flag (F3165; Sigma-Aldrich; 1:1000), anti-GAPDH (10 494–1-AP; Proteintech; 1:10,000), anti-Vinculin (13901; Cell Signaling Technology; 1:1,000), Phospho-STING_S366 (50907; Cell Signaling Technology; 1:1,000).
Cell culture and reagents
All the cell lines used in this research were obtained from the Type Culture Collection of the Chinese Academy of Sciences. MDA-MB-231, BT-549, Hs578T, 66cl4, 4T1 and HEK-293T cells were cultured in DMEM (HyClone) supplemented with 10% FBS (Biological Industries), 100 U/mL penicillin and 100 µg/mL streptomycin (Basalmedia). HCC1143 cells were cultured with RPMI 1640 medium (HyClone) supplemented with 10% FBS (Biological Industries), 100 U/mL penicillin and 100 µg/mL streptomycin (Basalmedia). Cells were cultured in a humidified environment consisting of 95% air and 5% CO2 at 37°C. Compound 10058-F4 was purchased from Selleck (S7153).
Plasmids and small interfering RNA transfection
The −2 kb promoter region upstream of DNMT1 was cloned into the pGL3-basic vector. All plasmids were transfected with Lipofectamine 2000 transfection reagent (11668-019; Invitrogen). Small interfering RNA (siRNAs) was synthesized and purchased from RiboBio. The sequences of siRNAs targeting human MYC and DNMT1 were as follows: si-MYC-1 (GGGTCAAGTTGGACAGTGT), si-MYC-2 (CGACGAGACCTTCATCAAA), si-DNMT1-1 (GAAGAGACGTAGAGTTACA), and si-DNMT1-2 (GGAACTTTGTCTCCTTCAA). All the si-RNAs were transfected with Lipofectamine@ RNAIMAX transfection reagent (13 778–150; Invitrogen).
Stable transfection using lentiviral infection
The GV358 vector (purchased from GeneChem) was used to clone the sh-RNAs targeting mouse and human MYC. The sequences of shMYC-1/3 were 5′-CGAGAACAGTTGAAACACAA-3′ and 5′-TGATGTGGTGTCTGTGGAGAA-3′, which targeted mouse MYC, while those of shMYC-1/3 targeting human MYC were 5′-CCCAAGGTAGTTATCCTTAAA-3′ and 5′-CAGGAACTATGACCTCGACTA-3′, respectively. Human MYC and mouse MYC were cloned into the Pcdh-puro vector. The plasmids were transfected into HEK-293T cells and the supernatant containing the virus was harvested at 48 hours.
For CRISPR/Cas9-mediated knockout of human and mouse STING, human IRF3 and human DNMT1, we referred to the methods described in previous studies.28 Briefly, we first used lentiCas9-Blast (Addgene, 52962), pMD2G and psPAX2 constructs for virus packaging. Transfected cells were selected with blasticidin S (InvivoGen) for at least 2 weeks. Next, primer sequences for sgRNA construction were extracted from http://www.addgene.org/pooled-library/zhang-human-gecko-v2/, chemically synthesized, and purified by RNase-free HPLC. After generation by primer annealing, one sgRNA was cloned into the lentiGuide-puro plasmid. After the transfection of HEK-293T cells, a single sgRNA virus was generated and collected at 48 hours. And the virus was then introduced into Cas9 cells. Forty-eight hours after infection, the stably integrated cells were selected with 1–3 µg/mL puromycin (InvivoGen) for at least 7 days. For every individual gene, three or six sgRNA targeting sequences were designed and knockout efficiency was confirmed by immunoblotting analyses. Cells were then seeded in 96 well plates in low density (1 cell per well) to form single colonies. Cell clones were genotyped by PCR and sequencing to detect the deletions. The details of the sgRNA targeting sequences are listed in online supplemental table S4.
Supplemental material
Colony-formation and CCK-8 assays
For the colony-formation assay, three hundred cells were seeded in a 6-well plate and then fixed and stained with 0.2% crystal violet solution after 10–14 days. For the CCK-8 assay, the absorbance at 450 nm was determined 2 hours after the addition of 10 µl of CCK-8 solution (A311-01, Vazyme).
Dual luciferase reporter assay
HEK-293T cells were seeded in 24-well plates and transfected with 0.5 µg/well luciferase reporter plasmids. To normalize the transfection efficiency, the cells were cotransfected with 10 ng of pRL-CMV (Renilla luciferase). Forty-eight hours after transfection, the luciferase activity was detected using the Dual-Luciferase Reporter Assay System Kit (E1910, Promega) according to the manufacturer’s instructions.
Chromatin Immunoprecipitation-qPCR assay
The Chromatin Immunoprecipitation (ChIP) assay was conducted using a SimpleChIP@ Enzymatic Chromatin IP kit (9002S, Cell Signaling Technology) following the manufacturer’s instructions. Briefly, cells were cultured to approximately 1×10⁷ and cross-linked with 1% formaldehyde. Samples were then harvested, and chromatin was digested with micrococcal nuclease. Next, several pulses were used to break the nuclear membrane. DNA fragment length was checked and confirmed to be between 150–900 bp. Chromatin was immunoprecipitated with control IgG (2729, 5415; Cell Signaling Technology) or anti-MYC (9402; Cell Signaling Technology; 1:50) or anti-DNMT1 (ab13537; Abcam; 1:100) primary antibodies. After washing and reverse cross-link, the eluted DNAs were quantified by qPCR. The primer sequences were listed as follows: human DNMT1 promoter, forward 5′- AGGGGATGTACCAAACGGAGAG −3′, and reverse 5′-TGCTTTATCCCCATCACACCTG-3′; and human STING promoter, forward 5′-ACCAGTAAAGCTGCGGTTTG-3′, and reverse 5′-AGCCAACATCTGAACGCACC-3′.
Methylated DNA immunoprecipitation
The methylated DNA immunoprecipitation assay was carried out in accordance with the protocols described in previous studies.29 First, genomic DNA was extracted from cells and purified. Next, the obtained DNA was sheared into 200–1000 bp fragments by ultrasonication. The DNA fragments were then denatured at 95°C to obtain single-chain DNA fragments. The single-chain DNA fragments were then incubated with the antibody 5-mC (ab10805; Abcam; 1:100) to obtain DNA-5-mC complexes, which were captured by magnetic beads. Lastly, the DNA that was pulled down was purified with phenol/chloroform extraction and then subjected to qPCR. The sequences of the primers used were the same as those used for the ChIP-qPCR assay.
Immunofluorescence and imaging
For immunofluorescence (IF), cells were seeded on coverslips, fixed with 4% paraformaldehyde for 10 min, permeabilized with 0.4% Triton in PBS for 5 min, and then blocked with 10% FBS before incubation with primary antibodies at 4°C overnight (anti-dsDNA: MAB1293; Millipore; 1:200). dsDNA staining and image processing were performed according to the protocols of previous studies.30
Statistical analysis
Statistical significance was determined using an unpaired Student’s t-test, one-way analysis of variance test or chi-square test (Fisher’s exact test if necessary). Error bars represent the standard error of mean (SEM). The SEM was calculated from at least three independent experiments. Statistical analysis was performed with IBM SPSS V.20.0 software.
Results
MYC is associated with non-inflamed microenvironment in TNBC
Our previous studies developed the TNBC transcriptomic subtyping method and revealed the heterogeneity of the TNBC microenvironment.6 8 In this study, we aimed to explore the genomic drivers of the non-inflamed TIME in basal-like tumors. Therefore, we selected samples belonging to the transcriptomic IM subtype and microenvironmental cluster 3 subtype (inflamed tumors) and samples belonging to the transcriptomic BLIS subtype and microenvironmental cluster 1 subtype (non-inflamed tumors) for further comparison (online supplemental figure S1A). Based on immune signatures, we validated that ‘inflamed tumor’ and ‘non-inflamed tumor’ displayed distinct microenvironmental characteristics, with higher tumor immunogenicity, immune infiltration and CYT in ‘inflamed tumor’ (figure 1A). Correspondingly, ‘inflamed tumor’ also had significantly higher sTIL, iTIL and CD8+ T cell levels in pathological sections than “non-inflamed tumor” (figure 1B,C). We also evaluated the expression of inhibitory molecules in TNBC and examined their correlations with the T cell signature. The mRNA expression of CD8A mRNA was positively correlated with that of PD-L1, IDO, FOXP3, TIM3, and LAG3 (P<0.001; online supplemental figure S1B–F), and the inflamed tumors had higher expression of these genes than the non-inflamed tumors.
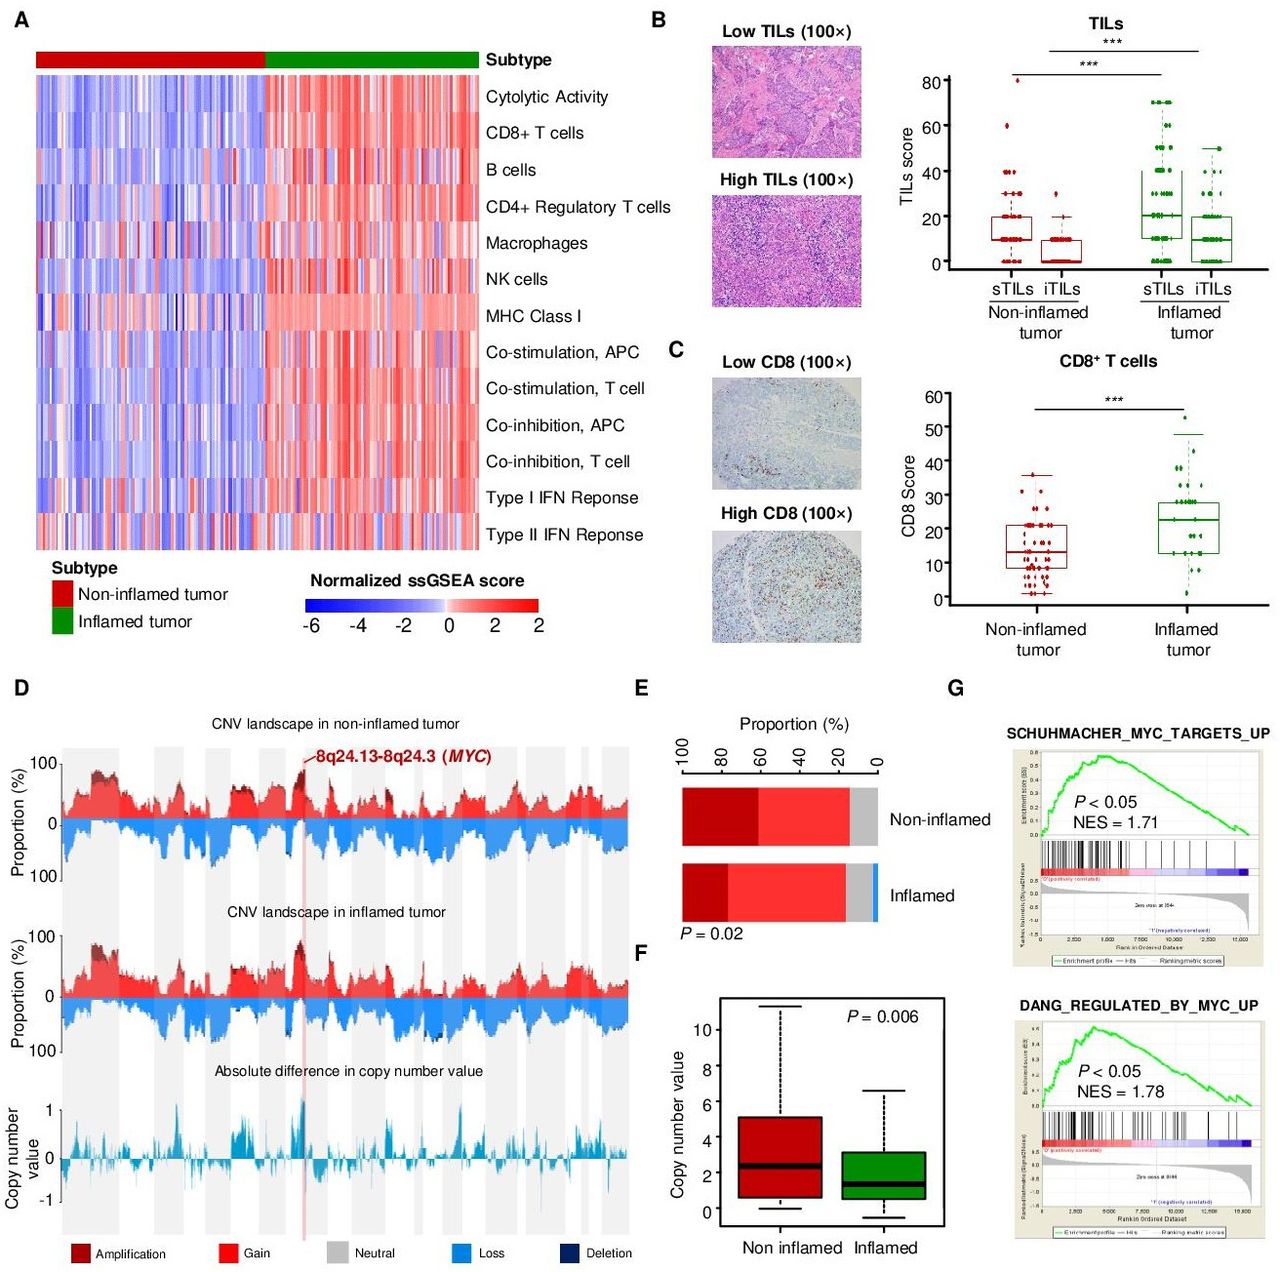
MYC is associated with non-inflamed microenvironment in TNBC. (A) Heatmap indicating the quantified cytolytic activity of the local immune infiltrate between inflamed and non-inflamed TNBC tumors. (B) Pathological scores of sTILs and iTILs in inflamed and non-inflamed tumors. (C) IHC scores for CD8+ T cells in inflamed and non-infalmed tumors. (D) The CNV landscape of non-inflamed and inflamed tumors revealed that the largest difference between non-inflamed and inflamed tumors located in 8q24.13-8q24.3 segment (MYC). (E) The fractions of various types of CNVs of MYC in non-inflamed and inflamed tumors. (F) The comparison of copy number value (log2 copy number/ploidy) of MYC between the non-inflamed and inflamed tumors. (G) Upregulated GO terms related to MYC pathways in non-inflamed tumors compared with inflamed tumors. The data are presented as the median with IQR (B, C); two-tailed unpaired Student’s t test (B, C, F), chi-square test (E). ***P<0.001. CNV, copy number variation; GO, gene ontology; IHC, immunohistochemistry; IQR, interquartile range; NES, normalized enrichment score; sTIL/iTILs, stromal and intratumoral tumor-infiltrating lymphocytes; TNBC, triple-negative breast cancer.
Next, we investigated the key genomic alterations correlated with low immune infiltration in ‘non-inflamed tumors’. The copy number variation (CNV) landscape of tumors revealed that the largest difference in CNV alterations between ‘non-inflamed tumors’ and ‘inflamed tumors’ was 8q24.13–8q24.3 segment in chromosomes (MYC) (figure 1D–F). Consistent with this, GSEA revealed that the MYC-associated pathway was also enriched in the ‘non-inflamed tumor’ group (figure 1G). Similarly, MYC-amplified tumors tended to be ‘immune-cold’, having relatively low expression of the immunostimulatory or immunoinhibitory molecules (online supplemental figure S2A). At the transcriptional level, the MYC signature was also modestly and negatively correlated with immune indicators such as CD3, CD8 and TILs (online supplemental figure S2B–D).
Overall, our analysis reveals that MYC amplification and overexpression were modestly correlated with low immune infiltration in TNBC and might ultimately drive the formation of the ‘non-inflamed tumor’ microenvironment.
MYC impairs T cell infiltration and cytolytic function in vivo
We further conducted in vivo experiments to validate the causal relationship between MYC and T cell infiltration. We first detected the expression of MYC in seven murine cell lines and knocked down MYC expression in the BALB/c-derived 66cl4 cell line (online supplemental figure S3A). Knockdown was confirmed using RT-qPCR and immunoblotting (online supplemental figure S3B,C). To determine the role of MYC in TNBC in vivo, in the context of an intact immune system, we orthotopically injected 66cl4 negative control (shNC) or shMYC-1/3 cell lines into the mammary fat pads of BALB/c mice. Knockdown of MYC expression significantly delayed tumor growth in the mouse models at the time of sacrifice (figure 2A,B). We next sought to investigate the effects of MYC knockdown on the TIME of TNBC. As determined by IHC, tumors with MYC knockdown contained significantly higher percentages of CD3+ and CD8+ T cells. Importantly, CD8+ T cell recruitment was accompanied by an increase in the accumulation of granzyme B+ cells (figure 2C), which was indicative of cytolytic function. We also constructed MYC-overexpressing 4T1 cells and demonstrated that overexpression of MYC boosted tumor growth in vivo (figure 2D,E; online supplemental figure S3D,E). Moreover, MYC overexpression significantly reduced the populations of CD3+, CD8+ T and granzyme B+ cells in vivo (figure 2F).
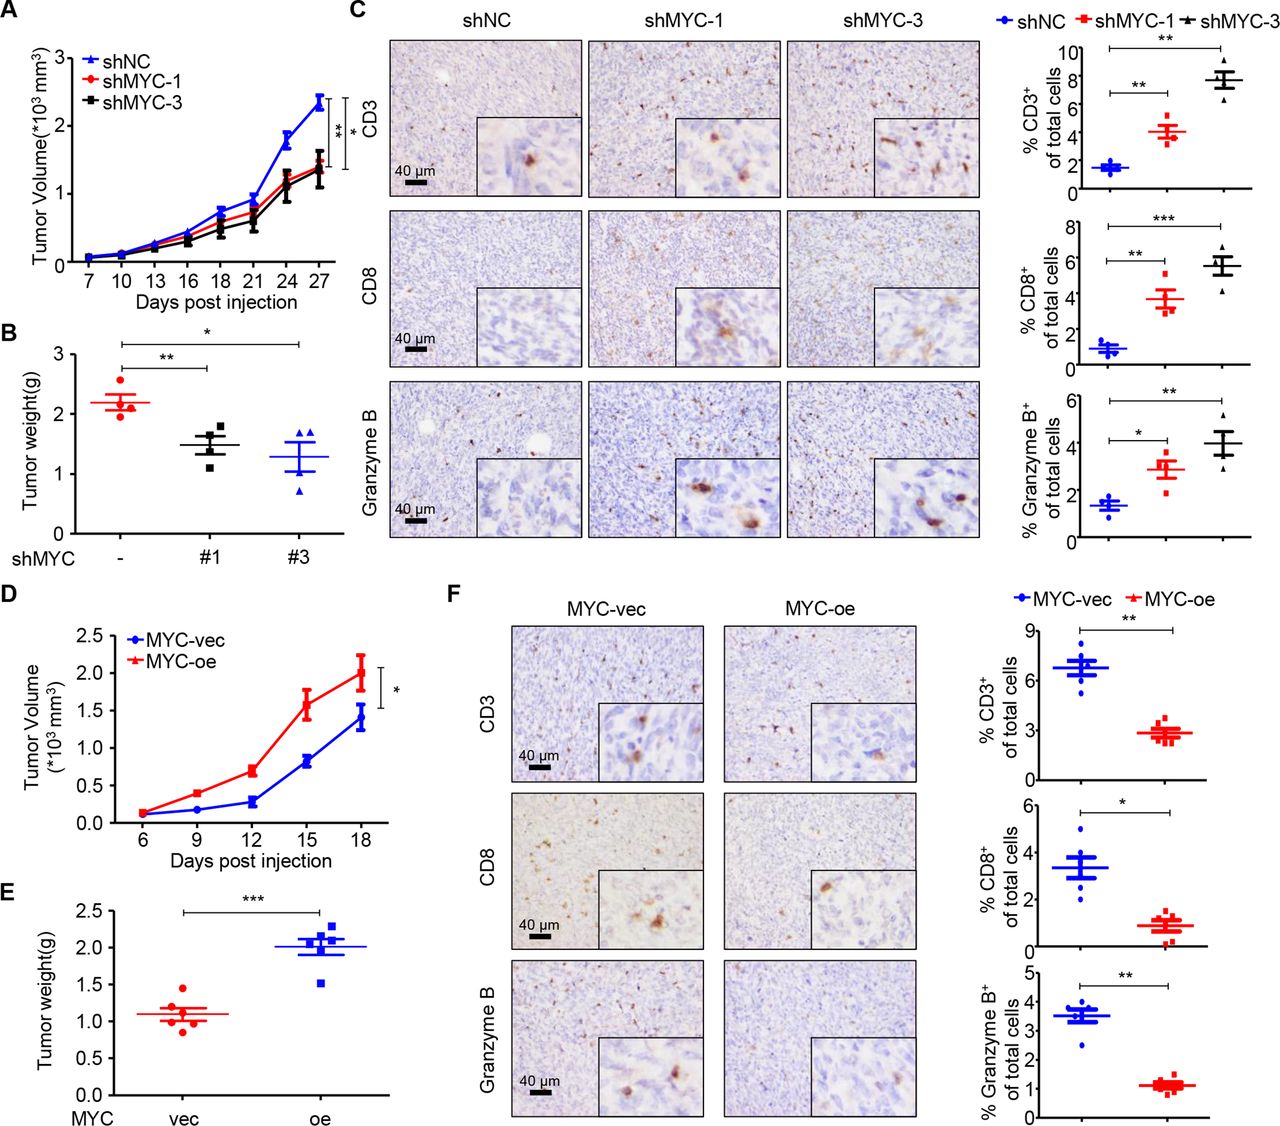
MYC impairs T cell infiltration and cytolytic activity in vivo. (A) Tumor volumes of 66cl4-shNC and 66cl4-shMYC subcutaneous tumors in BALB/c mice (27 days; n=4), as measured using calipers. (B) Tumor weight of 66cl4-shNC and 66cl4-shMYC subcutaneous tumors in BALB/c mice at the time of sacrifice. (C) Representative images of immunohistochemical staining for CD3, CD8 and granzyme B (left), quantification of CD3+, CD8+ and granzyme B+ cells (right) in 66cl4-shNC or 66cl4-shMYC subcutaneous tumors. (D) Tumor volume of 4T1-MYC-vec and 4T1-MYC-oe subcutaneous tumors in BALB/c mice (18 days; n=6), as measured using calipers. (E) Tumor weight of 4T1-MYC-vec and 4T1-MYC-oe subcutaneous tumors in BALB/c mice at the time of sacrifice. (F) Representative images of immunohistochemical staining for CD3, CD8 and granzyme B (left), quantification of CD3+, CD8+ and granzyme B+ cells (right) in 4T1-MYC-vec and 4T1-MYC-oe subcutaneous tumors. The data are presented as the mean±SEM (A–F); two-tailed unpaired Student’s t test (A–F). *P<0.05; **P<0.01; ***P<0.001. SEM, standard error of mean.
To investigate whether the effect of MYC on tumor growth was dependent on the immune system, we conducted in vitro experiments. Both colony-formation and CCK-8 assays showed that MYC significantly altered the proliferation capacity of cancer cells in vitro (online supplemental figure S3F–I). Consistently, xenograft experiments in NSG mice also confirmed the oncogenic function of MYC in vivo (online supplemental figure S3J).
To further confirm that MYC regulates tumor growth partly through immune system, we treated shMYC-bearing BALB/c mice with rat IgG or CD8-depleting antibody. We found that, MYC-knockdown-induced tumor regression, which was observed in control IgG-treated mice, was significantly mitigated by CD8 neutralization (online supplemental figure S3K). We also performed flow cytometry on blood from the treated mice, which confirmed that the anti-CD8-injected mice had significantly reduced CD8+ T cells in comparison with IgG-injected control mice (online supplemental figure S3L).
Thus, the in vivo studies indicate that TNBC-intrinsic MYC promotes tumor growth partly by disabling T cell infiltration and cytolytic function in the TIME, which is consistent with the results of our bioinformatic analysis.
MYC decreases MHC class-I expression and inflammatory cytokines via IFN signaling
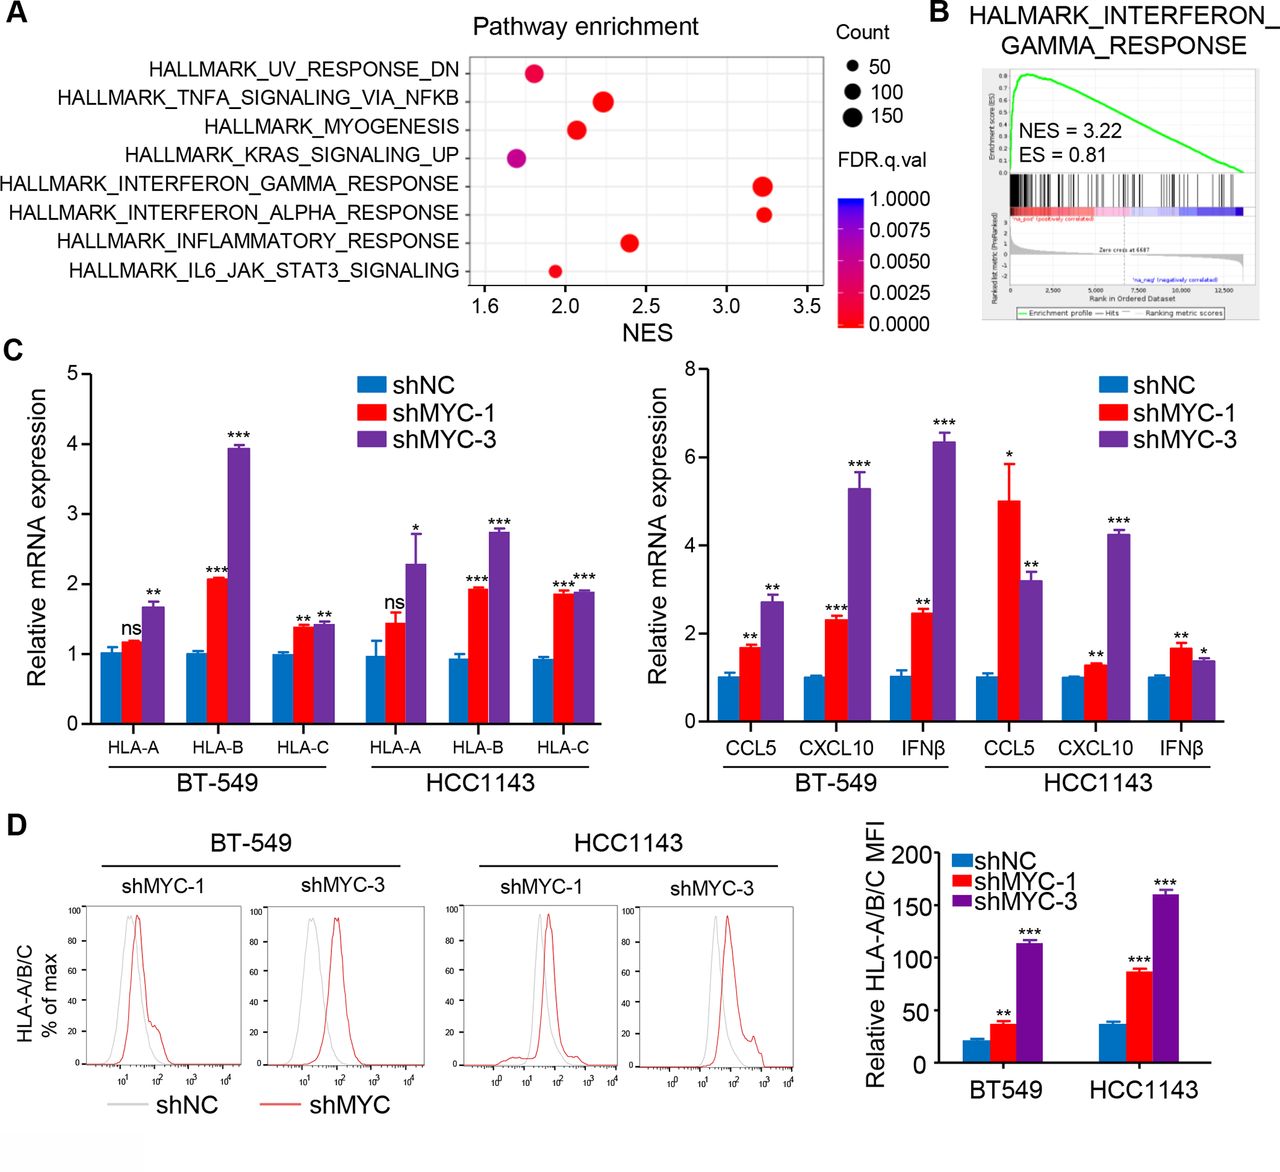
To investigate the mechanism how MYC affects the TIME of ‘non-inflamed tumor’ in TNBC, we first detected the expression of MYC in six human TNBC cell lines (online supplemental figure S4A) and knocked down MYC expression in BT-549 and HCC1143 cell lines (online supplemental figure S4B,C). RNA-seq was conducted in MYC-knockdown and negative control BT-549 cell lines, and GSEA showed that the top upregulated gene sets were involved in IFN pathways (q<0.001) in the MYC-knockdown BT-549 cell line (figure 3A,B), suggesting that cell-intrinsic MYC might influence the TIME of TNBC via repressing IFN signaling. To confirm these results, RT-qPCR analysis was performed and detected a robust increase in the expression of IFN-stimulated genes (ISGs) in MYC-knockdown cell lines, such as OAS2, IFI44L, and IFI44 (online supplemental figure S4D).

MYC decreases MHC-I and inflammatory cytokines expression via interferon signaling. (A) Top-ranked GO terms and (B) GSEA results for RNA-Seq data from BT-549 cells with MYC knockdown as compared with negative control cells. (C) RT-qPCR analyses of MHC-I, CCL5, CXCL10 and IFNβ mRNA expression in BT-549 and HCC1143 cells with MYC knockdown. (D) Flow cytometry analyses of MHC-I expression in BT-549 and HCC1143 cells with MYC knockdown. Relative MFI was calculated by dividing MFI in each group by MFI of isotype control. The data are presented as the mean±SEM (C, D); n=3 independent experiments (C, D); two-tailed unpaired Student’s t test (C, D). *P<0.05; **P<0.01; ***P<0.001. IFNβ, interferon β; MFI, mean fluorescence intensity; GO, gene ontology; GSEA, gene set enrichment analysis; MHC-I, MHC class I; NS, not significant; RNA-Seq, RNA-sequencing; RT-qPCR, quantitative reverse transcription PCR; SEM, standard error of mean.
MHC class I (MHC-I) genes, as well-known IFN pathway-related genes, were significantly upregulated at the mRNA level with knockdown of MYC or treatment with the MYC inhibitor 10058-F4 (figure 3C; online supplemental figure S4E). More importantly, both MYC knockdown and 10058-F4 treatment significantly upregulated the mRNA levels of innate immune cytokines including CCL5, CXCL10 and IFNβ (figure 3C; online supplemental figure S4F). Furthermore, flow cytometry and immunoblotting confirmed MHC-I expression enhancement at the protein level with genetic and pharmacological inhibition of MYC (figure 3D; online supplemental figure S4G,H). Of note, similar results were also validated in the 66cl4 cell line, one of the murine cell lines studied (online supplemental figure S5A–F).
Here, we report that cell-intrinsic MYC suppresses the IFN response, probably explaining the capacity of MYC to shape the non-inflamed TIME in TNBC.
MYC represses type I IFN signaling by modulating STING expression
IFN signaling in tumor cells is typically regulated by dsDNA- or dsRNA-sensing pathways; therefore, we examined the differential expression of genes involved in these signaling axes after MYC expression was knocked down (figure 4A). We identified the upregulation of the expression of genes involved in dsDNA sensing, especially TMEM173/STING (figure 4B), and immunoblotting further confirmed these findings (figure 4C,D; online supplemental figure S6A). Using IF, we also observed the existence of dsDNA in the cytoplasm of both BT-549 cells and HCC1143 cells (figure 4E; online supplemental figure S6B).
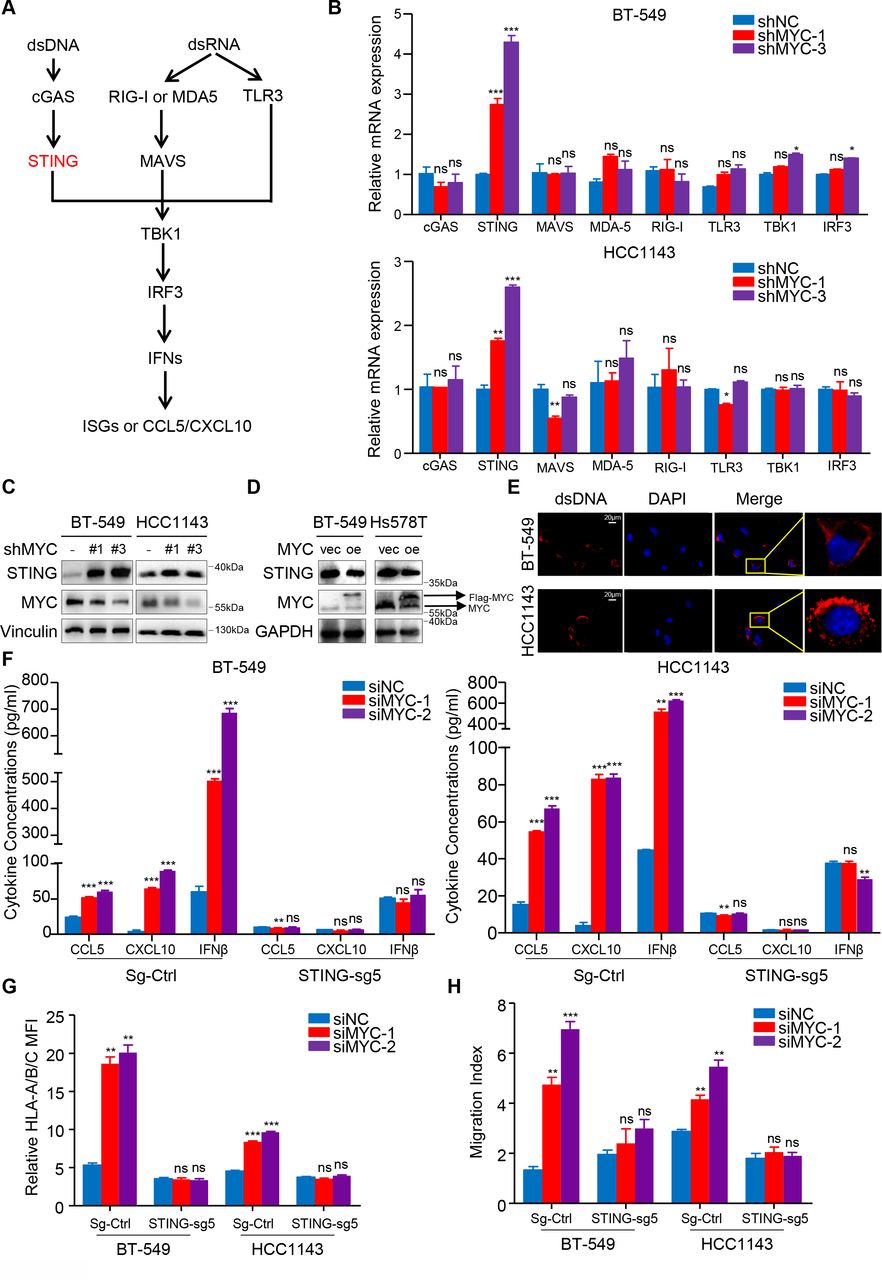
MYC represses type I interferon signaling by modulating STING expression. (A) Schematic of the pattern recognition receptor pathways. (B) RT-qPCR analyses of genes related to these pathways in BT-549 and HCC1143 cells with MYC knockdown. (C, D) Immunoblotting analyses of STING expression in BT-549 and Hs578T cells with MYC knockdown (C) or MYC overexpression (D). (E) dsDNA and DAPI staining in BT-549 and HCC1143 cells using immunofluorescence. (F, G) Change in CCL5, CXCL10 and IFNβ levels measured by ELISA (F), flow cytometry analyses of MHC-I expression (G) in BT-549 and HCC1143 cells transfected with MYC-siRNAs or NC-siRNA in the negative control and STING-knockdown groups. (H) Migratory ability of in CD8+ T cell cocultured with BT-549 and HCC1143 cells transfected with MYC-siRNAs or NC-siRNA in the negative control and STING-knockdown groups. Relative MFI was calculated by dividing MFI in each group by MFI of isotype control. Migration index was calculated by dividing the number of cells that migrated in each group by the number migrating in CD8+/media alone group. The data are presented as the mean±SEM (B, F–H); n=3 independent experiments (B, F–H); two-tailed unpaired Student’s t test (B, F–H). *P<0.05; **P<0.01; ***P<0.001. DAPI, 2-(4-Amidinophenyl)-6-indolecarbamidine; IFNβ, interferon β; MFI, mean fluorescence intensity; NS, not significant; RT-qPCR, quantitaive reverse transcription PCR; SEM, standard error of mean.
Furthermore, CRISPR/Cas9-mediated STING knockdown, as confirmed by immunoblotting analysis (online supplemental figure S6C), abrogated the siMYC-mediated upregulation in the MHC-I expression by flow cytometry and the secrection of CCL5, CXCL10 and IFNβ by ELISA (figure 4F,G). Importantly, a coculture assay with CD8+ T cells further proved that STING depletion abolished effects of MYC knockdown in tumor cells to recruit more CD8+ T cells (figure 4H). Correspondingly, the upregulation of MYC-knockdown-induced STING_S366 phosphorylation was abolished in STING-depleted cells compared with the negative control cells (online supplemental figure S6D). Similarly, STING or IRF3 knockdown impaired the 10058-F4-induced enhancement of downstream HLA/B/C, CCL5, CXCL10 and IFNβ mRNA expression (online supplemental figure S6E–G).
Collectively, these data show that MYC represses type I IFN signaling via modulating STING expression in vitro, which subsequently decreases efficiency of antigen presentation and inflammatory chemokines secretion by tumor cells, which can recruit CD8+ T cells and improve T cell cytolytic function.
MYC upregulates the transcription of DNMT1 and suppresses the STNG-dependent IFN response
We further explored the mechanism by which MYC regulates STING. As MYC is a well-known transcription factor, we first referred to the ChIP-Atlas public database to identify the downstream targets of MYC in TNBC. Previous reports suggested that DNMT1 might be an important negative regulator of STING.29 We also found that MYC binds to the promoter of DNMT1 in MB-MDA-231 and MB-MDA-453 TNBC cells based on the ChIP-Atlas public database (data not shown). Therefore, we hypothesized that DNMT1 functions as a downstream target gene of MYC and regulates STING expression in TNBC. Strikingly, ChIP-qPCR accompanied by dual-luciferase reporter experiment confirmed our hypothesis that MYC binds to DNMT1 promoter in TNBC cells (figure 5A,B). Correspondingly, we verified that MYC significantly decreased DNMT1 expression at both mRNA and protein levels (figure 5C,D; online supplemental figure S7A). Furthermore, we also demonstrated an association between MYC overexpression and increasing DNMT1 levels (figure 5E). Next, ChIP-qPCR showed that DNMT1 binding within the 5′ untranslated region of STING was enriched compared with IgG, and immunoprecipitation of methylated DNA further confirmed decreased DNA methylation levels within the STING promoter region after two TNBC cell lines were stably transfected with sgRNA targeting DNMT1 (figure 5F,G; online supplemental figure S7B).
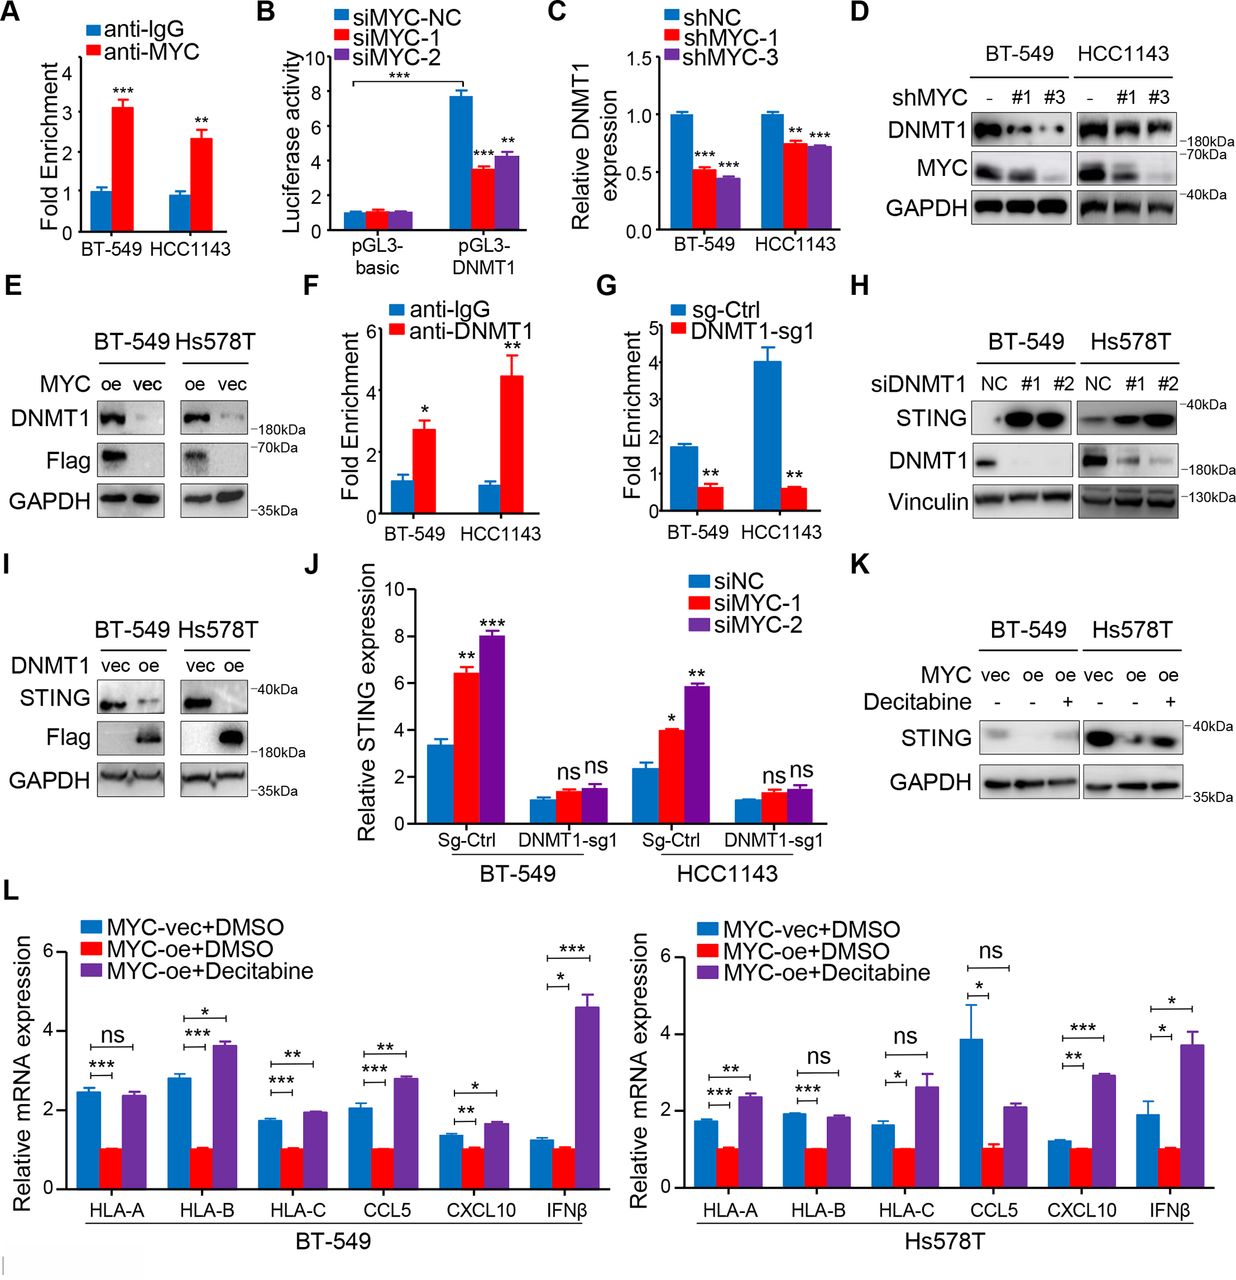
MYC upregulates the transcription of DNMT1 and suppresses the STNG-dependent interferon response. (A) ChIP-qPCR for MYC with IgG control at DNMT1 promoter in BT-549 and HCC1143 cells. (B) HEK-293T cells transiently transfected with the pGL3-DNMT1 promoter were transfected with MYC-siRNAs or NC-siRNA after 8 hour and assayed for luciferase activity. (C) RT-qPCR analyses of DNMT1 mRNA expression in BT-549 and HCC1143 cells with MYC knockdown. (D) Immunoblotting analyses of DNMT1 expression in BT-549 and HCC1143 cells with MYC knockdown. (E) Immunoblotting analyses of DNMT1 expression in BT-549 and Hs578T cells overexpressing MYC. (F) ChIP-qPCR for DNMT1 with IgG control within the 5′ UTR of STING in BT-549 and HCC1143 cells. (G) Levels of DNA methylation within the 5′ UTR of STING after DNMT1 knockdown. (H, I) Immunoblotting analyses of STING expression in BT-549, HCC1143 cells with transient DNMT1 knockdown (H) or overexpressing DNMT1 (I). (J) RT-qPCR analyses of STING mRNA expression in BT-549 and HCC1143 cells transfected with MYC-siRNAs or NC-siRNA in the negative control and DNMT1-knockdown groups. (K) Immunoblotting analyses of STING expression in negative control or MYC-overexpressing BT-549 and Hs578T cells treated with or without decitabine. (L) RT-qPCR analyses of MHC-I, CCL5, CXCL10 and IFNβ mRNA expression in negative control or MYC-overexpressing BT-549 and Hs578T cells treated with or without decitabine. The data are presented as the mean±SEM (A, B, C, F, G, J, L); n=3 independent experiments (A, B, C, F, G, J, L); two-tailed unpaired Student’s t test (A, B, C, F, G, J, L). *P<0.05; **P<0.01; ***P<0.001. NS, not significant; RT-qPCR, quantitative reverse transcription PCR; SEM, standard error of mean; 5′ UTR, 5′ untranslated region.
Furthermore, we found that STING expression could be rescued when DNMT1 expression was knocked down with si-RNAs (figure 5H), and STING was silenced after DNMT1 was overexpressed at the protein level (figure 5I). Compared with the control cells, knockdown of MYC did not significantly upregulate STING at the transcriptional level in the DNMT1-knockdown cells (figure 5J). The results indicate that MYC-mediated transcriptional upregulation of STING is dependent on DNMT1 in TNBC cells.
In further support of MYC-mediated DNMT1 suppression as the trigger for this cascade of events, overexpression of DNMT1 in tumor cells attenuated the 10058-F4-induced increase in the mRNA expression of dsDNA response genes including HLA-A/B/C, CCL5, CXCL10 and IFNβ (online supplemental figure S7C).
We further showed that decitabine, an Food and and Drug Administration (FDA)-approving DNMT1 inhibitor, restored the STING protein expression induced by MYC overexpression and enhanced HLA-A/B/C, CCL5, CXCL10 and IFNβ expression in MYC-overexpressing TNBC cell lines (figure 5K,L). Because PD-L1 expression is linked to downstream IFN signaling, we also confirmed that decitabine significantly enhanced PD-L1 expression in TNBC cells at both mRNA and protein levels (online supplemental figure S7D–F).
Thus, we propose that the MYC-DNMT1 axis mediates suppression of the STING-dependent IFN pathway and its downstream consequences. In addition, we demonstrate that decitabine possibly reverses MYC-induced immune suppression in the TIME.
Decitabine in combination with PD-1 inhibitor reduces tumor growth by stimulating antitumor T cell immunity
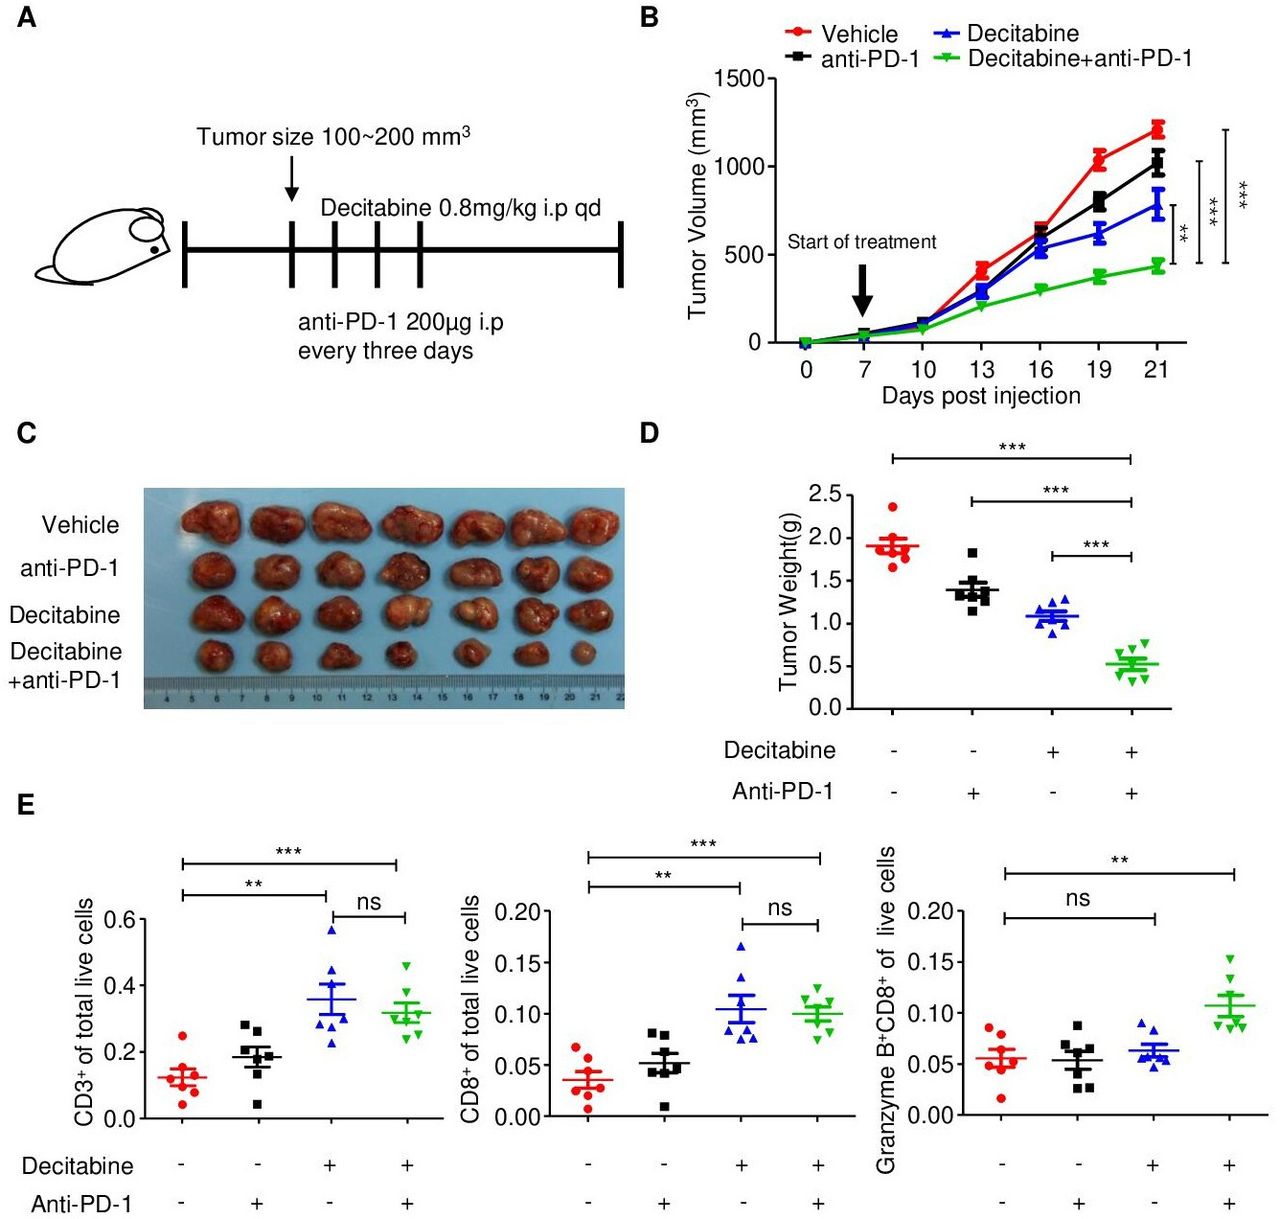
To test whether decitabine can effectively prime tumors for response to immunotherapy in vivo, we established subcutaneous 4T1 TNBC tumors with MYC overexpression in immunocompetent BALB/c mice. When tumors reached an average tumor volume of 100–200 mm3, we treated the mice with either vehicle or decitabine, and a control IgG or an anti-PD-1 antibody (figure 6A).

Decitabine in combination with PD-1 inhibitor reduces tumor growth by stimulating antitumor T cell immunity. (A) Schematic outline of decitabine and anti-PD-1 treatment for tumors: MYC-overexpressing 4T1 mouse breast cancer cells were subcutaneously injected into BALB/c mice. when tumors reached 100–200 mm3, the mice were treated with isotype control, anti-PD-1 antibody (200 µg i.p. injection every 3 days) and/or decitabine (0.8 mg/kg i.p. once a day) (n=7 mice/group) until the mice met the treatment endpoint. (B) Growth of subcutaneous 4T1-MYC-oe tumors in the four groups. The black arrow indicates the treatments. (C) Representative images of the 4T1-MYC-oe subcutaneous breast tumors in each group. (D) Tumor weight of each group at the time of sacrifice. (E) Scatter plots showing the percentage of CD3+, CD8+ and CD8+granzyme B+ cells in the four treatment groups determined by flow cytometry. The data are presented as the mean±SEM (B, D, E); one-way ANOVA test after adjusting for multiple comparisons (B); two-tailed unpaired Student’s t-test (D, E). **P<0.01; ***P<0.001. ANOVA, analysis of variance; NS, not significant; PD-1, programmed cell death protein 1; SEM, standard error of mean.
Compared with control treatment, anti-PD-1 monotherapy had little effect on tumor growth, and decitabine substantially delayed tumor growth. The combination of decitabine and anti-PD-1 therapy significantly inhibited tumor growth compared with control treatment or monotherapy (figure 6B-D). During the treatment period, the body weight of the mice in the four groups did not substantially change, partially reflecting the safety of the combination treatment (online supplemental figure S8A).
To further validate the antitumor immune response induced by the decitabine and anti-PD-1 antibody combination, we analyzed and compared the number of tumor-infiltrating T cells in subcutaneous tumors in the four treatment groups. Specifically, flow cytometric analysis of immune cell subsets in tumors treated with decitabine showed that DNA methyltransferase inhibition significantly increased the proportions of CD3+ and CD8+ T cells among total live events (figure 6E; online supplemental figure S8B). Consistent with the flow cytometry, CD3 and CD8 immunohistochemical staining, were significantly increased in response to decitabine (online supplemental figure S8C,D). Furthermore, combination treatment with the PD-1 inhibitor further augmented granzyme B expression in CD8+ T cells, which was confirmed by both flow cytometry and immunohistochemical staining (figure 6E; online supplemental figure S8C,D).
To further verify the dependence of decitabine’s antitumor effect on tumor-expressed STING, we established a STING-knockdown BALB/c-derived 4T1.2 cell line (online supplemental figure S9A). In vitro, as compared with the negative control, STING knockdown abolished the decitabine-induced enhancement of STING and downstream MHC-I expression in 4T1.2 cells (online supplemental figure S9B). We found that, compared with negative control (Sg-Ctrl) tumors, STING-KO tumors showed limited response to decitabine, confirming that the decitabine’s antitumor efficacy is largely dependent on tumor-expressed STING (online supplemental figure S9C).
Together, these findings demonstrate that targeting DNMT1 with decitabine stimulates antitumor T cell immunity and that combination treatment with PD-1 inhibitor represents a novel strategy in MYC-overexpressing TNBC.
Clinical validation of the MYC-DNMT1-STING axis in TNBC patient samples
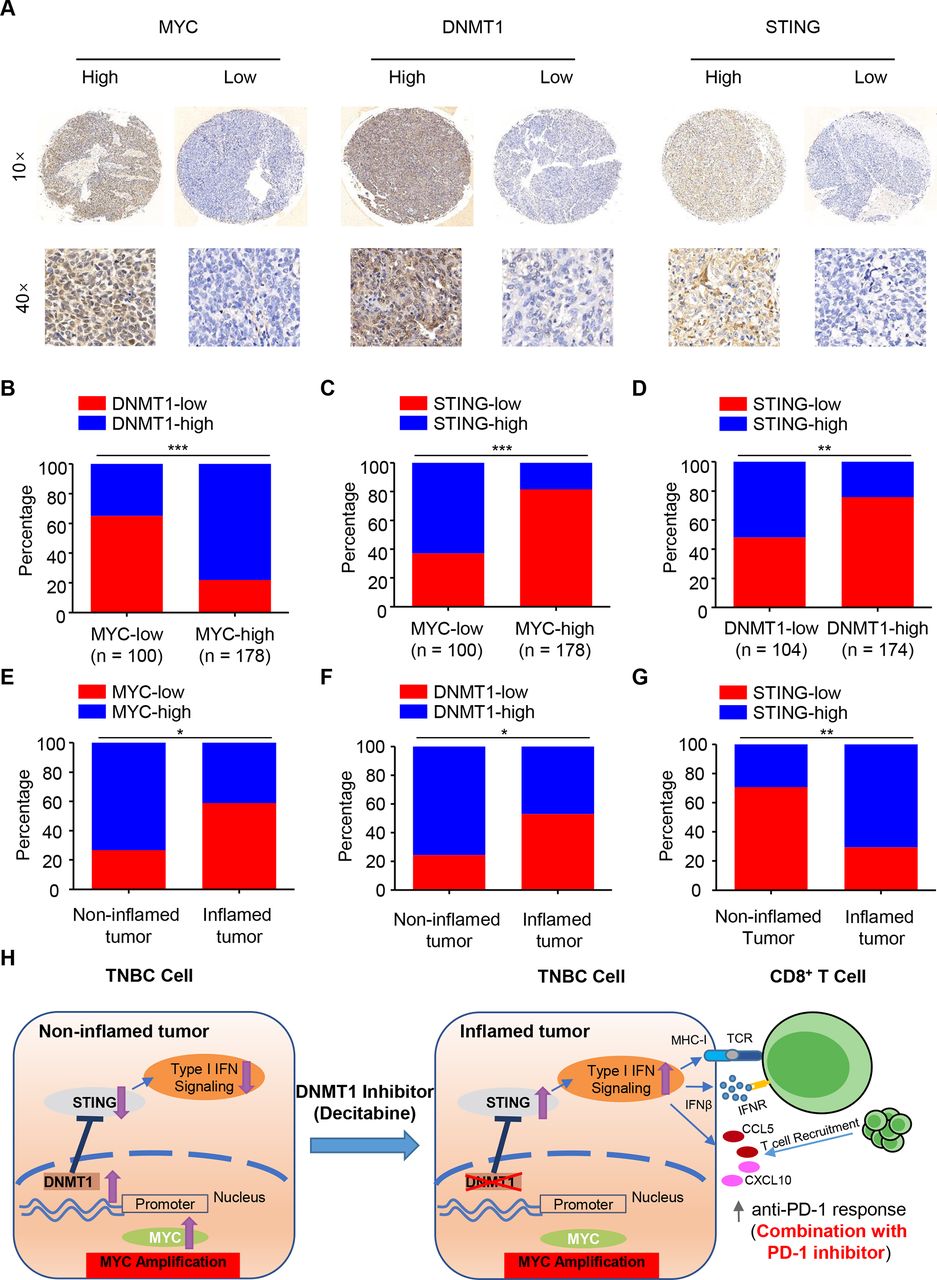
To further validate our findings in human TNBC samples, we investigated the protein expression levels of MYC, STING and DNMT1 in a cohort of TNBC patients by IHC analysis of tissue microarray (n=278). According to the positive staining and intensity of these three indicators, all the samples were divided into high- and low-expression groups (figure 7A). Our pathology results showed that MYC levels were positively correlated with DNMT1 and negatively correlated with STING levels, respectively (both were p<0.001, figure 7B,C), while DNMT1 levels were negatively correlated with STING levels in the cancer tissues (p<0.01, figure 7D). As predicted, the MYC-DNMT1-STING axis also showed a consistent expressing pattern in non-inflamed and inflamed tumors (n=41 and 17, respectively, figure 7E-G).
Clinical validation of the MYC-DNMT1-STING axis in TNBC patient samples. (A) Immunohistochemical staining of human breast cancer tissue arrays using specific antibodies for MYC, DNMT1 and STING. (B–C) The expression levels of DNMT1 (B) and STING (C) in 278 breast cancer tissues stratified according to the MYC level. (D) The expression levels of STING in 278 breast cancer tissues stratified according to the DNMT1 level. (E–G) The expression levels of MYC (E), DNMT1 (F) and STING (G) in 58 breast cancer tissues in non-inflamed and inflamed tumors of TNBC (n=41 and 17, respectively). (H) A working model for how MYC drives the “non-inflamed tumor” microenvironment and decitabine converts this microenvironment into ‘inflamed tumor’ microenvironment, sensitizing TNBC to anti-PD-1 blockade. chi-square test (B-G). *P<0.05; **P<0.01; ***P<0.001. PD-1, programmed cell death protein 1.
Discussion
Based on the original dataset generated at our center and previous work, we speculated that MYC amplification and subsequent overexpression, might be the key genomic event driving the formation of the non-inflamed TIME in TNBC. Using orthotopic animal models of TNBC, we validated our assumption and demonstrated that TNBC-intrinsic MYC impaired T cell infiltration and cytolytic function in vivo. In vitro molecular studies further showed that MYC transcriptionally upregulated DNMT1, thus repressing the type I IFN response via epigenetic suppression of STING (figure 7H). Based on these findings, we proved that decitabine, an FDA-approved DNA methyltransferase inhibitor, significantly reduced tumor growth when combined with anti-PD-1 blockade in mice and that combination treatment could potentially be a novel strategy for MYC-overexpressing TNBC (figure 7H).
TNBC is intrinsically a highly heterogeneous disease.3 4 In recent years, major efforts have been devoted to classifying TNBC into distinct clinical or molecular subtypes and proposing possible treatment targets mainly based on transcriptomic subtyping.31 32 Increasing evidence indicates that the TIME, which includes tumor cells, tumor stroma and immune cells, plays a key role in determining the response to immunotherapies.33 Previous work revealed that TNBC was heterogeneous in terms of the TIME and consisted of various distinct microenvironmental phenotypes.8–10 Consistently, our study showed that classical basal-like breast cancer segregated into inflamed and non-inflamed immunosubtypes, with the latter phenotype characterized by absence of immune infiltration and cytolytic function as determined by the gene signature or IHC staining.
Emerging evidence implies that the Cyclic GMP-AMP synthase (cGAS)-STING pathway plays a critical role in bridging innate immunity and adaptive immunity in tumors.34 In general, it is well-known that activation of this pathway in dendritic cells primes T cells and enhances cytotoxic T cell activity.35 However, an increasing number of studies are focusing on the cancer cell-intrinsic cGAS-STING pathway instead of the systemic signaling pathway. Pantelidou et al36 found that olaparib could enhance CD8+ T cell infiltration and activation through activation of the tumorous cGAS-STING pathway in HR-deficient TNBC cells. Similarly, this mechanism was also found in lung cancer.37 Interestingly, one study by Schadt et al38 also reported that cancer-cell-intrinsic expression of cGAS determined tumor immunogenicity and shaped the inflamed microenvironment in melanoma. These studies emphasized the significance of the tumor-intrinsic cGAS-STING pathway in promoting T cell immunity in the TIME and enhancing the efficacy of immunotherapy. However, STING is commonly silenced in various cancer cells via unclear mechanisms.39 40 Subsequently, cancer cells can evade immunosurveillance through the inactivation of cGAS-STING signaling. Our study, to the best of our knowledge, is the first to find that MYC led to immune escape via repressing STING-dependent innate immunity in TNBC cells. We hypothesized that, MYC, as a highly-overexpressing gene with the highest frequency of amplification in TNBC, regulates STING expression to a greatly negative extent and ultimately leads to the non-inflamed TIME.
Following the above findings, we further demonstrated that DNMT1, as a downstream target gene of MYC, could epigenetically repress STING expression by enhancing DNA methylation of the STING promoter. In general, epigenetic changes have long been recognized as hallmarks contributing to tumorigenesis and tumor maintenance.41 Among these modifications, DNA methylation induces silencing of tumor suppressors and expression of endogenous retroviral sequences, thus suppressing viral mimicry.42 For example, a study by Sheng et al43 found that ablation of the histone demethylase LSD1 in cancer cells resulted in dsRNA stress and activation of type I IFN signaling, thus stimulating antitumor T cell immunity and restraining tumor growth. In addition, CDK4/6 inhibitors were found to promote cytotoxic T cell-mediated clearance of breast tumor cells by modulating DNMT1.44 More importantly, some studies have shown that the expression levels of cGAS and STING are inversely correlated with DNA methylation in colorectal cancer, lung cancer and melanoma cells.29 45 Those findings are also in line with our study results.
Correspondingly, inhibitors of epigenetic regulators have been extensively developed for cancer treatment in recent years.46 In a recent study in 2018, decitabine, an FDA-approved inhibitor targeting DNMT, was demonstrated to be highly effective in TNBC cases with high DNMT levels.47 However, increasing evidence has also shown that, in addition to their effects on tumor cells, epigenetic inhibitors also play important roles in shaping the TIME.48 In the current study, we first demonstrated that decitabine could reverse non-inflamed tumors into inflamed TNBC tumors and combination treatment with PD-1 inhibitor effectively reduced tumor growth in MYC-overexpressing TNBC in vivo.
As shown in our study, treatment with decitabine could produce higher levels of cytokine secretion that functions to enhance CD8+ T cell recruitment, and it has also been proved via in vivo experiments in our study that decitabine could enhance the infiltration of CD8+ T cells. In addition, treatment with decitabine promote the secretion of IFNβ in vitro, which is known to improve cytolytic function of T cells, but this finding was seemingly not consistent with in vivo studies of ours that decitabine did not significantly improve T cell function measured by granzyme B. We speculated that the inconsistency between in vivo and in vitro experiments might be explained by the existence of PD-1/PD-L1 pathway between T cells and tumor cells in vivo. Specifically, in our study, treatment with decitabine could enhance the PD-L1 expression on the tumor cell surface in vitro, and this had also been reported in other types of cancers.29 49 Thus, the upregulation of PD-L1 repressed T cell function by binding to PD-1, possibly neutralizing IFNβ-induced effects. Correspondingly, in vivo studies also showed that the combination of decitabine with PD-1 inhibitor could reverse immunosuppression and enhance the T cell function.
Although we validated the efficacy of the combination treatment in mouse models, the conclusions in our study demand clinical trials combining decitabine with ICB to determine whether this combination can enhance the potency of antitumor immune responses in patients with MYC-overexpressing TNBC.
In conclusion, our results reveal an epigenetic-based mechanism of suppression of STING-dependent innate immunity mediated by the MYC-DNMT1 axis in TNBC. Furthermore, decitabine could convert non-inflamed tumors into inflamed tumors to enhance the antitumor immune response, which potentially suggests the promise of a combination anticancer treatment including immunotherapy and decitabine for TNBC treatment.
Data availability statement
All data relevant to the study are included in the article or uploaded as online supplemental information.
Ethics statements
Ethics approval
The ethics committee/Institutional Review Board of the Fudan University Shanghai Cancer Center Ethical Committee.
Acknowledgments
We thank all patients and their families who participated in the studies that form the basis of this work.
References
Supplementary materials
Supplementary Data
This web only file has been produced by the BMJ Publishing Group from an electronic file supplied by the author(s) and has not been edited for content.
Footnotes
S-YW, YX and J-LW contributed equally.
Contributors Z-MS and Y-ZJ conceived the study and designed research. S-YW, YX, J-LW, performed experiments and acquired data. S-YW, YX analyzed and interpreted data, and drafted the paper. X-EX, XJ, XH and D-QL gave methodological support, conceptual advice, and edited the paper.
Funding This study was supported by the National Key Research and Development Project of China (2020YFA0112304), the National Natural Science Foundation of China (82002792), the Shanghai Sailing Program (19YF1409000, 20YF1408600), the Innovation Team of Ministry of Education (IRT1223) and the Shanghai Key Laboratory of Breast Cancer (12DZ2260100).
Competing interests None declared.
Provenance and peer review Not commissioned; externally peer reviewed.
Supplemental material This content has been supplied by the author(s). It has not been vetted by BMJ Publishing Group Limited (BMJ) and may not have been peer-reviewed. Any opinions or recommendations discussed are solely those of the author(s) and are not endorsed by BMJ. BMJ disclaims all liability and responsibility arising from any reliance placed on the content. Where the content includes any translated material, BMJ does not warrant the accuracy and reliability of the translations (including but not limited to local regulations, clinical guidelines, terminology, drug names and drug dosages), and is not responsible for any error and/or omissions arising from translation and adaptation or otherwise.