Article Text

Abstract
Background Metformin is a commonly used antidiabetic medication which has demonstrated promise as an anticancer agent alone and in combination with conventional treatment regimens. There is increasing evidence that metformin can also generate immunomodulatory effects in solid tumors and is currently being investigated as an adjunct to immune checkpoint inhibitors (ICIs). We hypothesized that metformin would generate a shift in immunity unfavorable to tumor growth and tested this hypothesis in a preclinical model of head and neck cancer.
Methods Using a syngeneic mouse model of human papillomavirus-associated head and neck cancer (mEER/MTEC), we tested the impact of metformin on systemic and local immunity and tumor growth velocity. We compared the effects of acute and chronic treatment regimens on immunocyte presence and activation using a combination of flow cytometry and targeted transcriptomic analysis.
Results Acute metformin exposure generated measurable shifts in systemic myeloid and T-cell populations in non-tumor-bearing mice and decreased myeloid derived suppressor cell (MDSC) levels in tumor draining lymph nodes of tumor-bearing mice. Although metformin decreased regulatory T-cell (T-reg) and MDSC levels and increased CD8+ levels in murine tumors when combined with ICIs, acute metformin exposure was insufficient to generate substantial antitumor activity. Conversely, long-term metformin treatment significantly reduced tumor growth velocity, increased the CD8+/T-reg ratio, increased tumor infiltrating lymphocyte levels and upregulated component genes of the previously validated T-cell inflamed expression profile.
Conclusions Metformin generates complex systemic and local immune effects which vary as a function of treatment duration. Combinatorial strategies with ICIs must take into account both the complexity and variability of these effects in order to generate maximal antitumor activity in future clinical trials.
- T-lymphocytes
- head and neck neoplasms
- drug evaluation
- preclinical
- myeloid-derived suppressor cells
Data availability statement
Data are available on reasonable request. All data relevant to the study are included in the article or uploaded as online supplemental information. All data not explicitly included in the accompanying tables and figures will be made available on reasonable request.
This is an open access article distributed in accordance with the Creative Commons Attribution Non Commercial (CC BY-NC 4.0) license, which permits others to distribute, remix, adapt, build upon this work non-commercially, and license their derivative works on different terms, provided the original work is properly cited, appropriate credit is given, any changes made indicated, and the use is non-commercial. See http://creativecommons.org/licenses/by-nc/4.0/.
Statistics from Altmetric.com
Background
Metformin is a safe, commonly used antidiabetic medication administered to millions of patients throughout the USA each year.1 2 Retrospective human studies in multiple solid tumors have demonstrated that patients with cancer taking metformin have superior oncological outcomes compared with control cohorts.3–6 This effect does not appear to be related to relative level of glycemic control, suggesting that metformin has direct effects on tumor biology. Preclinical studies in head and neck squamous cell carcinoma (HNSCC) by us and others have shown that metformin can activate intracellular energetic pathways (eg, AMPK) and directly inhibit mitochondrial respiration (complex I of the electron transport chain).7–12 When combined with conventional chemotherapy and/or radiation, metformin has shown substantial antitumor efficacy in preclinical models.11–13 Metformin has shown promise in phase I and phase II clinical trials in several disease sites including HNSCC with respect to antitumor activity, and most importantly safety and tolerability.14–17 Unfortunately, a recently completed, large, randomized clinical trial testing its effect when combined with chemoradiation in lung cancer did not demonstrate a detectable benefit for overall or progression-free survival.18
It has become clear over the last 5 years that in addition to direct intratumoral activity, metformin can perturb the tumor immune microenvironment (TIME) via multiple mechanisms.19–21 In some preclinical models this results in potentiation of effectiveness for immunomodulatory agents such as immune checkpoint inhibitors (ICIs).20 However, the precise effects of metformin on systemic and tumor immunity remain unclear, particularly in the context of HNSCC. The most translationally relevant data to date in HNSCC were generated by Amin et al in a window of opportunity study which evaluated presurgical specimens.22 23 Metformin treatment was associated with a significant decrease in intratumoral FOXP3+ T lymphocytes and an increase in CD8+ T lymphocytes, independent of human papillomavirus (HPV) status.
The dual effects of metformin on intrinsic tumor biology and TIME pose significant challenges for clinical translation. Since there is now evidence that even conventional HNSCC treatments such as chemotherapy and radiation impact TIME and TIME can impact treatment effectiveness, it is imperative that we understand how metformin can impact tumorigenesis in the context of a competent immune system.24–26 In the current study, we sought to characterize the effects of metformin on systemic immunity as well as the TIME in the context of a preclinical model of HPV-associated HNSCC previously shown by our collaborators to appropriately mimic the limited response to both conventional chemo-radiation and ICIs demonstrated in many HNSCC patients to date.24–27 In addition, we sought to identify potential explanations for the mixed clinical efficacy results reported in recent clinical trials.
Methods
Animal utilization
The primary objectives of this study were to evaluate the effects of metformin on (1) systemic and local immunity and (2) tumor growth inhibition in a mouse model of HPV-induced head and neck cancer. Wild-type C57BL/6 J 6–8 weeks old male and female mice used in the experiments were purchased either from The Center for Comparative medicine, Baylor College of Medicine (BCM) or Jackson Laboratory. These mice were housed at 4–5 per cage under specific pathogen-free conditions in appropriate lighting and temperature conditions with free access to food and water. Tumor inoculation was performed when mice reached 7–9 weeks of age. All animal experiments were conducted in facilities at the BCM, Houston, Texas, USA. The study protocols used in the in vivo studies have been reviewed and approved prior to initiation of the study by the Institutional Animal Care and Use Committee at BCM. The precise number of mice used within each experiment is presented in the corresponding figure legend.
Murine tumor models
Two mouse cell lines (mEER and mEERL95) stably expressing HPV16 E6-E7 proteins and oncogenic H-ras were used in the current studies. The mEER cell line established by in vitro transformation of male murine pharyngeal epithelial cells with HPV16 E6–E7 proteins and oncogenic H‐ras was obtained from Chad Spanos at the Sanford Research center/University of South Dakota and maintained in E-media as described by Spanos et al.28 The mEERL95 cell line derived from a tumor explant of the original mEERL cell line implanted in a C57BL/6J female mouse, is suitable for preclinical and mechanistic related studies on HPV-related head and neck cancer in immunocompetent mouse models using both female and male mice as tumor cell recipients. This was obtained from University Hospital of Lausanne, Department of Otolaryngology, Head and Neck surgery and maintained in Dulbecco’s modified Eagle medium/nutrient mixture F‐12 culture medium with supplements as described previously.29 In the current study, mEER was used in male mice and mEERL95 was used in female mice. Tumor cells in culture were harvested at 80% confluency, washed, counted and resuspended in sterile phosphate buffered-saline (PBS) before injection into mice. C57BL/6 J male and female mice were injected subcutaneously with 106 mEER and mEERL95 cells respectively in the left flank. The mice were monitored two times per week and the tumor growth was measured using calipers. Tumor area (mm2) was calculated as A=L x W where L is length and W is width. The mice were sacrificed when either their tumors reached 225 mm2, or if the tumors became severely ulcerated or necrotic and started to interfere with their well-being.
In vivo treatment
Tumors were allowed to develop for 18–21 days to an average size of 65 mm2 prior to the treatment (tumors were randomized to treatment). Order of treatment and measurements were varied as to minimize potential confounder effects. Metformin hydrochloride (M2009-100G; Spectrum Laboratory Products) was administered either intraperitoneally (i.p solubilized in PBS) at a concentration of 40 mg/kg of mice weight once daily for varying timelines in a total of 100 µL injection volume or in drinking water at a concentration of 5 mg/mL. ICI, InVivoMAb anti-mouse programmed cell death protein 1 (PD-1) (clone RMP1–14; BioXCell; 250 µg per dose) and/or InVivoMAb anti-mouse cytotoxic T-lymphocyte associated protein 4 (CTLA-4) (clone 9H10; BioXCell; 100 µg per dose), were administered using i.p. injections as previously described by our collaborators.24 25
Assessment of immune microenvironment by flow cytometry
To assess the tumor immune cell infiltration, the tumors were harvested, processed, and stained as described previously.24 25 Briefly, tumors were digested at 37°C for an hour in a digestion cocktail buffer prepared in Roswell Park Memorial Institute (RPMI) 1640 medium (Sigma-Aldrich) containing DNase I (20 U/mL; Sigma-Aldrich), Collagenase I (1 mg/mL; EMD Millipore) and Collagenase IV (250 U/mL; Worthington Biochemical Corporation), followed by mechanical disruption to form single cell suspensions. Single cell suspensions were also prepared from blood, spleen, and inguinal lymph nodes with spleen and blood needing an additional lysis of the red blood cells (RBC) using Invitrogen’s RBC lysis buffer. Cells were blocked with the anti-mouse CD16/CD32 Fc block (BD Biosciences) and then separately stained for the extracellular T-cell and the myeloid cell antibodies panel with details of all the antibodies included in online supplemental table S1. For intracellular antibody staining cells were first fixed and permeabilized (eBioscience Intracellular Fixation and Permeabilization Buffer Set; Invitrogen). Data for both antibody panels were acquired on LSRFortessa (BD Biosciences) flow cytometer and analyzed using FlowJo V.10 software (FlowJo). Gating strategies are outlined in online supplemental figure S1.
Supplemental material
Supplemental material
Supplemental material
Immune profile expression analysis
Total RNA was extracted from the flash frozen metformin treated and untreated tumor tissues harvested on day 36 from the chronic metformin exposure experimental group using the Qiagen’s RNeasy Mini Kit as per the manufacturer’s instructions. RNA sample quality was assessed on the Bioanalyzer prior to gene expression profiling (GEP). Assays were performed with approximately 100 ng total RNA using the nCounter PanCancer Immune Profiling Panel for mouse (NanoString Technologies) containing 770 genes involved in cancer immune response. GEP was performed using the NanoString nCounter Gene Expression system. The process in brief includes the hybridization of total RNA with the NanoString assay panel containing 770 unique pairs of reporter probes, biotin-labeled capture probes and internal reference controls. Excess probes were then removed with magnetic bead purification on the nCounter Prep Station (software V.4.0.11.2) on the High Sensitivity assay. The samples were then quantified by identifying the fluorescent spots using the nCounter Digital Analyzer (software V.3.0.1.4). Raw data were analyzed using NanoString’s nSolver Analysis Software. Raw read counts were normalized, background subtracted, and assessed for cell type score and differential gene expression using NanoString nSolver (V.4.0) following the manufacturer’s instructions under the R computation environment (R V.3.4.0). Genes with a fold-change larger than 1.5 and an adjusted P value (Benjamini-Yekutieli procedure) of less than 0.05 between the control and treated groups were analyzed further. Using differential gene expression analysis, the metformin treated group demonstrated a statistically significant expression change with a Benjamini-Yekutieli false discovery rate corrected p<0.01 in 130/710 genes (online supplemental table S2). All the genes were categorized into gene sets based on their immune response category. The results from the differential expression testing for all the genes were then summarized at the gene set level, where most differentially expressed genes from each gene sets were identified to generate a directed ‘global significance score’, calculated as a square root of the mean signed squared t-statistic for the genes in a gene set, with t-statistics coming from the linear regression underlying the differential expression analysis. All the gene sets were found to be upregulated in the metformin treated group (details on the ‘directed global significance score’ for each gene set in online supplemental table S3) and these results were confirmed in the volcano plot displaying each gene -log10 (p value) and log2 fold change in the metformin treated versus untreated groups. Immune infiltrate cell type profiling was done to estimate the relative abundance of each cell type and a tumor infiltrating lymphocyte (TIL) score was calculated from the abundance of all the considered cell populations together. Relative cell type measurement evaluated more subtle patterns in the TIL landscape considering the variable amounts of total immune infiltrates between samples; relative versus total TIL values in the samples were compared against the treatment covariant.
Clinical dataset
Subsequent to receiving approval from BCM’s and the Michael E. DeBakey Veterans Affairs Medical Center’s Institutional Review Boards, we reviewed the records of Veterans with a diagnosis of oropharyngeal squamous cell carcinoma between January 1, 2000 and January 1, 2015. All collection and analysis of the current data was performed in a manner consistent with existing standards for clinical research (Declaration of Helsinki, US Federal Policy for the Protection of Human Subjects). Analysis of TILs was performed on all pretreatment tumor specimens as previously described using conventional immunohistochemistry coupled to quantitative imaging.30
Statistical analysis
Analysis was performed using GraphPad Prism V.8 software and the statistical significance was determined using either unpaired t test for two-tailed data or analysis of variance test followed by selected comparison using Tukey’s multiple comparison tests with multiple comparison correction (*p < 0.05; **p < 0.01; ***p < 0.001; ****p < 0.0001; ns, non-significant). All error bars indicate SE of measurement unless indicated otherwise.
Results
Acute metformin treatment causes significant shifts in systemic immunity in both non-tumor and tumor-bearing mice
Wild type C56BL/6J mice without any manipulation (ie, tumor inoculation) were treated with metformin or saline (PBS) control administered i.p for five consecutive days; inguinal nodes and spleen were harvested from all animals and were analyzed for the T cell and myeloid subsets by flow cytometry. A substantial decrease in the total immune cell population was observed in the spleens of metformin-treated mice. This change was consistent across all the subpopulations of CD11b+ cells, dendritic cells and CD3+ cells. The inguinal lymph nodes also showed a similar pattern with an overall decrease in all the T-cell and myeloid populations in the metformin treated group with the exception of dendritic cells (online supplemental figure 2). We next evaluated the effect of acute metformin exposure on systemic immunity in tumor-bearing mice. In mice carrying established mEER tumors, metformin treatment triggered an increase in the number of CD4 +T cells and a decrease in CD4 +FOXP3+T-regulatory cells and LY6G+ granulocytic myeloid derived suppressor cells (G-MDSCs) in tumor-draining lymph nodes, whereas all the other T-cell and myeloid populations showed no change between the treated and control groups. Metformin treatment significantly decreased the G-MDSCs in the spleens of treated mice. No significant differences in any other cell populations were observed (figure 1).
Supplemental material

Systemic and regional immune modulation by acute metformin exposure in tumor bearing mice. C57BL/6J male mice were inoculated subcutaneously with 1×10⁶ mEER cells and the tumors were allowed to establish to an average size of 65 mm2 prior to treatment initiation. Beginning on day 18, metformin treated mice (n=5) received five consecutive daily doses of metformin (40 mg/kg) and control mice (n=8) received PBS delivered intraperitoneally. All mice were euthanized on day 23 post-tumor inoculation and tumor, spleen and draining lymph nodes (dLN) were harvested from the mice accordingly. Flow cytometry was used to characterize T-cell and myeloid cell subsets in spleen and inguinal lymph node (A) and tumor (B) tissues. Data are presented as means with error bars denoting SD. Experiment performed once. *p<0.05; **p<0.01; ns, not significant; PBS, phosphate buffered-saline.
Acute metformin treatment in combination with ICI is accompanied by increased tumor immune infiltration
We previously showed limited ICI activity in this HNSCC model, even when combined with conventional chemoradiation regimens.25 Based on the significant effects of metformin identified above, we sought to determine whether metformin exposure would shift TIME in the context of ICI treatment. As shown in figure 2, metformin treatment generated a shift towards substantial protective immune modulatory effects in both tumor and spleen tissue with a decrease in regulatory T-cells (Treg) and G-MDSCs and an increase in CD8+, CD4+, monocytes and dendritic cells. Ki67 expression is upregulated in proliferating T cells and an upregulation of specifically Ki67 +PD1+CD8+ and Ki67 +PD1+CD4+cell responses are elicited in the group treated by metformin and checkpoint inhibitors. Despite the favorable immune shifts noted, no changes were seen in tumor growth delay as a function of metformin treatment over this short time course even when combined with ICI treatment although this experiment was geared primarily to measurements of shifts in TIME rather than tumor growth delay effects (figure 2).

Metformin shifts tumor, regional and systemic immunity when combined with ICIs. Male mice were inoculated subcutaneously with 1×10⁶ mEER cells; tumors were allowed to develop for 18 days to an average size of 65 mm2 prior to treatment. Beginning on day 18 mice received five consecutive daily doses of metformin (40 mg/kg) delivered i.p. with (n=8) or without (n=6) immune checkpoint inhibitors (red line indicates time period of administration). Anti-PD-1 (250 μg/dose) and anti-CTLA-4 (100 μg/dose) checkpoint inhibitors were delivered on days 19 and 22 i.p. All mice were euthanized at day 23 post-tumor inoculation when tumors were all still approximately equal in size (~100 mm2). Tumor, spleen and tumor draining lymph nodes (tdLN) were harvested, processed and stained for flow cytometric analysis (A). tumor growth curves were generated from the available tumor measurements over the time period analyzed (B). Experiment performed once. DC, dendritic cell; ICIs, i.p., intraperitoneally.
Acute metformin exposure has no effect on tumor growth delay
Given the substantial immunomodulatory effects noted for acute metformin exposure, we sought to clarify whether these shifts are sufficient to generate antitumor activity in a dedicated experiment. As shown in figure 3, metformin treatment delivered either i.p or in drinking water failed to arrest tumor growth to any significant degree. Systemic immune profiling by flow cytometry analysis did not show any differences in the CD8+ and the CD4 +T cell types between the treated and the untreated mice in this experiment. A statistically significant decrease in the Treg population was observed in the metformin i.p treated group, and this was reflected in an increased CD8 +T cell/Treg ratio as well in this group, but no change was seen in the metformin in drinking water group (figure 3). In the myeloid cell subtypes, only an increase in the inflammatory monocytes was seen in the group that received metformin in drinking water. Even though there were beneficial immunomodulatory effects observed (ie, increase in the CD8 +T cells/Treg ratio, increase in inflammatory monocytes), these acute responses were apparently insufficient to mount a substantial antitumor response.

Acute metformin exposure does not impact tumor growth. Mice were inoculated subcutaneously with 1×10⁶ mEER cells. Tumor-bearing mice were treated with PBS, metformin delivered intraperitoneally (40 mg/kg; 5 days/week) or metformin solubilized in drinking water (0.5 mg/100 mL). (A) Tumor volume was measured throughout the treatment period in all three treatment arms; no difference was noted between the arms (Tukey’s multiple comparison test; n=9–10 mice/group, n=2 experiments, *p<0.05; **p<0.01; ***p<0.001). (B) Flow cytometry was used to characterize T-cell and myeloid cell subsets in blood at the end of the experimental period. G-MDSCs, granulocytic myeloid derived suppressor cells; i.p, intraperitoneally; PBS, phosphate buffered-saline; Tregs, regulatory T cell.
Chronic metformin exposure effectively delays tumor growth and modulates TIME
In contrast to most preclinical model and clinical trial regimens, including that utilized in figure 3, metformin utilization in retrospective cohorts consists of longitudinal exposure lasting months to years, which predates the initial cancer diagnosis.4–6 In order to partially mimic this regimen, we generated a chronic exposure treatment as outlined in figure 4. Pretreatment with metformin prior to tumor inoculation resulted in a significant and substantial (>50%) reduction in tumor growth velocity. Flow cytometry analysis of the systemic immune response to chronic metformin exposure showed a statistically significant increase in the CD8+ cells in the group treated with metformin in drinking water, but nodifference in the i.p treated metformin group. No significant differences were found in the CD4+ and the Treg types. Similarly, a significant increase in the ratio of CD8+/Tregs was also observed in the metformin in drinking water group but not in the metformin i.p treated group (figure 4). Conversely, analysis of myeloid cell subpopulations showed a beneficial myeloid response in the metformin i.p treated group but not any differences were seen in the group that received metformin in drinking water. An approximate twofold increase in the immune-stimulating myeloid subsets like the dendritic cells and the inflammatory monocytes which have been reported to support antitumor immune responses was seen in the metformin i.p treated group.31 On the other hand, a significant increase in circulating G-MDSCs which are immunosuppressive in nature was observed in the metformin i.p treated group, but this does not correlate with the overall antitumor response seen in this group. This might indicate that the presence of tumor infiltrating MDSCs and not the peripheral MDSCs are responsible for the differences in response to therapy and chronic metformin exposure might serve as an effective approach in combination with other conventional treatment modalities to improve treatment efficacy.

Chronic metformin exposure delays tumor growth. Mice were treated with PBS, metformin delivered intraperitoneally (40 mg/kg; 5 days/week) or metformin solubilized in drinking water (0.5 mg/100 mL) for 4 weeks prior to subcutaneous inoculation with 1×10⁶ female mEER cells (left flank). Treatment continued until the end of the study. (A) Tumor volume was measured throughout the treatment period in all three treatment arms; differences in tumor volume were evaluated at time of first control mouse euthanasia (Tukey’s multiple comparison test; n=5–10 mice per group, n=2 experiments, *p<0.05; **p<0.01; ***p<0.001; ****p<0.0001). (B) Flow cytometry was used to characterize T-cell and myeloid cell subsets in blood at the end of the experimental period. DCs, dendritic cell; i.p, intraperitoneally; PBS, phosphate buffered-saline; Tregs, regulatory T cell.
Chronic metformin treated tumors are characterized by an increased immune infiltrate
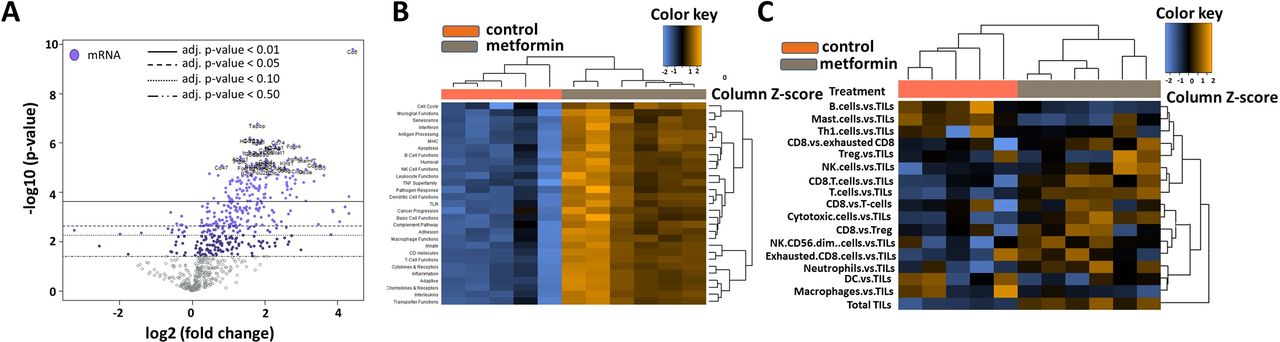
Tumors from the chronic metformin exposure and the untreated control groups were comprehensively profiled for immune-related gene expression using Nanostring’s mouse PanCancer Immune Profiling Panel (figure 5). The housekeeping genes that are used for the normalization of the data showed stable expression level across all the samples. Metformin treatment was the covariate used in the analysis. A global distribution of the p values for the experiment generated by testing each gene’s univariate association with the covariate showed a significant mass of data with low p value strong evidence for an association between the covariate and the gene expression data (online supplemental figure 3B). Normalized data were used to generate a heatmap via unsupervised hierarchical clustering, wherein the metformin treated samples clustered together characterized by an overall upregulation of the immune-related genes (online supplemental figure 3A). Many genes that are associated with T-cell inflamed status (CD8, Stat1, Ccl5, Pdcd1, Tnf, Cd86) (online supplemental table S2) were upregulated in the metformin treated group characterized by their involvement in antigen presenting, MHC and T-cell functions (figure 5). The top gene sets that were upregulated are involved in antigen processing, dendritic cell functions, inflammation and macrophage function (online supplemental table S3). Metformin treated tumors demonstrated high TIL scores with highest infiltration of CD8 +T cells, T cells, natural killer (NK) cells and cytotoxic T cells and a decrease in B-cells, Th1 cells, mast cells when measured against TILs. Plotting of differential expression analysis to known protein-based Kyoto Encyclopedia of Genes and Genomes pathways revealed highest enrichment for the ‘cytokine-cytokine receptor interaction’ (figure 6A) and ‘cell adhesion molecules (CAMs) pathway (figure 6B) along with other pathways such as the JAK-STAT signaling, chemokine signaling and those involved in viral infections. An upregulation of several CC and CXC subfamily chemokines, class I cytokines, TNF family, CAMs involved in the immune system along with and some of their corresponding receptors was seen in the metformin treated group. All observed gene expression changes in tumors treated chronically with metformin represent a shift toward an immune favorable gene expression which has a potential for generating a beneficial antitumor response. An additional analysis was performed focusing on genes included in the previously described T-cell inflamed GEP (T-GEP) which has been correlated with response to blockade of the PD1 therapeutic axis (NKG7 is not available in this panel precluding calculation of an actual T-GEP score).32 33 As illustrated in figure 6C, there was a substantial increase in expression of T-GEP genes in metformin treated tumors.
Supplemental material

Metformin induced shifts in TIME. (A) Differential gene expression profiles for metformin treated vs untreated control groups presented as volcano plot. The log2 fold changes and their cut-offs for adjusted p values are shown. Highly statistically significant genes fall at the top of the plot above the horizontal lines representing the p value thresholds with highly differentially expressed genes falling on either sides of the plot. Statistically significant genes with a p value below the defined threshold are colored and the 40 most statistically significant genes are labeled in the plot. Metformin treated tumors demonstrated a high density of statistically significant upregulated genes with only a very few statistically significant downregulated genes. (B) Heatmap of the upregulated and downregulated gene sets/pathways. (C) Heatmap of the different immune cell types within the tumor microenvironment. DC, dendritic cell; TIME, tumor immune microenvironment; TIL, tumor infiltrating lymphocyte.

Key pathways enriched following chronic metformin exposure. (A) Cytokine-cytokine receptor interaction pathway. (B) Cell adhesion molecules. This image was generated by overlaying the information of the differentially expressed genes in the metformin treated group from our panel on the KEGG pathway image. Genes with no significant differential expression are shown in gray, blue denotes downregulation and orange represents upregulation, whereas those genes in white are not present in our panel. KEGG, Kyoto Encyclopedia of Genes and Genomes. (C) Differential gene expression among control and metformin treated groups for 17 genes contained in T-GEP.
To date, there have been fairly limited immunologic datasets from HNSCC patients taking metformin. We previously reported on TILs as a predictor of oncologic outcomes in Veterans with HNSCC limited to the oropharynx site.30 In the current study, we performed a secondary analysis of this dataset using clinically annotated data regarding the presence of diabetes mellitus (DM) at the time of cancer diagnosis and metformin utilization at the time of diagnosis and during treatment delivery. Of 143 patients, 21 patients carried a diagnosis of DM; among these, 11 patients were taking metformin at time of diagnosis and during treatment and 10 were utilizing other means of glycemic control. Quantitative IHC of CD3+ TILs and CD8+ TILs was performed as previously described.30 DM patients taking metformin had higher fractions of CD3+ and CD8+ TILs compared with DM patients not taking metformin (CD3 +28.3% vs 18.2%, p value 0.04; CD8 +16.2% vs 7.2%, p value 0.02).
Discussion
For over a decade, the promise of metformin as an anticancer agent has remained translationally elusive.14 16 18 It is a multifaceted drug which activates multiple intracellular mechanisms although its primary mechanism of antitumor activity most likely involves inhibition of mitochondrial respiration, resulting in depletion of intracellular energy and shunting of carbon flux through secondary, less efficient pathways.7 8 10 12 34 35 In preclinical models metformin has shown antitumor activity on its own as well as in combination with various chemotherapeutic agents and external beam radiation.8 12 36 These data seem to match retrospective analyses of patient cohorts which on average demonstrate some benefit of taking metformin in multiple tumor types with respect to oncological outcomes.3–6 However, when tested in the prospective setting, metformin has failed to consistently generate substantial, measurable antitumor activity. The advent of ICI based regimens for solid tumors including HNSCC raised additional hope that the addition of metformin, in the context of an immunocompetent system would be effect in improving survival. In fact, metformin is already being tested in combination with various ICI regimens on the basis of promising preclinical data in melanoma and HNSCC murine models.20 21
Cautioned by the complexity of the drug even in the absence of a competent immune system, we thought it critical to test several translationally relevant aspects of metformin utilization in the context of HNSCC. Taken together our data should provide caution when incorporating metformin in ICI-based therapeutic regimens, resulting in careful consideration of which immunocyte lineages are expected to drive overall response. First, the drug clearly has direct immunomodulatory effects regardless of intratumoral activity. Systemic immune effects can be detected in non-tumor bearing mice when metformin is administered over a short course (ie, 1 week). Since these effects occur both in the absence and presence of HNSCC tumors, they are clearly not driven by tumor biology. Nevertheless, since shifts in both T- and myeloid lineages occur in lymph nodes which represent the first echelon of draining nodes of flank tumors, there are clear implications for both tumorigenesis and regional metastasis. Although in the context of prolonged treatment of established tumors, metformin effects on both circulating T-cells and myeloid cells seem to be minimal, both cell lineages are impacted by chronic metformin exposure which precedes tumor engraftment. The persistent systemic increase in the CD8/Treg ratio considered to be unfavorable to tumor growth correlates well with the substantial delay noted in tumor growth kinetics in the setting of chronic exposure. Whereas local shifts in TIME could be considered to result from intratumor cell activity such as metabolic shifts, the systemic effects are clearly related to direct metformin effects on immunocytes. Second, duration of metformin treatment (and to some extent the mode of administration) has a profound impact on antitumor effects. Despite systemic, regional and intratumoral shifts in T-cell and myeloid lineages, metformin treatment of established tumors generates no significant antitumor effect. In contrast, chronic pretreatment, combined with persistent treatment post engraftment generates significant antitumor activity. The chronic exposure model is likely substantially closer to what would be encountered in the context of patients who normally take metformin for months or years before the development of cancer and then continue to take it during cancer development and treatment delivery. In contrast, clinical trials using metformin mimic the model of treating established tumors.14 17 18 If the data we developed in mice are reproduced in the clinical setting, this may explain a discrepancy between what we would expect to observe from retrospective cohorts and what can be reproduced in prospective clinical trials. Although the most relevant HNSCC human data to date, generated by Curry et al indicates that even a short course of metformin treatment can alter TIME by increasing CD8 +TIL levels and reducing T-reg infiltration of tumors, chronic dosing may be necessary to maximize the beneficial effects of metformin on TIME.22 23 Precisely how metformin can generate shifts in circulating and infiltrating TILs remains an open question although it is likely multifactorial. Indirect effects can involve blockade of myeloid derived suppressor cells or degradation of PD-L1.19 37 38 Alternatively, metformin can directly activate adenosine monophosphate activated protein kinase (AMPK) and other intracellular pathways inside lymphocytes resulting in differential development into T helper cells and activated CD8 +lymphocytes in large part due to differential regulation of catabolic and energy generating pathways.39–43 This complex regulation of immunocyte differentiation and activation may explain some of the differences measured here between the acute and chronic effects of metformin on systemic immunity.
Third, metformin effects on the immune response are complex, involving both lymphoid and myeloid lineages particularly at the level of TIME. Overall, the effects of chronic exposure appear to be favorable if we focus on shifts in T-cell lineages, namely the increase in TILs in the context of treatment; this would also portend favorably for chronic metformin use in the context of ICI-based regimens for HNSCC. The increased expression of nearly all components of T-GEP are consistent with the recently published data by Amin et al using human HNSCC specimens.22 Nevertheless, the sheer diversity of metformin effects with respect to both cell lineages and signaling cascades should give us pause when considering clinical trial combinations using this agent in the context of immune-modulatory strategies. Although the mEER/MTEC model is designed to mimic the behavior of HPV-associated head and neck cancers, we expect that many of the cellular and molecular shifts in systemic and tumor immunity would be conserved in HPV negative models although this requires additional validation in future studies.
The current dataset has both strengths and limitations. Although it uses a single tumor model, this model is very relevant to the current HNSCC clinical setting. First, it is an established, published model mimicking HPV-associated HNSCC, the most prevalent subset of this disease. Second, the effectiveness of ICIs in HNSCC to date has been shown to be substantial in a fairly limited fraction of patients.44–46 This model reproduces this feature of the disease as previously shown by our collaborators.24–27 Unlike the models employed by the Gutkind group it does not account for effects on malignant transformation.47 Although this is a limitation, it also indicates that the antitumor effectiveness noted in the chronic exposure setting is not due to prevention of malignant transformation, but rather direct antitumor or immunomodulatory activity. Clearly the experiments outlined in this manuscript do not wholly recapitulate all clinical scenarios. For example, we do not carry out ICI or chemoradiation effects in the setting of chronic metformin exposure. These will need to be performed in future studies in order to validate our hypothesis that only chronic pretreatment can generate a meaningful effect in this tumor model. Additional studies will need to be carried out simultaneously in parallel immunocompetent (using targeted blockade of distinct immune mechanisms) and immunodeficient murine models to more precisely separate the contribution of metformin-based immune modulation to its antitumor activity.
The clinically relevant issue of prevention arises from our data on chronic metformin exposure. As shown by the Gutkind group, prevention in high-risk patients may impact HNSCC development at the level of premalignant development and transformation.47 48 Considering its excellent safety profile, the lack of hypoglycemic risk and its low cost, prevention may in fact hold promise in at-risk patient populations (ie, patients with high grade dysplasia). We recently found that tobacco exposure modulates HNSCC TIME even in HPV-associated tumors which generally have a favorable response to treatment. More recently, we have found that tobacco is associated with an unfavorable TGEP score (manuscript currently in submission).30 49 The findings shown here suggest a potentially translationally relevant strategy, using metformin to overcome the deleterious effects of tobacco exposure and shift systemic and local immunity toward a more favorable TIME. The potential impact of such a strategy could be substantial. Using a case control approach, Figueiredo et al showed a decreased risk of HNSCC development in the context of metformin use (OR 0.54) regardless of tobacco and alcohol consumption50 51; this is consistent with data reported by Yen et al which demonstrated a 34% reduction in HNSCC incidence.52 If we loosely combine the risk reduction identified by Tseng53 with US data which indicate that over 20 000 000 individuals over the age of 65 carry a diagnosis of DM, we can loosely calculate that utilization of metformin in the entire diabetic population could generate a reduction of ~10 000 HNSCC cases per year. As the rate of metformin prescriptions in the USA has risen from 2.27 per 1000 persons in 2000 to 235 per 1000 persons in 2015 the impact may in fact already be significant.54
Data availability statement
Data are available on reasonable request. All data relevant to the study are included in the article or uploaded as online supplemental information. All data not explicitly included in the accompanying tables and figures will be made available on reasonable request.
Ethics statements
Ethics approval
For the animal study, all procedures and care were reviewed and approved by the Baylor College of Medicine Institutional Animal Care and Use Committee under Institutional Animal Care and Use Committee guidelines.
References
Supplementary materials
Supplementary Data
This web only file has been produced by the BMJ Publishing Group from an electronic file supplied by the author(s) and has not been edited for content.
Footnotes
Twitter @HSkinnerMDPhD
Contributors VCS, RV and AGS designed the study. RV, WY, JMN, VCS and JOK performed the experiments and analyzed the data. VCS, RV wrote the initial draft of the paper. RV, WY, JMN, VCS, AGS, HDS and JOK reviewed and revised the draft of the paper. VCS provided funding support for this study. VCS and AGS supervised the study. All authors reviewed the results and approved the final version of the paper.
Funding This work is supported by a Translational Innovator Award from the American Head and Neck Society and the American Academy of Otolaryngology Head and Neck Surgery Foundation (VCS) and The University of Texas MD Anderson Cancer Center, Head and Neck Surgery Department-Career Enhancement Program Fund. This material is the result of work supported with resources and the use of facilities of the Michael E. DeBakey VA Medical Center. This work is supported in part by a Career Development Award from the Veterans Administration Clinical Science Research and Development division (1IK2CX001953) (VCS). VCS and JMN are supported by the National Institute of Dental and Craniofacial Research through R03DE028858 and F31DE026682 respectively. This project was supported by the Cytometry and Cell Sorting Core at Baylor College of Medicine with funding from the CPRIT Core Facility Support Award (CPRIT-RP180672), the NIH (P30 CA125123 and S10 RR024574) and the expert assistance of Joel M. Sederstrom. Gene expression analysis was performed through the Genomic and RNA Profiling Core at BCM supported by P30 Digestive Disease Center Support Grant (NIDDK-DK56338) and P30 Cancer Center Support Grant (NCI-CA125123), NIH S10 grant (1S10OD02346901).
Disclaimer Contents do not represent the views of the U.S. Department of Veterans Affairs or the United States Government.
Competing interests None declared.
Provenance and peer review Not commissioned; externally peer reviewed.
Supplemental material This content has been supplied by the author(s). It has not been vetted by BMJ Publishing Group Limited (BMJ) and may not have been peer-reviewed. Any opinions or recommendations discussed are solely those of the author(s) and are not endorsed by BMJ. BMJ disclaims all liability and responsibility arising from any reliance placed on the content. Where the content includes any translated material, BMJ does not warrant the accuracy and reliability of the translations (including but not limited to local regulations, clinical guidelines, terminology, drug names and drug dosages), and is not responsible for any error and/or omissions arising from translation and adaptation or otherwise.