Article Text

Abstract
Background In patients with microsatellite stable (MSS) metastatic colorectal cancer (mCRC), immune checkpoint blockade is ineffective, and combinatorial approaches enhancing immunogenicity need exploration.
Methods We treated 43 patients with predominantly microsatellite stable RAS/BRAF wild-type mCRC on a phase II trial combining chemotherapy with the epidermal growth factor receptor antibody cetuximab and the programmed cell death ligand 1 (PD-L1) antibody avelumab. We performed next-generation gene panel sequencing for mutational typing of tumors and liquid biopsy monitoring as well as digital droplet PCR to confirm individual mutations. Translational analyses included tissue immunohistochemistry, multispectral imaging and repertoire sequencing of tumor-infiltrating T cells. Detected PD-L1 mutations were mechanistically validated in CRISPR/Cas9-generated cell models using qRT-PCR, immunoblotting, flow cytometry, complement-dependent cytotoxicity assay, antibody-dependent cytotoxicity by natural killer cell degranulation assay and LDH release assay as well as live cell imaging of T cell mediated tumor cell killing.
Results Circulating tumor DNA showed rapid clearance in the majority of patients mirroring a high rate of early tumor shrinkage. In 3 of 13 patients expressing the high-affinity Fcγ receptor 3a (FcγR3a), tumor subclones with PD-L1 mutations were selected that led to loss of tumor PD-L1 by nonsense-mediated RNA decay in PD-L1 K162fs and protein degradation in PD-L1 L88S. As a consequence, avelumab binding and antibody-dependent cytotoxicity were impaired, while T cell killing of these variant clones was increased. Interestingly, PD-L1 mutant subclones showed slow selection dynamics reversing on avelumab withdrawal and patients with such subclones had above-average treatment benefit. This suggested that the PD-L1 mutations mediated resistance to direct antitumor effects of avelumab, while at the same time loss of PD-L1 reduced biological fitness by enhanced T cell killing limiting subclonal expansion.
Conclusion The addition of avelumab to standard treatment appeared feasible and safe. PD-L1 mutations mediate subclonal immune escape to avelumab in some patients with mCRC expressing high-affinity FcγR3a, which may be a subset experiencing most selective pressure. Future trials evaluating the addition of avelumab to standard treatment in MSS mCRC are warranted especially in this patient subpopulation.
Trial registration number NCT03174405.
- immunotherapy
- biomarkers
- tumor
- clinical trials
- phase II as topic
- gastrointestinal neoplasms
- translational medical research
Data availability statement
Data are available in a public, open access repository. All data relevant to the study are included in the article or uploaded as supplementary information. Data and materials availability: NGS fastq files are deposited at European Nucleotide Archive, ID: PRJEB35507.
This is an open access article distributed in accordance with the Creative Commons Attribution Non Commercial (CC BY-NC 4.0) license, which permits others to distribute, remix, adapt, build upon this work non-commercially, and license their derivative works on different terms, provided the original work is properly cited, appropriate credit is given, any changes made indicated, and the use is non-commercial. See http://creativecommons.org/licenses/by-nc/4.0/.
Statistics from Altmetric.com
- immunotherapy
- biomarkers
- tumor
- clinical trials
- phase II as topic
- gastrointestinal neoplasms
- translational medical research
Introduction
In metastatic colorectal cancer (mCRC), the efficacy of immune checkpoint blockade (ICB) using programmed cell death protein 1 (PD-1)/PD-1 ligand 1 (PD-L1) targeting antibodies with or without cytotoxic T lymphocyte antigen 4 inhibitors has so far been limited to patients with high microsatellite instability (MSI-H).1–3 For the vast majority of patients with mCRC and microsatellite stable (MSS) tumors, immune checkpoint inhibitors have not yet shown relevant efficacy neither as single agent nor as maintenance in combination with fluoropyrimidines and Vascular endothelial growth factor (VEGF) antibody bevacizumab nor in combination with the MEK inhibitor cobimetinib.4–6 We hypothesized that the upfront combination of immunomodulatory chemotherapy (ie, 5-FU and oxaliplatin), immunogenic cell death inducing targeted therapy (ie, the EGFR antibody cetuximab) and ICB may be synergistic and sensitize toward the checkpoint inhibitor resulting in immune control and suppression of resistant tumor subclones.7–10 To this end, the AVETUX trial was designed to evaluate whether adding avelumab to FOLFOX and cetuximab is feasible and may show clinical or translational signs of synergistic efficacy. In contrast to other available PD-1/PD-L1 antibodies equipped with IgG4 or genetically engineered IgG1 constant regions lacking the ability to effectively bind complement or Fc gamma receptors (FcγR), avelumab harbors a functional IgG1 domain suggested to induce both, checkpoint blockade as well as antibody dependent cytotoxicity (ADCC) when bound to the tumor cell surface.11 Thus, the combination of avelumab and cetuximab may be of particular interest in the immunosuppressive environment of MSS mCRC. To gain insights into the mode of action of this novel combination regimen as well as into resistance mechanisms and potential subgroups with superior clinical benefit, we designed an extensive translational program including comprehensive assessment of tumor biopsies prior to treatment and liquid biopsy monitoring of tumor subclones over treatment.
Material and methods
Study design
This is a single-arm, multicenter phase II trial designed to assess the combination of avelumab with cetuximab and mFOLFOX6 in patients with previously untreated RAS/BRAF wild-type (wt), MSI independent mCRC. Main inclusion criteria were: ≥18 years of age; Eastern Cooperative Oncology Group performance status 0 or 1; and no previous chemotherapy for metastatic disease (adjuvant chemotherapy allowed if terminated more than 6 months before trial start). The trial was conducted at 10 centers in Germany after approval by local ethics committees and competent authority and registered. All participants provided written informed consent. Patients or public were not involved in the design of the trial. The AVETUX regimen applied avelumab at a dose of 10 mg/kg intravenously over 60–90 min (biweekly from cycle 2 onward), cetuximab at a dose of 250 mg/m2 intravenously over 60–90 min (weekly, first dose 400 mg/m2) and a modified FOLFOX6 with oxaliplatin at a dose of 85 mg/m2 intravenously (day 1), 5-FU 400 mg/m2 intravenously bolus (day 1) and 5-FU 2400 mg/m2 intravenously continuous infusion (days 1–2), and LV at a dose of 400 mg/m2 intravenously. The primary endpoint was progression-free survival (PFS) rate at 12 months (according to RECIST V.1.1); secondary endpoints were overall response rate (ORR), early tumor shrinkage, progression-free and overall survival (OS) as well as toxicity. A sample size of 41 patients achieved 80% power to detect a positive signal of improvement by 17% compared with the PFS assumption for standard treatment at a one-sided alpha error level of 0.1.
Biomaterial
Twenty mL peripheral blood (STRECK cell-free DNA BCT tubes) were obtained every 4–16 weeks for translational research. Paraffin-embedded tissue obtained during surgical removal or biopsy before treatment initiation as well as—if applicable—on treatment was collected.
Tissue immunohistochemistry and multispectral imaging
Immunohistochemistry (IHC) for PD-L1 was performed with the Bond Polymer refine detection Kit (Leica) to deduce tumor proportion score (TPS) and immune cell (IC) score. As described elsewhere,12 IHC was performed with antibodies directed against PanCK, CD3 and PD-L1 or CD56 and CD16, and multispectral imaging with antibodies against CD3, CD8, CD20, CD163, Foxp3 and PanCK (online supplemental table S1).
Supplemental material
Next-generation T cell receptor repertoire sequencing and data analysis
Amplification of the T cell receptor beta chain (TRB) repertoire from circulating or tumor-infiltrating lymphocytes (TiLs) was done as described elsewhere.13–19 Sequencing and demultiplexing was performed on the Illumina MiSeq platform with 2×301 cycles at a coverage of 80 000 reads per sample. Analysis of the TRB locus was computed using the MiXCR analysis tool V.3.0.5.20. Analyses were performed using R21 and the package tcR.22 Peripheral blood T cell diversification was calculated as follows: Shannon diversity index at week 4 minus Shannon diversity index at baseline. No delta or a negative delta were interpreted as not diversified, whereas a positive delta was interpreted as diversified.
Next-generation gene panel sequencing
For mutational profiling of tumor or circulating tumor DNA (ctDNA; liquid biopsy), up to 100 ng of tumor Formalin-Fixed Paraffin-Embedded (FFPE) tissue DNA or ctDNA were used. Target genes with known pathogenic or resistance variants (cBio Cancer Genomics Portal23) as well as PD-L1 were selected for the gene panel, and sequencing libraries were constructed using QIAseq Targeted DNA Custom Panels, Qiagen (online supplemental table S2). Sequencing was performed on the Illumina NextSeq or HiSeq platform with 2×151 cycles at a coverage of 26 500 reads per target region. Variant calling of unique molecular identifier based data was performed using smCounter2 as described elsewhere.24 Tumors were classified as mutation positive, if the mutation was found in either tumor tissue or liquid biopsy at a variant allele frequency (VAF) exceeding 10% or if the mutation was concordantly found in tumor tissue and liquid biopsy independently of VAF. Follow-up liquid biopsies were classified mutation positive if the same mutation was found repeatedly in one patient independently of VAF. All variants that were found are listed in online supplemental table S3.
Supplemental material
Digital droplet PCR workflow and analysis
ddPCR custom assays were designed by and ordered from IDT (Iowa, USA). To increase specificity locked nucleic acid bases were incorporated in the probes. Probes were HPLC purified and contained either a 5′-HEX (wildtype probe) or a 5′-FAM (mutant probe) reporter dye and a 3′ Iowa Black Fluorescent quencher. Probe and primer sequences are listed in online supplemental table S4.
Each reaction (22 µL) contained 11 µL 2xddPCR SuperMix for probes (no UTP) (Biorad), template DNA and primers and probes at a final concentration of 1.8 µM and 500 nM, respectively. After droplet generation (AutoDG, Biorad), the plate was sealed with a pierceable foil heat seal (PX1 PCR plate sealer, Biorad), and the PCR was performed on a C1000 Touch thermal cycler (Biorad). The cycling conditions were as follows: 95°C, 10 Min; [94°C, 30 s; 59°C, 1 min] ×45; 98°C, 10 min; 12°C, 30 min; 4°C hold. Prior to the read-out on QX200 droplet reader (Biorad), the plate was left at room temperature for 10 min.
ddPCR data were analyzed using the QX Manager 1.0 Standard Edition (Biorad).
Assay specificity was tested on gBlocks (IDT). Thresholds for positive/negative droplets were set manually for each assay according to the positive controls (gBlocks, IDT, online supplemental figure S1).
Generation and evaluation of cell lines stably expressing patient-derived PD-L1 variants
Novel PD-L1 variants were functionally validated in five cell lines, including Ba/F3 (PD-L1 negative murine pro B cell line), UT-SCC-14 (tongue squamous cell carcinoma), UT-SCC-29 (laryngeal squamous cell carcinoma), HT-29 (colorectal adenocarcinoma, KRAS wt) and DLD-1 (colorectal adenocarcinoma, KRAS G13D) (German Collection of Microorganisms and Cell Cultures GmbH) after exclusion of Mycoplasma contamination. Endogenous PD-L1 was depleted using the CRISPR plasmid pU6 containing gRNAs complementary to nts 508–527 in exon 4 (gRNA1) and nts 339–358 in exon 3 (gRNA2) of PD-L1 (NM_014143.4) and verified by immunoblotting and flow cytometry. For ectopic re-expression of PD-L1 variants, the wt coding sequence was cloned into the Lentiviral Gene Ontology (LeGO) vector LeGO-iC2-Puro+via AsiSI/EcoRI. The pLeGO-PD-L1 wt construct was used as template to generate the PD-L1 L88S (c.263T>C) by site-directed mutagenesis. The PD-L1 K162fs variant was synthesized and cloned into pLeGO-iC2-Puro+. Generation and transduction of lentiviral particles as well as selection of transduced cell was performed as described elsewhere.25 Cell lysates were generated using RIPA buffer supplemented with protease and phosphatase inhibitors (both Roche). Membrane fractions were generated using the ProteoExtract Native Membrane Protein Extraction Kit (Merck). Selective enrichment of membrane proteins was controlled via detection of prohibitin 1 and 2 (membrane) as well as NFκB subunit p65 (non-membrane) proteins (online supplemental table S1).
Complement-dependent cytotoxicity (CDC)
UT-SCC-14 cells were incubated with 2 µg of avelumab and complement for 3 hours. Cetuximab in combination with matuzumab (1 µg each) served as positive control. Propidium iodine flow cytometry staining was used to analyze CDC.
Antibody-dependent cytotoxicity by natural killer (NK) cell degranulation assay and LDH release assay
NK cell degranulation was evaluated in co-culture assays with PD-L1 variant cell lines by flow cytometry detection of CD107a.26 NK cells from healthy volunteers were isolated via negative selection (RosetteSep Human NK Cell Enrichment Cocktail, Stemcell Technologies) and cultivated overnight in medium containing 1 ng/mL IL-15. NK cells were added to the respective target cells at 1:1 ratio in the presence of 1.2 µL CD107a-PE-Cy7, 1 ng/mL IL-15, 5 µg/mL brefeldin A and 2 µg avelumab, 2 µg cetuximab or 2 µg human IgG (Intratect) for 5 hours, washed and stained with anti-CD3-FITC/anti-CD56-PE (online supplemental table S1). NK cell-mediated target cell killing was also quantified using the Cytotoxicity Detection Kit (LDH) from Roche following the manufacturer’s instructions.
T cell mediated tumor cell killing
T cell mediated tumor cell killing was assessed using the Incucyte Caspase-3/7 Reagent (Essen BioScience) according to the manufacturer’s instructions. Untouched CD8+ T cells were isolated from pooled PBMCs of five healthy donors using the CD8+ T Cell Isolation Kit (Miltenyi) and quantified using a Vi-CELL XR (Beckman Coulter). Five thousand HT-29 cells were seeded in triplicates in a 96-well flat bottom plate and cocultured with 50 000 CD8+ T cells. For T cell activation, the medium was supplemented with 10 ng/mL recombinant IL-2 (BioLegend), 100 ng/mL anti-CD3 (BioLegend) and 100 ng/mL anti-CD28 (BioLegend) (online supplemental table S1). Read out of dead (=green-fluorescent) target cells was performed on an Incucyte S3 after 24 hours.
qRT-PCR
Total RNA was isolated using the Quick-RNA kit (Zymo Research) and reverse transcribed with SuperScript III (Thermo Fisher). Target amplification was performed on the CFX96 System (Bio-Rad) using the SYBR Select Master Mix CFX and primers for PD-L1 (forward: TGCTGAACGCATTTACTGTCAC; reverse: TCTGTCTGTAGCTA CTATGCTG), mCherry (forward: AGGAGGATAACATGGCCATCAT; reverse: ACCC TTGGTCACCTTCAGCT) and HPRT1 (forward: TGACACTGGCAAAACAATGCA; reverse: GGTCCTTTTCACCAGCAAGCT). The relative expression levels were normalized to HPRT1 and calculated according to the comparative Ct (∆∆Ct) method.
Nonsense mediated mRNA decay (NMD)
To assess the relevance of NMD for transcript turnover of the detected PD-L1 variants, NMD was inhibited using 20 mM caffeine for 4 hours. Selective enrichment of NMD-targeted PD-L1 transcripts was detected (semi)quantitatively using (q)RT-PCR as described previously.
PD-L1 degradation assays
Cycloheximide (CHX) and tunicamycin (Tm) were obtained from Santa Cruz Biotechnology, Compound C/dorsomorphin and MG132 from Selleck Chem. To analyze degradation kinetics of PD-L1 variants, 2 million cells were seeded in 6-well format and either incubated with 100 µM CHX for 3, 6 and 9 hours, with 10 µg/mL Tm for 18 hours, with 10 µM Compound C for 2 and 4 hours or with 20 µM MG132 for 4 hours. Proteins were isolated as described previously and subjected to immunoblotting.
Results
Patient characteristics and study treatment
Between June 2017 and July 2018, the AVETUX trial enrolled 43 patients, 41 thereof with MSS or MSI-low tumors. Patients 22 and 26 were MSI-high. Four patients were excluded after central tissue review with (mostly lower frequency) RAS (n=3) or BRAF mutations (n=1) (figure 1A). For eligible patients (n=39), median age was 62 (range 29–82), 36 patients (92%) had left sided primary tumors and 30 patients (77%) had liver metastases. Prior adjuvant treatment rate was high with overall 31% (12/39) and oxaliplatin in 23% (9/39) of patients. Patient characteristics are summarized in table 1.
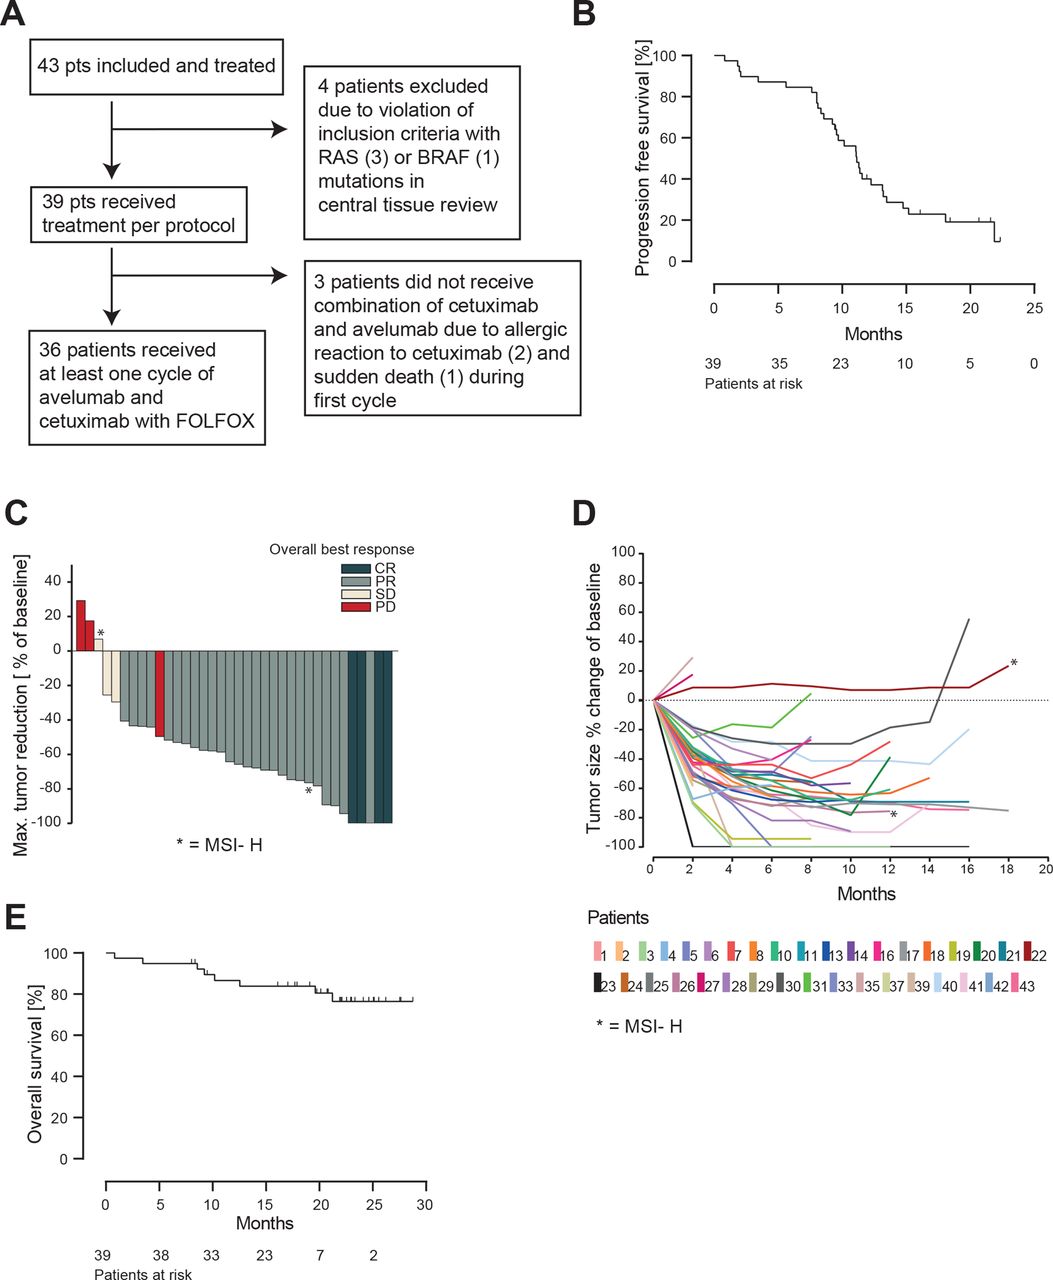
Efficacy of AVETUX protocol. (A) Consort diagram. (B) Kaplan-Meier estimates of progression-free survival. (C) Waterfall plot of best responses in target lesions (PD in responding patient was new lesion). (D) Spider plot depicting tumor measurements over time. Patients with MSI are marked with asterisk. (E) Kaplan-Meier estimates of overall survival. PD, progressive disease.
Baseline characteristics of eligible patients
Median follow-up was 21.2 months. The median number of cycles administered (at least one study component) was 18 cycles (range 1–35), with a median of 8 cycles of oxaliplatin, 12 of cetuximab and 16 of avelumab. The combination of avelumab and cetuximab was applied for a median time of 5.4 months.
Clinical data: efficacy and safety
The Kaplan-Meier estimation of PFS from the time point of protocol treatment start is shown in figure 1B, which is based on a total of 31 observed events (79%) in the intention-to-treat population of 39 patients. The PFS rate at 12 months was 40% and the median PFS was 11.1 months (95% CI 9.6 to 13.5 months). Based on the high rate of prior oxaliplatin (23%) and early non-treatment related drop-outs, an exploratory analysis excluding these patients showed a PFS of 13.2 months. The overall response rate in the RECIST evaluable population (n=37) was 81% (95% CI 65% to 92%) (MSS/MSI-low 83%) with four complete responses (11%) and a disease control rate of 89% (figure 1C,D). Early tumor shrinkage of at least 20% during the first 8 weeks was observed in 30 patients (81%). The current OS Kaplan-Meier curve estimates are shown in figure 1E, which plateau at 77% at a median follow-up of 21.2 months. Until the data cut-off in September 2019, only eight events occurred. Secondary resection of metastases was achieved in 6 out of 39 patients (15%) of which five stopped treatment after surgery. Treatment-related adverse events are summarized in table 2, revealing no unexpected findings or overlapping toxicities.
Grade 3/4 adverse events occurring in >5% of patients
Immunological biomarkers
Since ICB represented the experimental component of the treatment regimen, we studied potential immunological biomarkers of response.
We did not observe any association of PD-L1 TPS with PFS in our patient cohort (online supplemental figure S2). Yet, this analysis was hampered due to low tumor cell count (>30% of samples with less than 100 tumor cells), lack of the invasion front (>25% biopsy specimens)27 28 (online supplemental figure S3) and discordant PD-L1 staining with different antibody clones in 15% of samples (online supplemental table S5).
Next, we explored blood-circulating and tumor-infiltrating T cells (TiLs) by next-generation immunosequencing to deduce potentially predictive immune signatures based on diversification (related to an increase in Shannon diversity index) of the peripheral blood T cell space.13 29 30 In contrast to prior data from monotherapy trials, our combinatorial approach did not reveal any association with PFS (online supplemental figure S4). Tissue deep sequencing revealed a broad range of T cell infiltration levels across the cohort (online supplemental figure S5A). Since no defined threshold is available in literature, we defined 0.5% as cut-off for high (n=14) versus low (n=28) TiL levels. Interestingly, four of five patients with febrile reactions to ICB belonged to the subset of patients with high levels of T cell infiltration, and high TiL levels showed a trend toward improved PFS (p=0.07, online supplemental figure S5B). The TiL composition was rather heterogeneous both across the cohort and in different portions of the same tumor as analyzed by multispectral imaging with some patients showing CD8+ biases, some CD4+ biases and others showing T cell infiltration biased toward Tregs (online supplemental figure S6).
Liquid biopsy disease monitoring
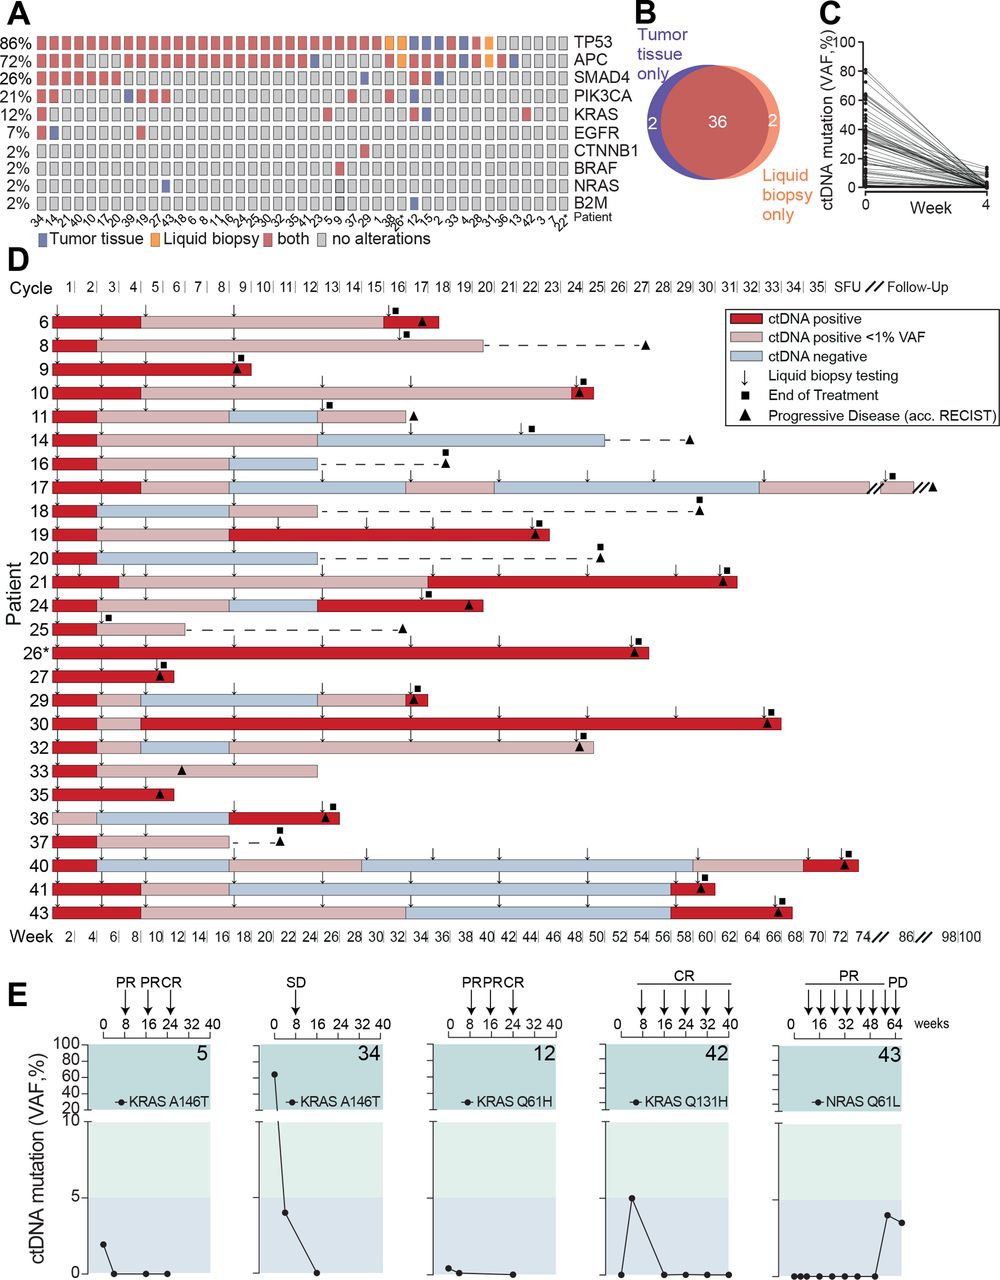
The complete study cohort was subjected to tumor tissue and liquid biopsy testing at baseline using a gene panel covering the most frequent driver and resistance mutations in mCRC (online supplemental table S2). In 40 out of 43 patients, mutations in the baseline tumor tissue and liquid biopsy screening were identified, which overlapped in 36 patients in at least one gene mutation (figure 2A,B). The vast majority of these patients turned negative or clearly reduced their circulating tumor DNA (ctDNA) levels to <1% after 4 weeks of treatment (figure 2C). Next, serial liquid biopsies were assessed as a predictor of disease progression. Of 26 cases with ctDNA positivity and progressive disease during the observation period, reappearance or increase of ctDNA preceded disease progression by a median of 8.5 weeks (mean 13 weeks) in those who initially reduced their ctDNA levels to <1% or turned ctDNA negative (figure 2D).

Mutational profiling and liquid biopsy disease monitoring. (A) Distribution of mutation spectra in FFPE tumor tissue and liquid biopsy at baseline evaluation. (B) Venn diagram of patients of which tumor driver mutations were detected by gene panel sequencing in FFPE tissue and/or liquid biopsy, respectively. (C) Circulating tumor (CT) DNA clearance from baseline to week 4 after treatment initiation. (D) Serial liquid biopsy testing in patients with disease progression during observational period. Gray box: increase or reappearance of ctDNA prior to clinical PD in weeks. Line indicates median. (E) KRAS and NRAS circulating tumor DNA monitoring during AVETUX therapy regimen. Respective patient number in bold. Patients with MSI are marked with asterisk. CR, complete response; FFPE, formalin-fixed paraffin-embedded; PR, partial response; PD, progressive disease; SD, stable disease; VAF, variant allele frequency; SFU, safety follow-up.
Mutations in the MAPK signaling axis
Beside baseline RAS mutations excluding the application of EGFR antibodies, recent studies on EGFR inhibition found high rates of acquired secondary resistance mediating downstream RAS mutations or EGFR ectodomain mutations disrupting the antibody’s epitope.25 31–36 While EGFR ectodomain mutations may appear in up to 20% of patients during EGFR directed treatment, acquired RAS mutations have been reported more frequently (32%–44% of cases).37–40 In our cohort, five patients showed (mainly low level) RAS mutations at baseline confirmatory central testing (patients 5, 12, 15, 34 and 42), leading to the post hoc exclusion due to violation of selection criteria in 2 patients (>10% mutant allels in tissue). Patients 5, 34 and 12 cleared their KRAS mutant ctDNA from blood in the course of treatment with patients 5 and 12 even achieving early CR (figure 2E). Patient 42’s KRAS Q131H mutation (VAF 0.14% in liquid biopsy at baseline) did not steadily expand on treatment but showed a rather fluctuating course not exceeding VAFs of 10% and the patient achieved early CR and long-term disease control (figure 2E). Patient 43 secondarily developed a classical NRAS mutation shortly after withdrawal of oxaliplatin. While the initial liquid biopsy was negative for NRAS Q61L, this mutation steadily increased on treatment, and within 7 weeks from first detection of this mutation, the patient progressed clinically (figure 2E). In line with the exceedingly low rate of emerging RAS mutations (only one in 43 patients with emerging NRAS mutated ctDNA levels and progression), there was no evidence for acquired EGFR ectodomain mutations on this protocol.
Selection and dynamics of tumor subclones with mutations in targets relevant for ICB
To search for potentially emerging avelumab-resistant tumor subclones, we used a liquid biopsy panel including genes known to be involved in resistance41 (β2-microglobulin (B2M), Janus kinase 1 (JAK1)). Moreover, proposing direct antitumor effects as mechanism of action of avelumab (ADCC), we covered the whole coding region of PD-L1 to be able to detect potential escape variants that may evade avelumab binding by epitope disruption or impaired membrane expression. In addition, we included regions within the Fcγ receptor (FcγR) genes with known single nucleotide polymorphisms (SNPs) associated with high-affinity toward IgG1 that have been described to allow more potent NK cell ADCC.11
Indeed, NGS of ctDNA or on-treatment tumor samples (n=5) identified patients with mutations in the previously mentioned genes (figure 3A). Patient 22 showed both a B2M L15fs and a JAK1 H183Y mutation in on-treatment tumor biopsies. The B2M L15fs mutation was truncating, and the JAK1 H183Y was compatible with loss-of-functionality as in previously reported resistance variants (figure 3B). Interestingly, both on-treatment tumor samples (primary and metastasis) showed the B2M L15fs mutation, while the JAK1 H183Y mutation was only detectable in the metastasis and with a different VAF. In patient 12, a B2M L15fs mutation was detectable by NGS already prior to treatment.

Selection of resistance variants on AVETUX protocol and clearance after avelumab withdrawal. (A) Overview of B2M, JAK1 and PD-L1 mutations in baseline and on-treatment tumor and liquid biopsy samples. Tumor samples collected under treatment or at EOT originate from: patient 12: liver metastasis, patient 22: tumor DNA 1: rectum and tumor DNA 2: bladder (same metastatic site as used for baseline testing), . (B) Localization of B2M, JAK1 and PD-L1 mutations. (C) Distribution of emerging resistance mutations to avelumab and cetuximab as well as FcγR3a genotype (rs396991) over the cohort. Asterisk on KRAS indicates that mutation disappeared in follow-up liquid biopsy samples. In total five on-treatment tumor samples were available. (D) ddPCR validation of immune checkpoint blockade resistance variants in patient 22. (E) PFS of patients with F/F versus F/V or V/V FcγR3a genotype (rs396991). Dotted line indicates median PFS of entire patient cohort. Statistical test: one-sided, unpaired t-test. (F) Longitudinal ctDNA and biopsy (hemicolectomy) mutational and CEA profile of patient 21 with a treatment-induced PD-L1 K162fs mutation and patient 30 with a treatment-induced PD-L1 L88S mutation. Treatment is indicated above each plot. Highlighted area indicates time during AVETUX regimen. Patients with MSI are marked with asterisk. APC, adenomatous polyposis coli; B2M, β2-microglobulin; CEA, carcinoembryonic antigen; JAK1, Janus kinase 1; PD-L1, programmed cell death ligand 1; PFS, progression-free survival; PD, progressive disease; PR, partial response; TP53, tumor protein p53;
Moreover, we found two selected PD-L1 mutations in three patients of our cohort. Both mutations were located within the extracellular region of PD-L1, outside both the PD-L1/PD-1 interaction site and the avelumab epitope on PD-L1 (figure 3A,B). The PD-L1 L88S variant was a missense mutation, while the PD-L1 K162fs mutation led to a frameshift with premature stop codon before the transmembrane domain. The truncated variant PD-L1 K162fs was found in patient 21 by liquid biopsy analysis with allele frequencies at the detection limit in the course of treatment. VAF increased substantially at disease progression suggesting that this mutation was involved in resistance to treatment (online supplemental table S3). Interestingly, the PD-L1 L88S mutation occurred in patient 22 who also showed B2M L15fs and JAK1 H183Y mutations. It was undetectable in the tumor tissue by NGS analysis before treatment initiation as well as in leukocyte DNA of this patient. In patient 30, the same missense mutation PD-L1 L88S was found at end of treatment at the time of disease progression. Distribution of all mutations selected on treatment are summarized in figure 3C.
We used ddPCR to validate our findings and could confirm all four variants using specific custom assays (online supplemental table S6 and online supplemental figure S1). Since this method is more sensitive than NGS, we exemplarily reanalyzed the baseline tumor samples of patient 22 who showed three ICB resistance mutations in on-treatment tumor tissue. Interestingly, while the baseline tumor sample of patient 22 was negative for these mutations by NGS, we identified small frequencies of the PD-L1 L88S, B2M L15fs and JAK1 H183Y variants by ddPCR suggesting the presence of these small subclones already at baseline and a subsequent selection of those clones on the AVETUX regimen (figure 3D).
Of note, patients 21 and 22 with PD-L1 mutations were the only patients in the cohort homozygously expressing the V-allele of FcγR3a (rs396991) that is associated with high IgG1 affinity while patient 30 expressed the V-allele in a heterozygous fashion (figure 3C; online supplemental table S7). Association of the SNP with PD-L1 mutations as well as a trend toward improved PFS in patients homozygous or heterozygous for the V-allele (p=0.07, figure 3E) suggested that this may be a subset of patients experiencing strongest selective pressure by avelumab, in addition to the known higher susceptibility to cetuximab.42 43 In patients 21 and 30, tumor material or ctDNA was available after progression on the AVETUX protocol several months after avelumab withdrawal. Interestingly, in both patients, PD-L1 mutant subclones (but not the tumor defining mutations) decreased in size or fully disappeared suggesting low biological fitness of these clones when the selective pressure exerted by avelumab was withdrawn (figure 3F).
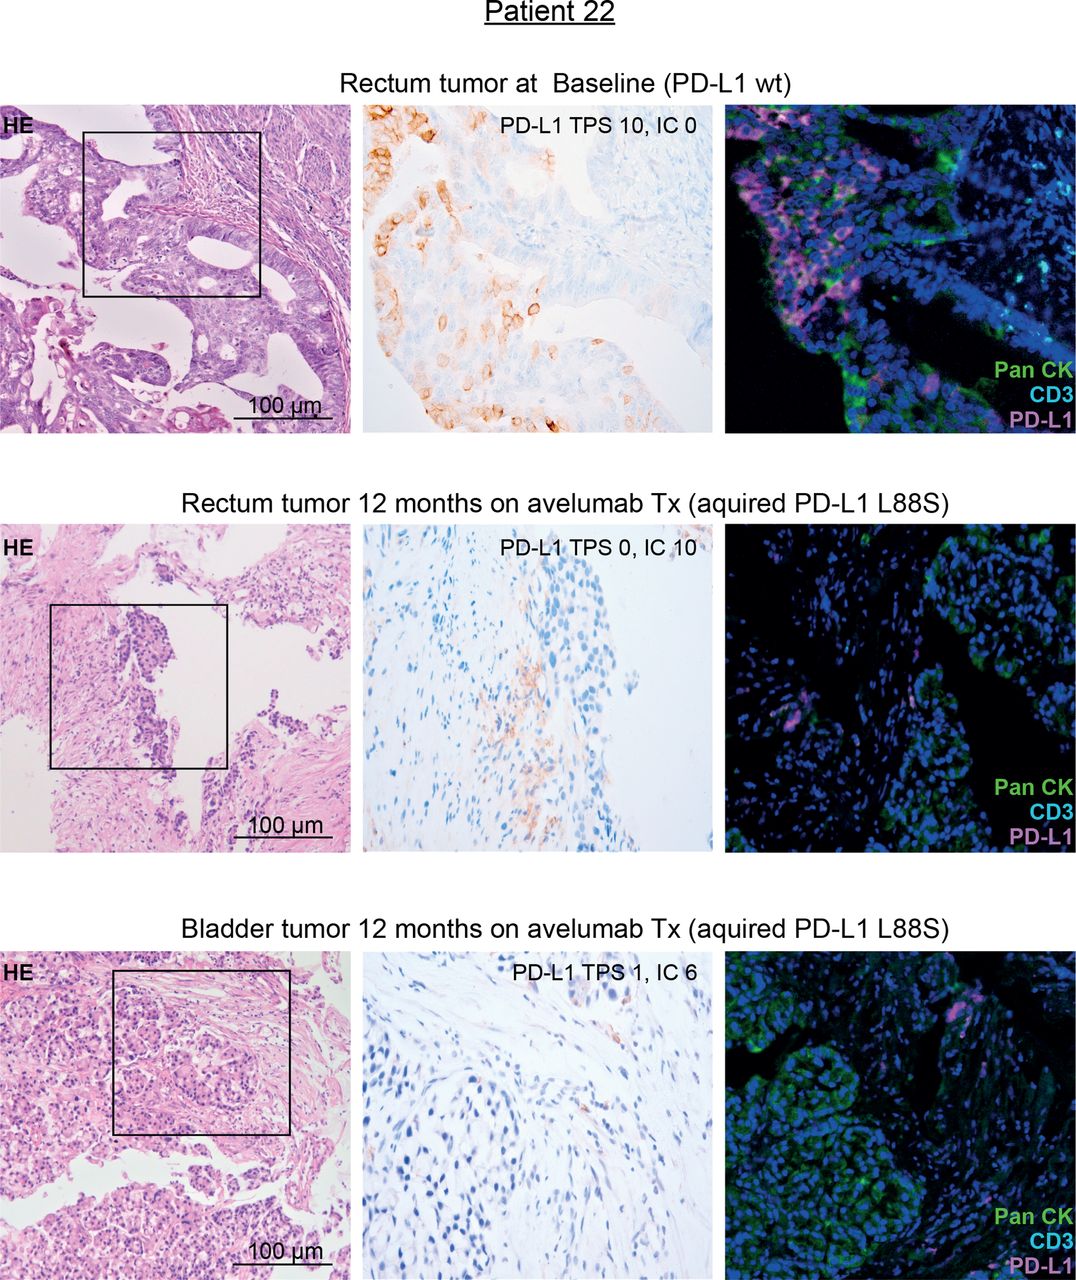
Together, their selection on treatment, their localization outside the avelumab epitope and their association with the FcγR3a V-allele suggested that the identified PD-L1 mutations may mediate immune escape toward avelumab through loss of the PD-L1 antigen on tumor cells. Since in patient 22 on-treatment tumor tissue was available, we performed PD-L1 immunohistochemistry (IHC) on this tissue and compared the results with pretreatment tumor tissue of the same patient (harboring only a minimal frequency of PD-L1 mutated clones). In line with our hypothesis, this patient showed a selective loss of PD-L1 surface staining on tumor cells while immune cells were clearly PD-L1 positive after avelumab exposure (figure 4). To definitively exclude epitope disruption by the mutation, we performed western blot analyses using clone QR1 used for tissue staining on cell lines strongly overexpressing PD-L1 L88S. This experiment confirmed that this antibody clone—recognizing an intracellular epitope of PD-L1—recognizes the PD-L1 L88S variant (online supplemental figure S7).

IHC staining of PD-L1 in pre-treatment and on-treatment tumor tissue of patient 22 with genetic evidence of a treatment-induced PD-L1 L88S mutation. Representative micrographs of H&E and PD-L1 stainings of tumor tissue at 100× and 400× magnification, respectively. Moreover, multiplex IHC is shown using antibodies against PanCK (tumor cells, green), CD3 (T cells, turquoise) and PD-L1 (magenta). Nuclei are stained with DAPI. IC, immune cell score; IHC, immunohistochemistry; PD-L1, programmed cell death protein ligand 1; TPS, Tumor proportional score; Tx, treatment.
Functional validation of novel PD-L1 mutations in cell models
To further explore the functional role of the detected PD-L1 alterations, we generated five different cell models expressing these variants using CRSIPR/Cas9 and lentiviral transduction (figure 5A,B). Ectopic expression of PD-L1 L88S led to a transcription-independent reduction of full-length glycosylated PD-L1 protein in subcellular membrane fractions as compared with the wt, while cell lines expressing the truncating K162fs mutation did not yield a PD-L1 signal on immunoblots (figure 5B–D; online supplemental figure S8). Consequently, PD-L1 L88S cells showed reduced, K162fs cells no avelumab surface binding, which was not attributable to epitope disruption (figure 5E; online supplemental figure S9).

Selected PD-L1 mutations reduce protein abundancy, surface expression, ADCC and T cell suppression. (A) Schematic representation of gRNAs targeting the PD-L1 coding sequence (CDS). (B) CRISPR/Cas9-mediated depletion of PD-L1 as detected in crude cell extracts via immunoblotting. (C) PD-L1 protein levels after lentiviral redelivery of PD-L1 variants into PD-L1KO2 human cell lines and the murine Ba/F3 cell line as detected by immunoblotting. (D) Enrichment of PD-L1 in the membranous fraction (M) of HT-29 cell variants from panel C. (C) Cytosolic, non-membranous fraction. (E) Flow cytometric detection of PD-L1 surface expression displayed as mean relative fluorescence intensity (RI) after staining with avelumab. n(DLD-1)=7, n(HT-29)=8, n(UT-SCC-14)=9, n(UT-SCC-29)=8, n(Ba/F3)=4. (F) NK cell degranulation induced by coculturing primary NK cells and cell lines expressing indicated PD-L1 variants in the presence of avelumab (n=4 for DLD-1, HT-29, UT-SCC-29; n=5 for UT-SCC-14). Percent degranulated NK cells normalized to spontaneous NK degranulation is shown for all cocultures. (G) Representative images and time course of T cell mediated tumor cell killing. CD8+ T cells were cocultured with HT-29, DLD-1 and UT-SCC-14 cells expressing WT PD-L1 or the L88S and K162fs variants (red fluorescence). Caspase 3/7 activity (relative intensity of green fluorescence) was monitored every 90 min for 24 hours with an Incuyte S3. Scale bar, 200 µM. Asterisks indicate p value range (*p<0.05; **p<0.01; ***p<0.001; ***p<0.0001). Statistics for time course: two-tailed paired t test. All other statistics: two-tailed unpaired t test. NK, natural killer; PD-L1, programmed cell death protein ligand 1.
In accordance with previous reports,44 CDC effector functions were not detectable (online supplemental figure S10). In contrast, cells expressing the L88S variant were markedly less able to induce degranulation of primary NK cells in the presence of avelumab as compared with the wt (figure 5F). The 100% positive staining rate of patient tumor material with antibodies against CD56 and/or CD16 clearly showed that all of the tumors were infiltrated with cells able to mediate ADCC under in vivo conditions (data not shown). PD-L1 K162fs transduced cells failed to mount an avelumab-mediated NK cell response (figure 5F). NK cell degranulation mediated by cetuximab was independent of PD-L1 status or variant (online supplemental figure S11). Direct LDH release as a measure for target cell killing confirmed this pattern (online supplemental figure S12).
To test whether the K162fs or L88S variants affect T cell suppression, we cocultured HT-29, DLD-1 and UT-SCC-14 cells expressing these variants with primary cytotoxic CD8+ T cells and monitored immune cell killing over time. While cells expressing wt PD-L1 were more resistant to T cell mediated immune cell killing than L88S cells, cells expressing the K162fs variant were most effectively targeted by T cells (figure 5G).
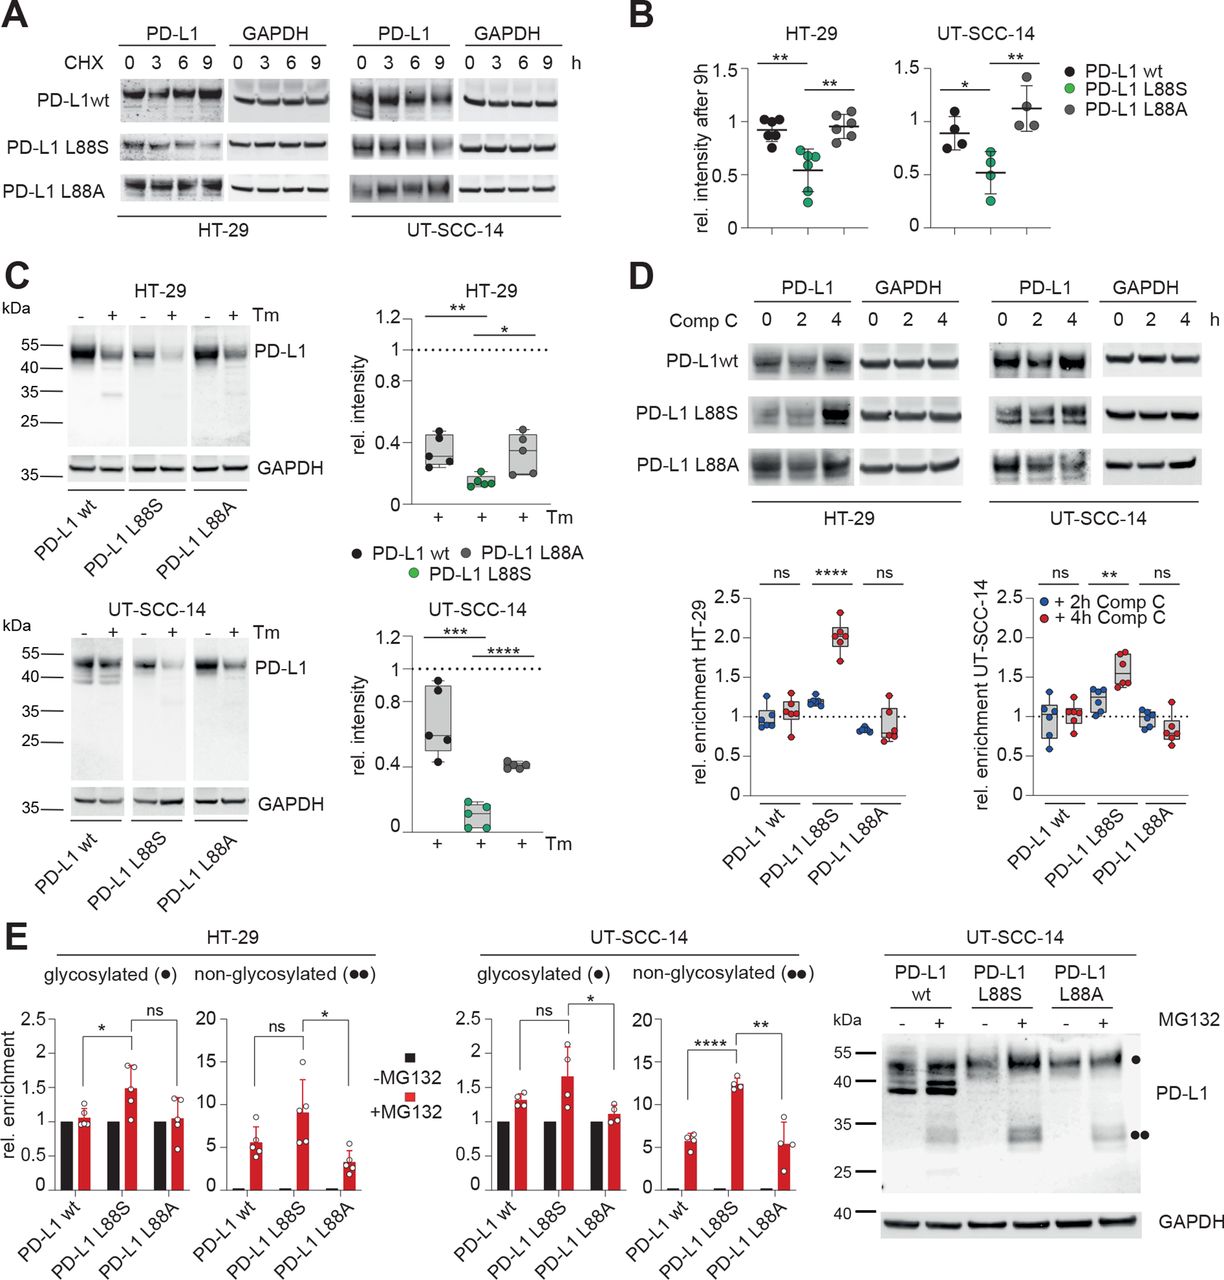
Further experiments were performed to explore the mechanisms underlying loss of PD-L1 membrane expression in these mutants. As demonstrated with inhibition experiments, the K162fs mRNA product is constantly degraded by the NMD machinery (online supplemental figure S13). Since reduced PD-L1 protein levels in cells expressing PD-L1 L88S were independent of transcription, we reasoned that this mutation had a lower stability and/or higher turnover as the wt. In accordance with this notion, PD-L1 L88S exhibited a shorter lifetime after blocking protein biosynthesis with cycloheximide (figure 6A,B) or N-glycosylation (figure 6C), which is a key determinant of PD-L1 protein stability,45 with tunicamycin. Although the change from leucine to serine at position 88 might affect intrinsic protein stability, it also creates a potential phosphorylation site within the extracellular domain (ECD). Since homeostatic PD-L1 turnover includes phosphorylation-dependent degradation by the proteasome,45 46 we hypothesized that an additional phosphorylation site might enhance this process. To test this, we focused on the PD-L1 interacting AMP-activated protein kinase (AMPK), which phosphorylates serines within the ECD of PD-L1.46 AMPK inhibition using compound C (dorsomorphin) caused a doubling of PD-L1 L88S protein levels, which was not observed when serine 88 was substituted with alanine (figure 6D). Notably, the turnover of L88A variant was identical to the wt (figure 6A–C). Blocking of the proteasome with MG132 causes an enrichment of the glycosylated and non-glycosylated PD-L1 variants that was substantially stronger in the PD-L1 L88S transduced cell lines (figure 6E). Taken together, our data suggest that the truncating mutation PD-L1 K162fs is degraded by NMD, while the PD-L1 L88S variant creates a new phosphorylation site leading to loss of protein stability and proteasomal degradation.

PD-L1 L88S exhibits enhanced phosphorylation-dependent proteasomal degradation. (A) immunoblot analysis of PD-L1 abundancy in HT-29 (n=6) and UT-SCC-14 (n=4) cells overexpressing PD-L1 variants after blocking protein synthesis with 20 µM CHX for 3, 6 and 9 hours (h). (B) Quantification of (A) and four replicates using ImageJ. (C) Relative stability of PD-L1 protein (=signal intensity relative to control as quantified using ImageJ) in PD-L1 overexpressing cells after abrogation of N-glycosylation for 18 hours using tunicamycin (Tm) as determined by immunoblotting (n=5). (D) Quantification of PD-L1 protein abundancy in PD-L1 overexpressing cells after 2-hour and 4-hour blocking of AMPK with 10 µM compound C (Comp C) as determined by immunoblotting (n=6). (E) Enrichment of PD-L1 variants after inhibition of the proteasome using 20 µM MG132 for 4 hours. Quantification of glycosylated (·) and non-glycosylated (··) PD-L1 from four replicates of PD-L1 transduced HT-29 and UT-SCC-14 cells. Statistics: two-tailed unpaired t-test. Asterisks indicate p value range (*p<0.05; **p<0.01; ***p<0.001; ***p<0.0001; ns>0.05). AMPK, AMP-activated protein kinase; PD-L1, programmed cell death protein ligand 1.
Discussion
We tested the combination of mFOLFOX6, cetuximab and avelumab in patients with RAS/BRAF wt, predominantly MSS mCRC with a high rate of prior adjuvant chemotherapy. The combination was feasible showing a similar profile of adverse events as observed for cetuximab/chemotherapy combinations and ICB alone, except for some cases of unexpected fever episodes.
Despite the high ORR of 81%, the median PFS of 11.1 months did not suggest significant additional benefit of the ICB component in the unselected cohort compared with historical data from other trials (median PFS ranging from 8.6 to 11.1 months).47–50 We therefore looked for subpopulations of patients with potentially increased treatment benefit. While baseline TiLs or T cell metrics were not predictive for treatment benefit, we found a trend toward longer PFS for patients expressing the FcγR3a V-allele that promotes high-affinity receptor interactions that are known to enhance ADCC (as shown, for example, for cetuximab42 43). This subset of patients seemed interesting in that we found some previously recognized ICB resistance mutations (in B2M and JAK genes41) as well as—probably the most salient translational finding in this trial—PD-L1 mutations that abrogated avelumab binding in 3 of 13 patients (3 of 13 patients with the FcγR3 SNP and 3/43 patients in total). Two different PD-L1 mutations were found: one represents a missense mutation at amino acid position 88 that leads to full loss of PD-L1 membrane positivity in on-treatment tumor tissue, but not in immune cells, supporting the view that this mutation was a genetic event selected exclusively in the tumor. Overexpression of PD-L1 L88S in our cell line models showed reduced levels of avelumab binding and activity but not full loss. This discrepancy was most likely due to the unphysiological level of overexpression of PD-L1 in the cell line models. Further experiments showed that loss of membrane PD-L1 on the cell surface in this mutant resulted from introduction of a new phosphorylation site, causing proteasomal degradation. The PD-L1 K162fs variant lacks a transmembrane domain due to a premature stop codon, its mRNA is degraded by NMD and consequently this mutation leads to full loss of PD-L1 on the cell surface. We experimentally showed that the loss of PD-L1 on the tumor cell surface induced by both type of mutations abrogated direct antitumor effects of avelumab (NK-mediated ADCC) while allowing enhanced T cell mediated tumor cell killing.
Together, the emergence of such mutations in patients expressing the FcγR3a V-allele demonstrates the selective pressure of avelumab in this subset. In addition to this general proof of concept, the nature of the detected mutations also provides insight into the mechanisms of action of this antibody. While loss of PD-L1 membrane expression represents a mechanism to evade direct tumor cell killing by avelumab, the loss of this antigen at the same time deprives the tumor of the chance to inactivate T cells. This suggests that direct tumor cell killing by ADCC should be considered a clinically relevant mechanism of action of this antibody. Also, the association of the FcγR3a high-affinity SNP with PD-L1 mutations supported this interpretation. Very interestingly, recognized ICB resistance mutations co-occurred in one patient with a PD-L1 mutation (patient 22). This suggested that the reduction in membrane PD-L1 density allowing to evade avelumab tumor cell killing in this patient came at the price of higher selective pressure by T cells. Most likely, this T cell pressure ultimately led to selection of a tumor cell clone that also evaded T cell recognition by B2M loss and functional impairment of MHC class I antigen presentation. The fact that this patient had a MSI-H tumor suggests that ‘uncompensated’ loss of PD-L1 is likely less tolerated than in MSS tumors. Of note, the three patients with treatment-selected subclonal PD-L1 mutations showed above average PFS (18.1, 21.6 and 14.8 months), a finding that appeared somewhat counterintuitive at first glance since the mutations mediate immune escape to the direct antitumor effects of avelumab. Also, it appeared that in two cases, the mutations were present already many months before clinical resistance occurred: patient 22 showed the mutation in tumor tissue, which was Next-Generation Sequencing (NGS) detectable 10 months before clinical progression (by ddPCR even as a minimal tumor subclone before treatment initiation), and patient 21 showed a very low VAF of this mutation at week 9 on treatment (18 months before progression) before the clone finally achieved a mutant VAF of 3.1% at the time of progression. Together, the long PFS in patients that ultimately developed PD-L1 mutations suggested that these were the patients in whom avelumab was active. The very slow selection dynamics of PD-L1 mutations is also a strong indicator that other effects counteract this resistance mechanism (eg, more efficient T cell killing of PD-L1 loss tumor subclones) or that other components of the regimen may have efficiently suppressed these clones over a long time as observed for the RAS mutant clones in patients 5, 34, 12 and 42. Finally, the disappearance of these mutant subclones in two of two evaluable patients after avelumab withdrawal also points in the direction that these mutations reduce the overall biological fitness of the clone and therefore represent evolutionary dead-ends.
In summary, the addition of avelumab to cetuximab and chemotherapy was feasible and safe. The addition of the experimental ICB component did not result in clear signs of increased activity in this RAS/BRAF wildtype MSS mCRC cohort. Specific subpopulations—such as patients expressing the FcγR3a V-allele—showed a trend toward increased clinical benefit supported by the finding of subclonal PD-L1 escape mutations, which demonstrate the selective pressure exerted by this antibody. Future randomized trials should assess if addition of avelumab to standard of care (FOLFOX/FOLFIRI+EGFR/VEGF antibody) improves outcomes in patients using the FcγR3a V-allele. Given the selection dynamics of PD-L1 escape mutations and their disappearance after antibody withdrawal, such trials may incorporate a liquid biopsy-guided drug-holiday concept.
Data availability statement
Data are available in a public, open access repository. All data relevant to the study are included in the article or uploaded as supplementary information. Data and materials availability: NGS fastq files are deposited at European Nucleotide Archive, ID: PRJEB35507.
Ethics statements
Acknowledgments
We would like to thank all patients and families as well as all participating study centers, the study team at the AIO Studien gGmbH, namely Tobias Meyer and Wolfgang Hiegl at the Institute of Clinical Cancer Research, Krankenhaus Nordwest, Frankfurt, and the medical monitor at the University Cancer Center Hamburg Franziska Stein. Moreover, we would like to thank Malik Alawi and Michael Spohn from the UKE bioinformatics core facility for bioinformatical support, and Anja Haak for analysis of microsatellite status. We would also like to thank Alexander Navarrete-Santos and the cell sorting core facility at the University Hospital Halle (Saale) as well as Nadine Bley and the Core Facility Imaging at the Martin-Luther-University Halle (Saale).
References
Supplementary materials
Supplementary Data
This web only file has been produced by the BMJ Publishing Group from an electronic file supplied by the author(s) and has not been edited for content.
Footnotes
Twitter @DonjeteS, @lab_binder
AS, DS and CS contributed equally.
Contributors Conceptualization: AS, EG and SHB, MBi; methodology: AS, DS, CS, LvW, LP, RS, MBa, CM, BS, CW and MBi; investigation: AS, DS, CS, LvW, LP, RS, MBa, CM, BS, CW, MBi, EG and SHB; formal analysis: EW and AH; data curation: LW; writing – original draft: AS, DS, CS, LvW, LP, RS, MBa, CW, MBi, EG, SHB and AH; writing – review and editing: AS, DS, CS and MBi; recources: JT, MS, SL, JKS, RD, TE, SD, SEA, MK, UP, CB, AS, EG and SHB; supervision: MBi, AS and SHB. All authors had access to the study data and reviewed and approved the final manuscript.
Funding The legal sponsor of the trial is the AIO Studien gGmbH, Berlin Germany. Merck KGaA Darmstadt, Germany, as part of an alliance between Merck KGaA and Pfizer supported the trial with study medication and a research grant to the AIO.
Competing interests AS received institutional research grants from Merck, BMS, Roche, Sanofi, Servier and honoraria for lectures and advisory board meetings by Merck, Roche, Amgen, Lilly, Sanofi-Aventis, Servier, Bayer, BMS, MSD and Sirtex. S-E A-B has an advisory role with Merck, Roche, Celgene, Lilly, Nordic Pharma, Bristol-Myers Squibb, Astellas and MSD Sharp & Dohme; is a speaker for Roche, Celgene, Lilly, Nordic Pharma, AIO gGmbH, MCI, promedicis, Forum für Medizinische Fortbildung and Taiho pharma; he is CEO/founder of IKF Klinische Krebsforschung GmbH at Northwest Hospital; and has received research grants from Sanofi, Merck, Roche, Celgene, Vifor, Medac, Hospira, Lilly, Eurozyto, German Cancer Aid (Krebshilfe), German Research Foundation and the Federal Ministry of Education and Research. UP received institutional research grants from Celgene, BMS, Amgen, Lilly, Roche, Sanofi and Servier and honoraria for lectures and advisory board meetings by Roche, Celgene, Amgen, Lilly, Sanofi-Aventis, Servier, Bayer and BMS. AH received honoraria for lectures from Roche. CB received institutional research grants and honoraria for lectures and advisory board meetings from Merck, BMS, Roche, Sanofi, Servier, Bayer, BMS, Astrazeneca, Lilly, Mundipharma, Hexal, MSD and GSO. MB received institutional research grants from Merck, BMS, Hexal, German Cancer Aid (Krebshilfe), German Research Foundation and the Federal Ministry of Education and Research as well as honoraria for lectures and advisory board meetings by Celgene, Janssen, Gilead, Merck, Roche, Amgen, Sanofi-Aventis and BMS.
Provenance and peer review Not commissioned; externally peer reviewed.
Supplemental material This content has been supplied by the author(s). It has not been vetted by BMJ Publishing Group Limited (BMJ) and may not have been peer-reviewed. Any opinions or recommendations discussed are solely those of the author(s) and are not endorsed by BMJ. BMJ disclaims all liability and responsibility arising from any reliance placed on the content. Where the content includes any translated material, BMJ does not warrant the accuracy and reliability of the translations (including but not limited to local regulations, clinical guidelines, terminology, drug names and drug dosages), and is not responsible for any error and/or omissions arising from translation and adaptation or otherwise.