Article Text

Abstract
Background Durable efficacy of immune checkpoint blockade (ICB) occurred in a small number of patients with metastatic gastric cancer (mGC) and the determinant biomarker of response to ICB remains unclear.
Methods We developed an open-source TMEscore R package, to quantify the tumor microenvironment (TME) to aid in addressing this dilemma. Two advanced gastric cancer cohorts (RNAseq, N=45 and NanoString, N=48) and other advanced cancer (N=534) treated with ICB were leveraged to investigate the predictive value of TMEscore. Simultaneously, multi-omics data from The Cancer Genome Atlas of Stomach Adenocarcinoma (TCGA-STAD) and Asian Cancer Research Group (ACRG) were interrogated for underlying mechanisms.
Results The predictive capacity of TMEscore was corroborated in patient with mGC cohorts treated with pembrolizumab in a prospective phase 2 clinical trial (NCT02589496, N=45, area under the curve (AUC)=0.891). Notably, TMEscore, which has a larger AUC than programmed death-ligand 1 combined positive score, tumor mutation burden, microsatellite instability, and Epstein-Barr virus, was also validated in the multicenter advanced gastric cancer cohort using NanoString technology (N=48, AUC=0.877). Exploration of the intrinsic mechanisms of TMEscore with TCGA and ACRG multi-omics data identified TME pertinent mechanisms including mutations, metabolism pathways, and epigenetic features.
Conclusions Current study highlighted the promising predictive value of TMEscore for patients with mGC. Exploration of TME in multi-omics gastric cancer data may provide the impetus for precision immunotherapy.
- tumor microenvironment
- computational biology
- gastrointestinal neoplasms
- immunotherapy
Data availability statement
Data are available in a public, open access repository. Data are available upon reasonable request. Data may be obtained from a third party and are not publicly available. The raw sequencing data have been deposited at the European Nucleotide Archive and are available under accession number RJEB25780. The analytic code and package used to estimate the TMEscore and prevalent signature are provided for non-commercial use at GitHub:https://github.com/DongqiangZeng0808/TMEscore and https://github.com/IOBR/IOBR. A detailed README file is also available, complete with examples of how to use the package.
This is an open access article distributed in accordance with the Creative Commons Attribution 4.0 Unported (CC BY 4.0) license, which permits others to copy, redistribute, remix, transform and build upon this work for any purpose, provided the original work is properly cited, a link to the licence is given, and indication of whether changes were made. See https://creativecommons.org/licenses/by/4.0/.
Statistics from Altmetric.com
Background
Clinical trials of immune checkpoint blockade (ICB), antibodies, such as anti-programmed cell death protein 1 (PD-1) and anti-programmed death-ligand 1 (PD-L1), showed manageable toxicity and antitumor activity in patients with advanced gastric cancer (GC) in the ATTRACTION-2 and KEYNOTE-059 trials.1 2 However, different studies with ICB treatment revealed a highly variable objective response rate, ranging from 10% to 26% in patients with GC.1 3 4 Hence, the precise biomarkers to discriminate potential responders to immune therapies remains an urgent priority.
The biomarkers predictive of ICB response are under investigation. Currently, PD-L1 combined positive score (CPS), microsatellite instability-high (MSI-H), and tumor mutation burden (TMB) are widely recognized as promising biomarkers suggest greater efficacy of ICB despite some limitations.5 6 Immunohistochemistry (IHC)-based PD-L1 CPS, is most adopted but controversial for the PD-L1 expression heterogeneity, unstandardized detective process, and various positive criteria.7 Besides, ATTRACTION-2 suggested that the survival benefit with nivolumab in GC was independent of PD-L1 positivity (<1% vs ≥1%), indicating that PD-L1 positivity might omit part of responders.1 Patients with high TMB have a higher chance of mobilizing host immune reaction, thus responding to ICB, but facing several measurement hurdles.8–10 Likewise, MSI-H leads to the accumulation of somatic mutations and is rarely detected in patients with GC.11 12 The common ground of these biomarkers is the focus on the inherent characteristics of tumor cells and the neglection of the interactions with the tumor microenvironment (TME) components,13 thus partially interpreting unsatisfactory results in GC clinical trials exploring predictive biomarkers towards ICB.
The TME comprizing various immune cells, stromal cells, and extracellular components, profoundly affects tumorigenesis, progression, and therapeutic resistance.14–17 Increasing evidence indicated the implication of TME in the antitumor process, which can facilitate ICB response prediction.15 18 Researches reveal that a fraction of cancer-associated fibroblasts (CAFs), myeloid-derived suppressor cells, and macrophages can hijack ICB immunotherapy.6 17 19 Additionally, the TME stromal signals of the epithelial–mesenchymal transition (EMT)-related gene signature and transforming growth factor-beta (TGF-β)6 20 restrain antitumor immunity and response to ICB. However, ways to integrate these parameters lack full exploration, hindering optimizing selection strategies for potential ICB responders. Obstacles include an inaccurate combination of these parameters and uncertain interactions of these signatures.
Investigating the multi-omics data of 1524 patients with GC, we previously established a methodology termed TMEscore15 to evaluate the immune cell infiltration pattern. TMEscore is promising in determining the responsiveness to ICB in melanoma and metastatic urothelial cancer. For improvement, we optimized the TMEscore evaluation and verified its clinical utility in advanced gastric cancer using NanoString technology.18 21 22 We incorporated our TME-evaluation methodology into an open-source R package, TMEscore, to predict tumor immunogenicity and ICB sensitiveness from bulk transcriptomic data. To understand the TMEscore-related tumor intrinsic characteristics and antitumor immunity, we comprehensively analyzed the genomic characteristics, molecular subtypes, metabolic, and methylation features. The genomic and molecular biomarkers of response and resistance to ICB we identified demonstrates the complex host-tumor interplay in treatment response.
Methods
Human gastric cancer specimens and NanoString gene expression analysis
Formalin-fixed paraffin-embedded or fresh-frozen tumor tissue from multiple clinical centers was collected retrospectively at baseline before receiving checkpoint immunotherapy. Tumor responses were evaluated according to RECIST V.1.1 criteria. Tumor specimens derived from patients with mGC (up to 90 days from treatment start) were conducted as previously described by Ayers et al.21 Of 70 specimens from five clinical centers (Nanfang Hospital of Southern Medical University, Sun Yat-sen University Cancer Center, Guangdong Provincial Hospital of Chinese Medicine, The Sixth Affiliated Hospital of Sun Yat-sen University and The First Affiliated Hospital of Sun Yat-sen University), 48 specimens were of sufficiently high quality for RNA evaluation. A minimum of approximately 80 ng of total RNA was used to measure the expression of 51 TMEscore genes, comprizing 25 TME signature A genes, 19 TME signature B genes and some checkpoint-related genes (eg, PD-L1, LAG3, PDCD1LG2, CTLA4, TIGIT, TIM3 and PDCD1), and 10 housekeeping genes (ACTB, ABCF1, B2M, G6PD, GAPDH, GUSB, PGK1, RPLPO, TFRC and TUBB) using the nCounter platform (NanoString Technologies; Seattle, Washington, USA).22 Data was normalized using the housekeeping genes.
Gastric cancer specimens derived from clinical trial
Prospective, open-label, phase 2 trial (NCT02589496) of advanced gastric cancer was designed as a single-arm, phase 2 study at Samsung Medical Center. Immune checkpoint inhibitor (pembrolizumab) 200 mg was administered as 30 min intravenous infusion every 3 weeks until documented disease progression, unacceptable toxicity, or up to 24 months. Tumor responses were evaluated every two cycles according to RECIST V.1.1 criteria. Toxicities were graded based on the National Cancer Institute Common Terminology Criteria for Adverse Events V.4.0. Tumor sample collection, eligibility criteria, PD-L1 IHC, MSI status determination, Epstein-Barr virus (EBV) in situ hybridization, tissue genomic analysis, and RNA sequencing pipeline of this cohort were detailed in our previous research.5
Other patient cohorts used in this study
Patient cohorts used in this study are summarized in online supplemental table S1. Seven genomic and transcriptomic data sets from patients with metastatic urothelial cancer treated with an anti-PD-L1 agent (NCT02951767),6 patients with metastatic melanoma and non-small-cell lung cancer treated with MAGE-3 agent-based immunotherapy (NCT00706238),23 patients with advanced melanoma treated with PD-1 blocker,24 patients with advanced melanoma treated with various types of immunotherapy from The Cancer Genome Atlas of Skin Cutaneous Melanoma (TCGA-SKCM) cohort,25 patients with melanoma treated with anti-CTLA-4 (cytotoxic T-lymphocyte-associated protein 4) or PD-1 (programmed cell death protein 1) antibody,26 and mouse model treated with anti-CTLA-427 were downloaded and analyzed to determine the predictive capacity of TMEscore and were compared with its counterparts.
Supplemental material
TMEscore evaluation, immune cell deconvolution and signature score estimation
For the gene expression (normalized by RMA, TPM, FPKM or housekeeping genes) matrix, the expression of each gene in a signature was standardized so that its mean expression was 0, and the SD was 1 across samples. Then, PCA was performed, and principal component 1 was extracted to serve as the gene signature score. This approach had the advantage of focusing the score on the set with the largest block of well-correlated (or anti-correlated) genes in the set, while down-weighting contributions from genes that do not track with other set members.6 15 As our previous study15 indicated, TMEscore of each patient was estimated by the formula: TMEscore = ∑ PC1i – ∑PC1j, where i is the signature score of clusters whose Cox coefficient is positive, and j is the expression level of the gene whose Cox coefficient is negative. The analytic code and package used to perform the TMEscore estimation are provided for non-commercial use at GitHub: https://githubcom/DongqiangZeng0808/TMEscore. To characterize the metabolism, immune microenvironment and other prevalent gene signatures activation in each tumor sample, multi-algorithms were applied to determine the pathway activity using IOBR package (https://github.com/IOBR/IOBR).28 ImmuneScore, Stromalscore, and tumor purity were assessed computationally in RNA-seq data using the ESTIMATE algorithm29 that uses gene expression signatures to infer the fraction of stromal and immune cells in tumor samples. Other computational algorithms and tools used to estimate the microenvironment were detailed in the online supplemental methods.
Supplemental material
Differentially gene expression analysis
All differential gene analyses were conducted using the DESeq2 package.30 Differential gene expression analysis was performed using a generalized linear model with the Wald statistical test, with the assumption that underlying gene expression count data were distributed per a negative binomial distribution with DESeq2. DEGs were considered for further analysis with a q value<0.05. The adjusted p value for multiple testing was calculated using the Benjamini-Hochberg correction.31
Identification of TMEscore relevant mutations and mutational signatures
The mutation MAF files were downloaded with TCGAbiolinks,32 and the mutation status and mutation burden were inferred from the MAF files. Mann-Whitney U test was adopted to define the significance of binary variables (wild type or mutated). We applied the Benjamini-Hochberg method to convert the p values to adjusted p values.31 The mutational signature analysis was performed using the deconstructSigs package33 in R, which selects combinations of known mutational signatures34 that account for the observed mutational profile in each sample.
Functional and pathway enrichment analysis
Gene annotation enrichment analysis was performed with the R package clusterProfiler.35 Enrichment p values were based on 1000 permutations and subsequently adjusted for multiple testing using the Benjamini-Hochberg procedure to control the false discovery rate (FDR).31 Gene Ontology (GO) and KEGG terms were identified with a strict cut-off of p<0.01 and an FDR of less than 0.05. We also identified pathways that were up-regulated and down-regulated among groups by running a gene set enrichment analysis (GSEA)36 of the adjusted expression data for all transcripts.
Single-sample gene-set enrichment analysis of tumor processes
To characterize the tumor processes and pathway activation status in each tumor sample, a ssGSEA algorithm37 was applied to determine the pathway activity using GO,38 KEGG39 and HALLMARK gene sets derived from MSigDB (V.6.2).40 Other prevalent gene signature scores with respect to the TME, tumor intrinsic pathway, and metabolism were calculated for each sample using the PCA algorithm by IOBR package.28
Differentially methylated probes analysis
Methylation data (β values of Illumina Infinium HumanMethylation450) of The Cancer Genome Atlas of Stomach Adenocarcinoma (TCGA-STAD) patients were obtained through TCGAbiolinks.32 β values reported by the 450K Illumina platform for each probe were set as the methylation level measurement for the targeted CpG site. Methylation data quality control, normalization, and filtering of redundant probes were conducted using the pipeline of the ChAMP. Differentially methylated probes (DMP) analysis was detected by the ‘champ.DMP’ function of ChAMP package.41 DMPs were considered for further analysis with a q value <0.05. The adjusted p value for multiple testing was calculated using the Benjamini-Hochberg correction.31
Statistical analysis
The normality of the variables was tested by the Shapiro-Wilk normality test. For comparisons of two groups, statistical significance for normally distributed variables was estimated by an unpaired Student’s t-test, and non-normally distributed variables were analyzed by the Mann-Whitney U test. For comparisons of more than two groups, the Kruskal-Wallis and one-way analysis of variance tests were used for non-parametric and parametric methods, respectively. The correlation coefficient was computed by Spearman and distance correlation analyses. Χ2 test and two-sided Fisher’s exact tests were used to analyze contingency tables. The cut-off values of each data set were evaluated based on the association between survival outcome and signature score in each separate data set using the survminer package. The Kaplan-Meier method was used to generate survival curves for the subgroups in each data set, and the log-rank (Mantel-Cox) test was used to determine if they were statistically different. The HRs for univariate analyses were calculated using the univariate Cox proportional hazards regression model. The sensitivity and specificity of signature scores were depicted by the receiver operating characteristic (ROC) curve and quantified by the area under the ROC using the pROC package.42 The ‘roc.test’ function of pROC package was used to compare the area under the curve (AUC) or partial AUC of two correlated or uncorrelated ROC curves. All statistical analyses were conducted using R V.3.6.3.0 (https://www.r-project.org/), and the p values were two-sided. P values of less than 0.05 were considered statistically significant.
Results
TMEscore predicts ICB response of gastric cancer
To optimize the TME assessment for more efficient clinical translations, feature engineering (see online supplemental methods) was conducted in six ICB data sets (online supplemental table S1) and reduced TMEscore15 signature genes from 244 to 44. As previous research suggested,15 genes negatively associated with ICB response were enriched in immune exclusion phenotype (EMT/TGF-β pathway), whereas the immune relevant genes positively associated with treatment efficacy figure 1A, (online supplemental figure S1A). In several GC cohorts (online supplemental table S1), we found a consistent and closed association between the 44-gene TMEscore and the prior TMEscore measured of 244 genes (online supplemental figure S1B). Notably, the TMEscore was capable of serving as a prognostic biomarker of immunotherapy meta-cohort (GSE78220,24 IMvigor210,6 GSE93157,43 Snyder et al44 and TCGA-SKCM25) (figure 1B: TMEscore, p=0.0001; online supplemental figure S1C): TMEscoreA, p<0.0001 and online supplemental figure S1D: TMEscoreB, p=0.0396, respectively), and a predictive biomarker of ICB response in several independent cohorts (online supplemental figure S1E–L, online supplemental table S2. The AUCs of eight independent data sets indicated that the predictive value of simplifying TMEscroe (44 genes) was enhanced after dimension reduction (online supplemental figure S1E–L). In the advanced GC cohort receiving anti-PD-1 immunotherapy,5 the TMEscore yielded the highest AUC (AUC=0.891), surpassing other prevalent biomarkers, including MSI status, TMB, CPS and EBV infection (AUC=0.708, 0.672, 0.817, and 0.708, respectively) (figure 1C and online supplemental table S3), and several transcriptomic-based predictive counterparts, comprizing gene expression profile score (GEPs),18 ImmunoScore,29 CD8+ T effector score, and pan-fibroblast TGF-β response signature (Pan-F-TBRs)6(figure 1D).
Supplemental material
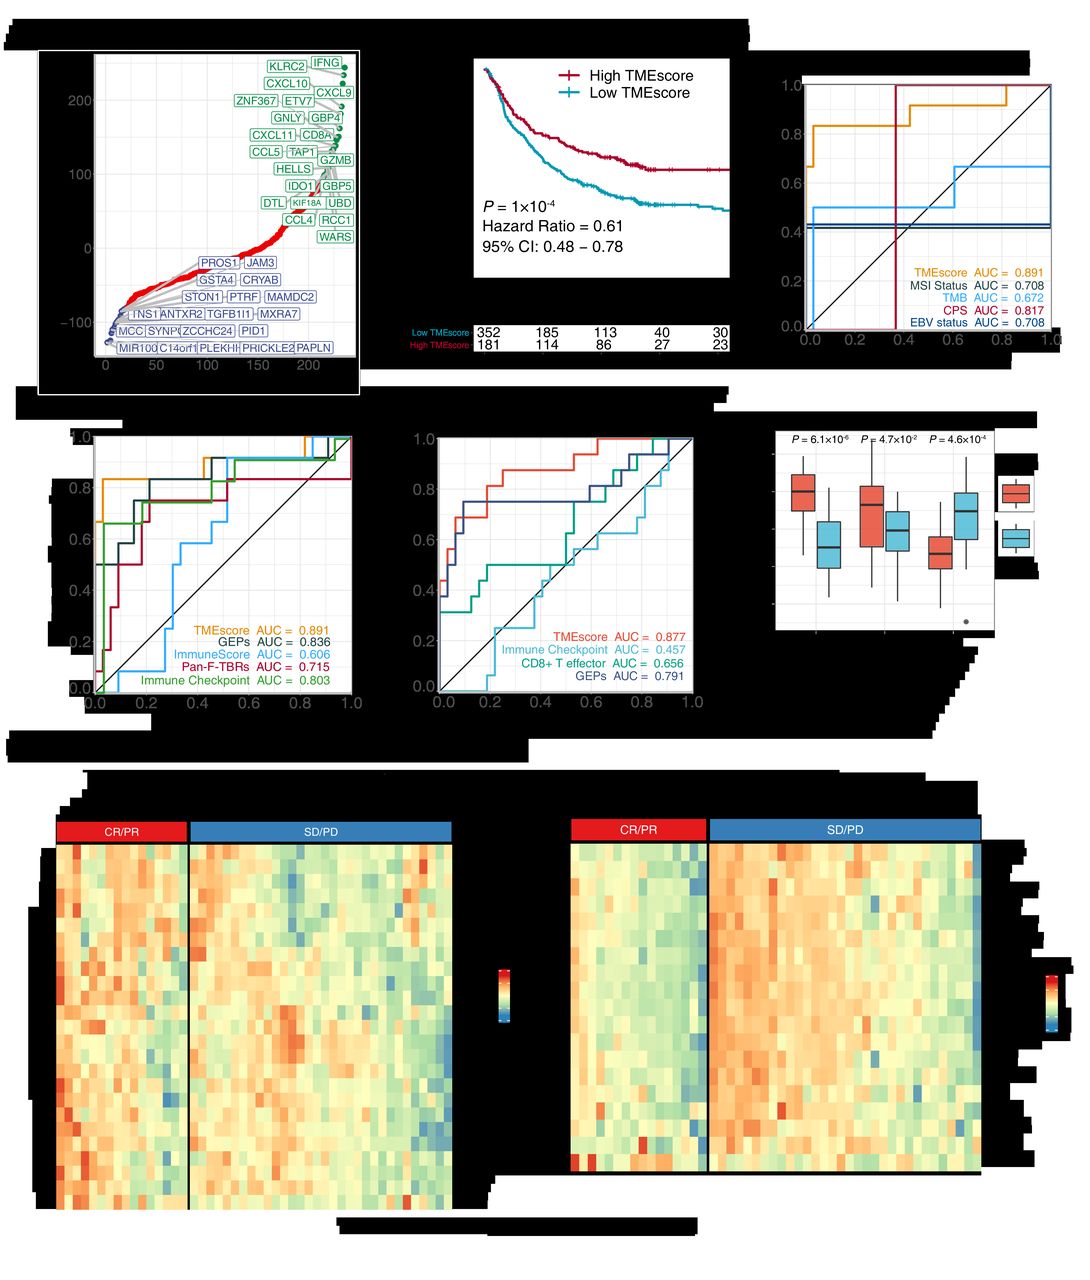
TMEscore holds promise in predicting immunotherapeutic response. (A) Feature engineering was conducted to minimize the number of TMEscore signature genes. Gene importance was exhibited with genes significantly associated with favorable immune checkpoint blockade (ICB) responses (top right, green), and genes correlated positively with immune exclusion and negatively with immunotherapeutic efficacy (bottom left, blue). (B) Kaplan-Meier survival analysis demonstrated that a high TMEscore was significantly related to more favorable overall survival in the study of multiple meta-data (p=1×10⁻⁴, HR=0.61, 95% CI: 0.48 to 0.78, cut-off=0.08). (C) Receiver operating characteristic (ROC) analyses indicated that the TMEscore harbored the highest area under the curve (AUC) (AUC=0.891) in comparison with other reported biomarkers of ICB, comprizing microsatellite instability (MSI) status, tumor mutation burden (TMB), programmed death-ligand 1 combined positive score (CPS), and Epstein-Barr virus (EBV) status in gastric cancer (AUC=0.708, 0.672, 0.817, 0.708, respectively; p values of pair comparison test see online supplemental table S7). (D) Tumor microenvironment (TME) relevant signatures and the TMEscore are estimated to compare the predictive sensitivity for responses. ROC analyses suggested that the TMEscore substantially outperformed these published transcriptomic-based methodologies for prediction of ICB treatment response, including gene expression profile scores (GEPs), ImmunoScore, pan-fibroblast transforming growth factor-beta (TGF-β) response signature (pan-fibroblast TGF-β response signature), and immune checkpoint (AUC=0.836, 0.606, 0.715, 0.803, respectively; detailed p values of pair comparison test see online supplemental table S7) (E–H) The predictive capacity of TMEscore for treatment response is corroborated in a multicenter clinical gastric cancer cohort. TMEscore possessed highest AUC surpassing immune checkpoint, CD8+ effector T cell and GEPs (AUC=0.877, 0.457, 0.656, 0.791, respectively); (E). Box plot supported that elevated TMEscore and TMEscoreA, as well as decreased TMEscoreB of responders (CR/PR) versus non-responder (SD/PD) in multicenter cohort (p=6.1×10⁻⁶, 4.7×10⁻², 4.6×10⁻⁴, respectively); (F). Heatmaps exhibited the signature genes expression of TMEscoreA (G) and TMEscoreB (H), respectively, in the responsive (CR/PR) and the progressive (SD/PD) gastric cancer, validating prior results. CR, complete response; PD, progressive disease; PR, partial response; SD, stable disease.
We further measured expression of TMEscore genes in the tumor microenvironment, using NanoString nCounter platform22 and RNA isolated from tumor tissue obtained at baseline from 48 patients with advanced gastric cancer of multicenter before receiving ICB (table 1 and online supplemental table S4). Apparently, TMEscore achieves an overall accuracy of AUC=0.877, which is higher than other prevalent gene signature predictors6 18 21 and capturing almost all true responders (figure 1E,F). Consistent with our previous study,15 regressive tumors (complete response (CR)/partial response (PR)) were observed markedly higher TMEscoreA than stable and progressive tumors (progressive disease (PD)/stable disease (SD)), and TMEscoreB was negatively associated with the treatment efficacy of advanced GC (figure 1F, statistical p value of TMEscore, TMEscoreA and TMEscoreB were 6.1×10⁻⁶, 0.047 and 0.00046, respectively), implicating stromal activation as a critical mechanism of resistance to ICB.6 15 TMEscoreB (stromal-relevant) genes were more precise biomarker and significantly associated with treatment resistance, while TMEscoreA (immune-relevant) genes were highly expressed in a few non-responders (SD/PD) (figure 1G,H).
Baseline characteristics of patients with advanced gastric cancer
TMEscore predicts efficacy of checkpoint immunotherapy alone or combination with chemotherapy or angiogenesis inhibitor
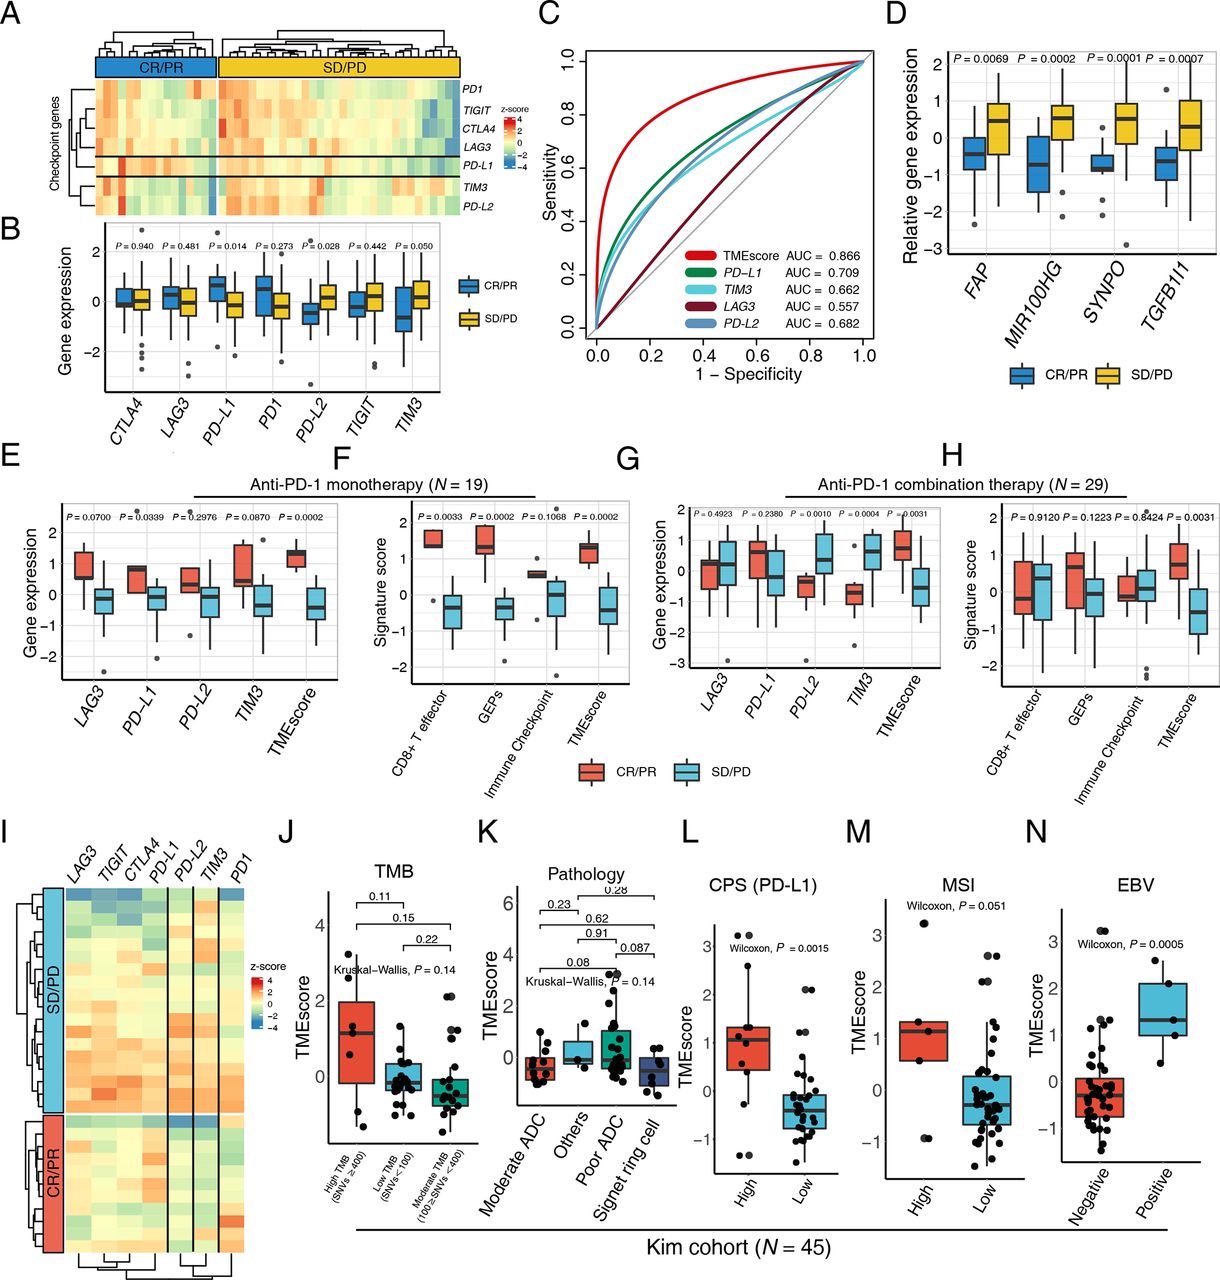
To provide a precise map for understanding TMEscore performance in the context of mono- and combinational immunotherapy, we further explored the NanoString result of a 48 patients gastric cancer cohort. The expression of PD-L1 is prevailingly enriched in the responsive subset (CR/PR) relative to the progressive counterparts (figure 2A–C and online supplemental table S5). Intriguingly, the PD-L2 and TIM3 were significantly higher in non-responsive tumor, suggesting that upregulations of other corresponding or bypass checkpoint pathway may contribute to the resistance of PD-1 blockades (figure 2B–D and online supplemental table S5), by which according to reports the stromal activation and T-cell exclusion were induced.6 Additionally, SYNPO was reported to be upregulated during CAF activation,45 which is the critical mechanism of ICB resistance.

TMEscore predicts efficacy of checkpoint immunotherapy alone or combination with chemotherapy. (A) A heatmap numerated the expression of various immune checkpoint genes in the responder (blue) and the non-responder (yellow) subsets, highlighting upregulation of programmed death-ligand 1 (PD-L1) in responsive patients in a multicenter cohort of gastric cancer. (B) The box plot compared the expression levels of immune checkpoint genes in the responsive (blue) and non-responsive (yellow) cancer settings and corresponding p values were displayed on the top. (C) Receiver operating characteristic curve analysis demonstrated that the TMEscore with highest predictive efficacy for therapy sensitivity (area under the curve (AUC)=0.866), outperforming all the immune checkpoints comprizing PD-L1, TIM3, LAG3, and PD-L2 (AUC=0.709, 0.662, 0.557, 0.682, respectively). (D) An elevation of stromal activation indexes, including FAP, MIR100HG, SYNPO and TGFB1l1 (p=0.0069, 0.0002, 0.0001, 0.0007, respectively), was discovered in the patients with complete response (CR) or partial response (PR) relative to the counterparts. (E–H) An upregulation of the aforementioned immune checkpoints (E) and immunotherapy pertinent biomarkers (F) including TMEscore, was measured in the context of anti-programmed cell death protein 1 (PD-1) monotherapy, as well as anti-PD-1 combination therapy (G–H). Relevant p values were depicted on the top. (I) Heatmap demonstrated aforementioned immune checkpoint expression discrepancies in the setting of anti-PD-1 combination therapy responder (red) and non-responder (blue), indicative of the upregulation of PD-L2 and TIM3 in the non-responsive subset. (J) No statistical significance was observed between tumor mutation burden (TMB) and TMEscore (Kruskal-Wallis test, p=0.14). The number of non-synonymous single nucleotide variant ≥400 was defined as high mutational load (high TMB); 100–400, moderate mutation load (moderate TMB); and <100, low mutation load (low TMB). (K) A boxplot exhibited bare statistical significance in TMEscore diversity among different pathologies of gastric cancers (Kruskal-Wallis test, p=0.14). (L) An increase of TMEscore was observed in PD-L1 combined positive score (CPS) positive patients (Wilcoxon, p=0.0015). The specimen was considered to have high PD-L1 expression if CPS≥1. (M–N) A boxplot demonstrated that gastric cancers with high microsatellite instability (MSI) status (M) (Wilcoxon, p=0.051) and positive Epstein-Barr virus (EBV) infective status (N) (Wilcoxon, p=0.0005) harbored an elevated TMEscore. ADC, adenocarcinoma; PD, progressive disease; SD, stable disease.
The clinical benefit of ICB monotherapy for advanced gastric cancer is limited, and recent clinical trials have demonstrated that combinations of ICBs with chemotherapy, anti-vascular targeted therapy or other molecular targeted therapies significantly improve treatment outcomes such as CheckMate-649.46 47 Consequently, there will be a pressing need for biomarkers that can be applied for patient selection for anti-PD-1 immunotherapy and chemotherapy combination. Among the multicenter data of GC, 19 patients received ICB monotherapy, and 29 patients were treated with ICBs combined with chemotherapy or other inhibitors (table 1). We systematically evaluated aforementioned biomarkers in both ICB monotherapy and the combination treatment settings. The majority of ICB relevant genes and immune relevant signatures were positively related to favorable mono-immunotherapy response, corroborating former discoveries (figure 2E,F and online supplemental figure S2A,B). Whereas their predictive efficacy significantly slid in therapy combination subset, especially the signatures related with immune activation (figure 2G,H). However, the TMEscore still harbored robust predictive capacities in both settings (figure 2G,H), possibly attributing to the superiorly essential influence exerted by stromal activation during synergic treatment (online supplemental figure S2C,D). Comparable trend of PD-L2 and TIM3 expression were also exhibited in the synergic therapy. Their upregulations in progressive patients suggested the potential pivotal molecular characteristics in shaping tumor immune evasion (figure 2G,I), which also implied the existence of synchronously upregulation of immune checkpoint pertinent genes, indicating this subset of patients may be latent candidate to benefit from PD-L2 or TIM3 pathway inhibitions.
TMEscore accurately identifies more patients than MSI, EBV and TMB in mGC
In order to assess the predictive value and underlying mechanisms of TMEscore in advanced GC systematically, we performed integrative analysis across multi-omics data of advanced GC treated with pembrolizumab as a salvage treatment (NCT02589496, N=45) (online supplemental table S3), TCGA-STAD (N=375),11 and Asian Cancer Research Group (ACRG, N=299)12 cohorts (online supplemental table S6). A combination of the TMEscore with TMB or CPS (AUC=0.964, 0.973, respectively) observed a slight elevation in the AUC compared with TMEscore alone (AUC=0.921), despite no statistically significant discrepancy observed in pairwise comparisons (online supplemental figure S2E and online supplemental table S7). Intriguingly, the TMEscore was not correlated with tumor somatic mutation burden and histology subtypes in Kim cohort (figure 2J,K). However, in markedly stratified patients, when referring to levels of some biomarkers associated with ICB responsiveness,5 48 such as tumorous PD-L1 expression evaluated using CPS, MSI status and EBV infection, respectively (figure 2L–N). Accordingly, our analyses indicated that the TME estimation might have an alternative and more amenable mechanism than that of tumor intrinsic genomic features to serve as a robust biomarker for predicting ICB responses in advanced GC.
We depicted a landscape of the TME signature score, clinicopathological features, and molecular characterization in patients with metastatic GC treated with anti-PD-1 immunotherapy5 to investigate factors potentially associated with the treatment efficacy of ICB. We observed that patients with better responses were more likely to possess EBV and MSI-H molecular subtypes but were rarely enriched in chromosomal instability (CIN), genomically stable (GS), and EMT molecular subtypes (figure 3A, EBV and MSI-H: responders (n=9), non-responders (n=0); GS and CIN: responders (n=3), non-responders (n=33); p=2.5×10⁻⁷, Fisher’s exact test). Consistent with our recent research15 in TCGA-STAD and ACRG cohorts, the TMEscore was significantly higher in patients with MSI-H and EBV subtypes, relative to CIN and GS (figure 3B, p=0.003), suggesting that the predictiveness of the TMEscore was mostly contributed to molecular phenotype stratification. We next examined the predictive capacity of gene signatures and prevalent biomarkers in stratified patients with EBV and MSI-H molecular subtypes that indicates better responses to ICBs.48 49 ROC analyses indicated that the TMEscore (AUC=0.895) was superior in predicting EBV and MSI-H molecular subtypes, compared with MSI status, TMB, CPS, EBV status, GEPs, ImmuneScore, Pan-F-TBRs, and Immune Checkpoint (AUC=0.778, 0.781, 0.797, 0.708, 0.847, 0.646, 0.764, 0.767, respectively; online supplemental figure S2F–H and online supplemental table S7).
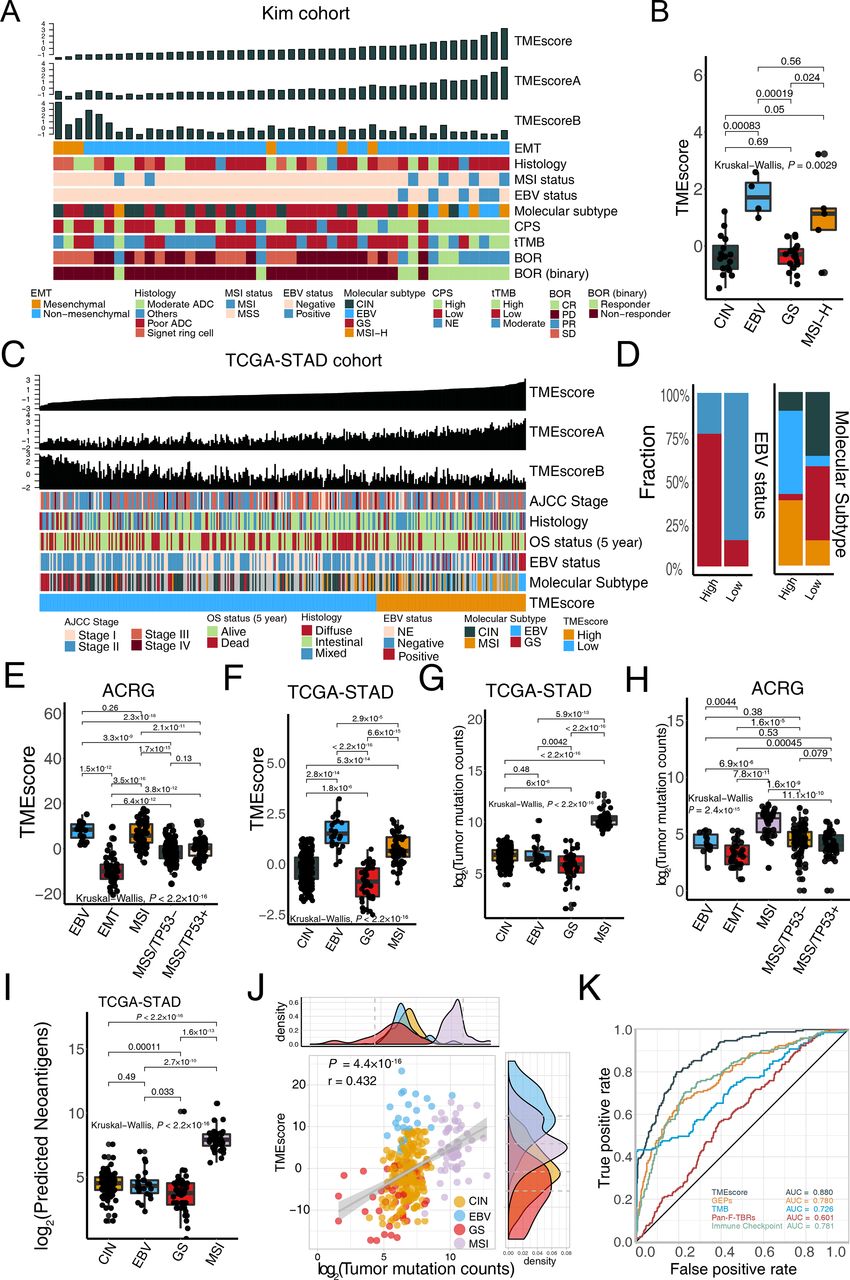
TMEscore is closely correlated with microsatellite instability-high (MSI-H) and Epstein-Barr virus (EBV) infective status in gastric cancer. (A) For each patient (columns) with metastatic gastric cancer, clinicopathological features and molecular characterizations were annotated. Column annotations represent epithelial–mesenchymal transition (EMT) (mesenchymal, non-mesenchymal); histology (moderate adenocarcinoma (ADC), poor ADC, signet ring cell, others); MSI status (MSS, MSI); EBV status (negative, positive); molecular subtype (chromosomal instability (CIN), EBV, genomically stable (GS), MSI-H); programmed death-ligand 1 combined positive score (CPS) (high, low, NE); tissue tumor mutation burden (tTMB); best overall response (BOR) (CR, PR, PD, SD); and binary BOR (responder, non-responder) for each sample. TMEscore, TMEscoreA, and TMEscoreB are displayed at the top of the panel. A high TMEscore is capable of identifying patients with EBV positive and MSI-H and responders to immune checkpoint blockade. (B) EBV and MSI gastric molecular subtype were substantially associated with higher TMEscore in the Kim cohort (Kruskal-Wallis test, p=0.0029). (C–D) For each patient (columns) in The Cancer Genome Atlas of Stomach Adenocarcinoma (TCGA-STAD) cohort, the landscape of clinicopathological features and molecular characterizations are displayed. Column annotations represent the AJCC stage (stage I, II, III, IV); OS 5-year (alive, dead); histology (diffuse, intestinal, mixed); EBV status (negative, positive, NE); molecular subtype (CIN, EBV, GS, MSI-H); and TME subtype (high, low) for each sample. TMEscore, TMEscoreA, and TMEscoreB are displayed at the top of the panel (C). Analysis of TCGA-STAD cohort corroborated that patients with EBV positive and MSI-H harbored a higher TMEscore (D) (Fisher’s exact test, p<2.2×10⁻¹⁶). (E–H) Boxplots indicated the TMEscore is substantially elevated in EBV and MSI molecular subtype either in both Asian Cancer Research Group (ACRG) (E) (Kruskal-Wallis test, p<2.2×10⁻¹⁶) and TCGA-STAD cohorts (F) (Kruskal-Wallis test, p<2.2×10⁻¹⁶). However, TMB is positively related to the MSI subtype but is not predictive of EBV status in both TCGA-STAD cohort (G) (Kruskal-Wallis test, p<2.2×10⁻¹⁶) and ACRG cohort (H) (Kruskal-Wallis test, p=2.4×10⁻¹⁵). (I) Neoantigens failed to identify EBV status in TCGA-STAD cohort, despite its significant correlation with MSI-H subtype (Kruskal-Wallis test, p<2.2×10⁻¹⁶). (J) A dotplot demonstrated a close correlation between TMB and the TMEscore. Every single dot represents one sample, corresponding molecular subtypes are identified in different colors (CIN: yellow, EBV: blue, GS: red, MSI: pink) (Spearman test, r=0.432, p=4.4×10⁻¹⁶). (K) ROC analyses suggested the TMEscore was predictive of EBV and MSI status of gastric cancer in TCGA-STAD and ACRG cohorts (n=634), with a higher AUC than that of gene expression profile scores and TMB (AUC=0.88, 0.78, 0.726, respectively). AJCC, The American Joint Committee on Cancer; OS, overall survival; CR, complete response; NE, unknown; PD, progressed disease; PR, partial response; SD, stable disease.
To validate above findings, we performed the same statistical analyses in two large multi-omics GC cohorts.11 12 We next focused on TCGA-STAD cohort11 and analyzed the clinical features (figure 3C and online supplemental figure S3A). In the low TMEscore group, the MSI and EBV subtypes were largely absent, while they took the majority of the group with the high TMEscore (EBV and MSI-H: high TMEscore (n=48), low TMEscore (n=16); GS and CIN: high TMEscore (n=25), low TMEscore (n=132); p<2.2×10⁻¹⁶, χ2 test; figure 3D). A similar trend was also observed in the ACRG cohort (EBV and MSI: high TMEscore (n=78), low TMEscore (n=8); other subtypes: high TMEscore (n=80), low TMEscore (n=134); p<2.2×10⁻¹⁶, χ2 test; Online supplemental figure S3B–D). Intriguingly, our analyses indicated that EBV infected tumors have comparable TMEscore with MSI-H tumors in the ACRG cohort (p=0.261; figure 3E) and even possessed a higher TMEscore than that of MSI-H tumors in TCGA cohort (p=2.9×10⁻⁵; figure 3F), whereas a significantly lower tumor mutation counts than that of MSI-H tumors in both TCGA-STAD and ACRG cohorts remained (p=5.9×10⁻¹³ and 6.9×10⁻⁶, respectively; figure 3G,H). We also noted a markedly lower neoantigen load in EBV infected tumors compared with MSI-H GC in TCGA cohort (p=2.7×10⁻¹⁰, figure 3I). Correlation analysis revealed that the TMEscore was positively associated with tumor mutation burden in both data sets (TCGA-STAD: p=4.4×10⁻¹⁶; figure 3J; ACRG: p=8.6×10⁻¹¹; online supplemental figure S3D) and predicted neoantigen load in TCGA-STAD cohort (p=2.5×10⁻¹¹; online supplemental figure S3E). Collectively, the EBV subtype remained at a low level of TMB and neoantigens with a high TMEscore and immune associated signatures in Pan-Caner cohorts (online supplemental figure S4A–G and online supplemental table S8). As shown by previous research48 49 about GC cohort treated with ICBs,5 patients with EBV infection, as well as the MSI-H phenotype, had an increased potential to benefit from ICB treatment. These observations further confirmed that TMB, as a widely used predictive biomarker,50 is incapable of identifying patients with GC with EBV subtype and tumor with virus infection (online supplemental figure 1 S5A-F), which also benefit from immunotherapy. As expected, the TMEscore could identify the EBV and MSI subtypes from all patients in TCGA-STAD and ACRG cohorts with significantly higher accuracy than TMB, GEPs,18 Pan-F-TBRs,6 and Immune checkpoint score33 (DeLong test, p=2.1×10⁻⁶, 8.8×10⁻¹⁰, 1.5×10⁻³², and 2.5×10⁻⁸, respectively; figure 3K and online supplemental table S7. Sufficiently, the aforementioned data confirmed that the TMEscore might perform better in selecting candidate patients with GC that can benefit from ICB immunotherapy.
ARID1A and PIK3CA deficiency potentiate therapeutic antitumor immunity in gastric cancer
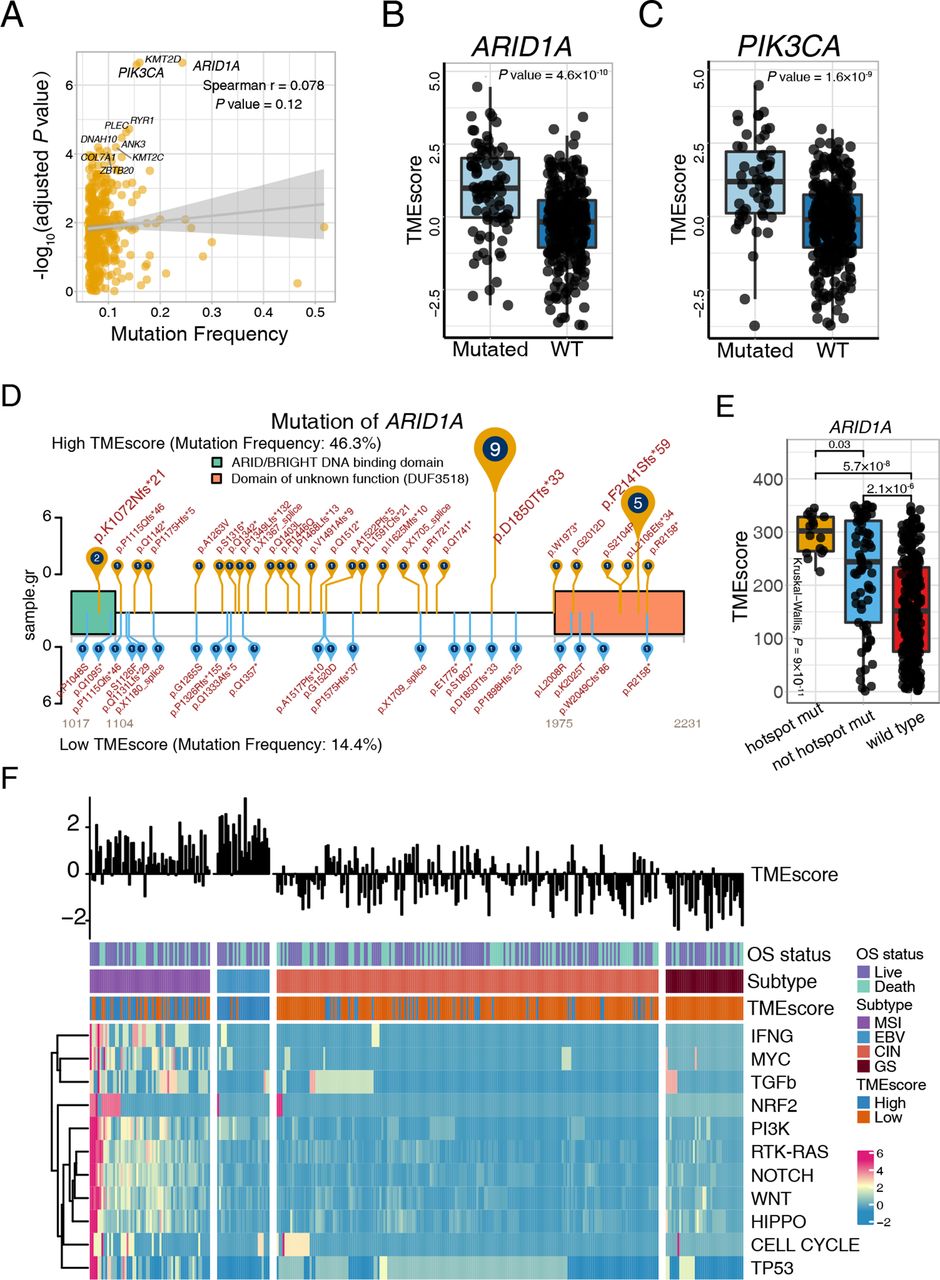
Somatic gene mutations can alter the vulnerability of cancer cells to T cells and T cell immunotherapies.44 51 52 We sought to uncover the immunogenomic determinants of therapeutic response and the tumor immune microenvironment activation of GC in two large patient cohorts (TCGA-STAD and ACRG). Mutations associated with TMEscore was identified utilizing Wilcoxon test and Fisher’s exact test (figure 4A and online supplemental table S9). Our analyses highlighted that mutation of ARID1A and PIK3CA (figure 4A), whether evaluated continuously (figure 4B,C) or binarily (online supplemental table S9), were markedly correlated with TMEscore levels in TCGA-STAD cohort, which were verified in the ACRG cohort (online supplemental figure S6A). Meanwhile, TMB was divided into high TMB group and low TMB group (cut-off=400, (online supplemental figure S6B) to analyze the relationship between TMEscore and ARID1A or PIK3CA mutations. As shown in online supplemental figure S6C,D, patients with ARID1A or PIK3CA mutations exhibited significantly higher TMEscore in the low TMB group. However, no significant trend was observed in the high TMB group. The above results suggested that in low TMB conditions, both ARID1A and PIK3CA mutations are associated with TME activation, while in high TMB conditions, the effect of ARID1A and PIK3CA mutations might be covered by the phenomenon that increasing neoantigens caused by abundant mutations further activating TME. PIK3CA is the most commonly mutated oncogene across all solid tumors.53 ARID1A deficiency, also a frequent mutation in various malignancies, has been reported to contribute to compromised mismatch repair (MMR), increased mutagenesis, and microsatellite instability genomic signature, and may cooperate with anti-PD-L1 therapy.54

ARID1A and PIK3CA mutation potentiate antitumor immunity. (A) Mutation frequency and corresponding levels of TMEscores are exhibited in the dotplot, and the significance of ARID1A, PIK3CA, and KMT2D mutations are highlighted. Every single spot represents a gene, and statistical significance was shown through y-axis (Spearman test, r=0.078, p=0.12). (B–C) ARID1A (B) and PIK3CA (C) mutations were significantly associated with an increase of TMEscore. ARID1A (Wilcoxon, p=4.8×10⁻¹⁰) and PIK3CA (Wilcoxon, p=1.6×10⁻⁹) mutations were categorized in a binary way. (D–E) The landscape of the ARID1A mutation positions and corresponding TMEscore was displayed and highlighted p.D18550Tfs*33 and p.F2141Sfs*59 of ARID1A mutation in the high-TMEscore tumors. The mutation rates of high (yellow) and low (blue) TMEscores are shown (D). The ARID1A recurrent mutation is correlated with the higher TMEscore (Kruskal-Wallis test, p=9×10⁻¹¹) (E). (F) The landscape of intrinsic pathway mutations (rows) is characterized for each sample (columns). Column annotations represent OS status (live, dead), molecular subtype (chromosomal instability (CIN), Epstein-Barr virus (EBV), genomic stable (GS) and microsatellite instability (MSI)); and tumor microenvironment (TME) subtype (high, low). The TMEscore is displayed in the top panel. Genomic mutations were limitedly enriched in the EBV molecular subtype, which exhibited a high TMEscore. Colors (blue to red) represent the corresponding expression levels (low to high). WT, wild type; OS, overall survival.
Notably, we investigated further into the specific mutation locations to identify recurrent mutations with top mutation frequencies in binary TMEscore settings to visualize results by trackViewer.55 Intriguingly, p.D18550Tfs*33 and p.F2141Sfs*59 of the ARID1A mutation were highlighted in high-TMEscore tumors (figure 4D) and statistically correlated with TMEscore levels (p=0.03; figure 4E, online supplemental table S10). Gastric cancer with PIK3CA p.E545K and p.H1047R mutations were prominently enriched in the high-TMEscore group (online supplemental figure S7A, online supplemental table S10). However, limited statistical difference was observed in the continuous TMEscore despite the significant discrepancy across mutated and wild type (p=2.7×10⁻⁸; online supplemental figure S7B). Additionally, the mutation rate of ARID1A and PIK3CA in TCGA-STAD cohort were also higher in EBV and MSI molecular subtypes, which was correlated with an elevated TMEscore and immunotherapeutic response as compared with CIN and GS subtypes (ARID1A: p<2.2×10⁻¹⁶; PIK3CA: p<2.2×10⁻¹⁶; χ2 test; online supplemental figure S7C,D). We further found that the ARID1A-inactivating mutation in low TMB group was correlated with an upregulated immune checkpoint, CD8+ T effector, antigen presentation process (online supplemental figure S8A), and cellular response to glutamate metabolism (online supplemental figure S8B), which collectively suggested the higher T-cell infiltration and potential benefit from the blockade of ICB. Two recent studies indicated that the mutation of signaling pathways could serve as an immunotherapy biomarker56 and suggested combination therapy opportunities.52 The current study demonstrated pathway mutations derived predominantly from MSI molecular subtype (figure 4F and online supplemental table S11) and significant mutation accumulations of almost all pathways in the high-TMEscore fraction (figure 4F and online supplemental table S11). Nevertheless, in accordance with prior results (online supplemental figure S7D), a higher PI3K pathway mutation frequency was also observed in the EBV subtype in comparison with the GS and CIN subtypes, suggesting a latent interplay between EBV infections and the PI3K signaling pathway (online supplemental figure S9A and online supplemental table S11), which may partially explain the predominant increase of the TMEscore in EBV-infected patients (figure 3F and online supplemental figure S9B). Previous studies indicated that the interaction of PIK3CA mutation and EBV protein products may activate PI3K/ATK pathway which might be an initiator in tumorigenesis and progression. PIK3CA mutation revealed high intratumoral heterogeneity characterized with three to five different PIK3CA genotypes (including wildtype) in EBV-positive gastric cancer.57 Additionally, analyzing mutation signatures in the Catalog Of Somatic Mutations In Cancer34 indicated an intimate correlation between the TMEscore and mismatch repair associated signature 6 (online supplemental figure S9C and online supplemental table S12). Collectively, large data analyses of gastric TME elucidated the estimation of ARID1A and PIK3CA mutation status as a potential biomarker for immunotherapy strategies of GC.
TME-associated metabolic characteristics
Given the intriguing metabolic regulations observed in the different ARID1A-mutant statuses, we further explored transcriptomic profiles and dissected the latent intrinsic mechanism contributing to the crucial predictive capacity of the TMEscore. Metabolic signatures were estimated by PCA methodology6 and comprehensively investigated in TCGA-STAD cohort. Correlation analysis highlighted that kynurenine metabolism, purine metabolism and cysteine metabolism were activated in the high-TMEscore subset, while glycogen metabolism, transsulfuration, and glycine serine metabolism were significantly upregulated in low TMEscore group (figure 5A,B). Statistical analysis suggested that kynurenine metabolism was closely correlated with a high TMEscore (p=2.0×10−53, r=0.702; figure 5C and online supplemental table S13) and immunotherapy-favorable molecular subtypes including EBV and MSI-H (Kruskal-Wallis, p=3.3×10⁻¹⁰; figure 5C). The downregulated kynurenine metabolism was also observed to suggest T cell exclusion, which may indicate insensitivity to ICB therapy (figure 5E). Kynurenine metabolism processes may be a promising target to restore tumor-restraining T-cell immunogenicity and therefore promote ICB therapeutic efficacy in gastric cancer, such as IDO1 inhibitor.58 We observed that glycogen metabolism was significantly activated in low TMEscore tumors and immune exclusive molecular subtypes both in TCGA-STAD cohort and ACRG cohort (figure 5D and online supplemental figure S10A–F), which suggest that it may be correlated with immune exclusion phenotype (figure 5E and online supplemental figure S10G,H) and mediate treatment resistance of immunotherapy. Consistently, Curtis et al indicated that the interaction between cancer cells and CAFs supported glycogenolysis which funneled into glycolysis, leading to increased proliferation, immune evasion, and metastasis of cancer cells.59 Together, we identified a collection of metabolism characteristics and biological processes associated with TME, which reflects the intricacy of the TME and indicates potential combination therapy opportunities.

Tumor microenvironment (TME) associated metabolism and methylation characteristics. (A) Wilcoxon test show the differentially express metabolism pathway in high and low TMEscore tumor. For each patient (columns), signaling pathways (rows) are characterized in the heatmap. Colors (blue to red) represent the corresponding expression levels (low to high). Column annotations high (orange) and low (green) TMEscore. (B) Correlation analysis highlighted the most significant metabolism pathways in the high and low TMEscore tumors. Annotations of the pathways are listed on the left. Colors (yellow to green) represent p values, and the size of each dot represents the spearman coefficient. (C) A scatter plot demonstrated a close correlation between the TMEscore and kynurenine metabolism. Every single dot represents one sample, and corresponding molecular subtypes are identified in different colors (chromosomal instability (CIN): yellow, Epstein-Barr virus (EBV): blue, genomically stable (GS): red, microsatellite instability (MSI): pink; Spearman test, r=0.702, p=2.0×10−53). Kynurenine metabolism was significantly activated in EBV and MSI subtype (Kruskal-Wallis test, p=3.3×10⁻¹⁰). (D) A scatter plot demonstrated a close correlation between the TMEscore and glycogen metabolism. Every single dot represents one sample, and corresponding molecular subtypes are identified in different colors (CIN: yellow, EBV: blue, GS: red, MSI: pink; Spearman test, r=−0.675, p=3.6×10−48). Glycogen metabolism was significantly activated in GS subtype (Kruskal-Wallis test, p<2.2×10⁻¹⁶). (E) A corrplot displays correlations among kynurenine metabolism, glycogen metabolism and TME-related signatures. Coefficients are characterized in number. Colors red and purple represent positive and negative correlations. (F) The heatmap exhibited the landscape of differentially methylated genes in high and low TMEscore tumors. For each patient (columns), significant methylated regions of specific genes (rows, annotated on the right) are characterized. The column annotations represent high (red) and low (blue) TMEscore. Colors (yellow to purple) represent the corresponding methylation levels (low to high). (G) Correlation analysis highlighted the top 20 methylated probes and genes in the high and low TMEscore tumors. Annotations of the probes and genes are listed on the left. Colors (green to purple) represent p values, and the size of each dot represents the spearman coefficient. (H) The discrepancy of VAMP8 methylation in different regions in high (blue) and low (yellow) TMEscore. Annotations of probes (cg23752985, cg05486094, cg04877910, cg12542933, cg05656364, cg20056908), features (3′UTR, 5′UTR, TSS1500, TSS200), and CpG islands (CGI) (opensea, shelf) are exhibited on the bottom panel. (I) The discrepancy of ATG7 methylation in different regions in high (blue) and low (yellow) TMEscore. Pan-F-TBRs, pan-fibroblast TGF-β response signature.
Methylation regions correlate with immune activity
A prior study60 demonstrated that a high m6Ascore indicates an immune-exclusion TME phenotype, stromal activation, decreased survival, decreased neoantigen load, and inferior response in GC. Thereafter, we attempted to identify the epigenetic immunomodulation involved in the antitumor immunity and tumor immune editing, which may be fundamental for understanding the inflammatory reaction that occurs in the diseases. Notably, a comprehensive investigation into the DNA methylation position landscape suggested demethylation of the VAMP8, was enriched in the low-TMEscore cluster, with the demethylation of the ATG7 in the high-TMEscore cluster (figure 5F–I and online supplemental table S14). Intriguingly, further exploration of corresponding methylation regions revealed that cg04877910, cg12542933, cg05656364, cg05486094 and cg20056908 of VAMP8 methylation were consistently negatively associated with high TMEscore and MSI and EBV molecular subtypes, whereas cg23752985 of VAMP8 methylation harbored a relatively diverse distribution in molecular subtypes and correlations with the TMEscore (online supplemental figure S11A,B). Enrichment of differentially methylated genes highlighted the vital role VAMP8 methylation plays in the TME regulatory network via upregulating immune pathways, comprizing pathways of leukocyte activation regulation, protein location to the membrane, antigen processing and presentation, coated vesicle, and recycling endosome (online supplemental figure S11C), which indicated the crucial role VAMP8 plays in the complex gene interactions and crosstalk in extensive signaling pathways. Additionally, the demethylation of ATG7, as a gene marker of autophagy, is significantly correlated TMEscore (online supplemental figure S11D). Further analyses of the relationship among discovered ATG7-associated signatures (positive regulation of autophagy) indicated that demethylation of the ATG7 was contributed to the immune exclusion in TME, with elevated TMEscoreB and fibroblast infiltration in TCGA-STAD and ACRG cohort (online supplemental figure S11E,F). Collectively, DNA methylation, such as different methylation regions of VAMP8 and ATG7, may offer a lens into the complexity and diversity of the TME and immune-activity determination, thereafter might assist in optimizing immunotherapy strategies.
Discussion
Our studies leveraging multi-omics data highlight TME evaluation (TMEscore) as a predictor of tumor immunogenicity and objective response rates and overall survival in six independent cohorts treated with ICBs. Moreover, the synergic therapy of ICB with chemotherapy or angiogenesis inhibitor is encountering the dilemmas of lacking functional molecular biomarkers. Notably, based on a multicenter clinical gastric cancer cohort, we discovered TMEscore is robust in predicting treatment efficacy in the context of checkpoint immunotherapy alone or its combination with chemotherapy or angiogenesis inhibitor, where the predictive accuracy of immune activation relevant signatures markedly shrinks.
Given the promising predictive value of TMEscore, we systematically investigated TMEscore pertinent underlying mechanisms to reinforce our refined understanding of the interplay between tumor-intrinsic features and TME and offer novel precise methodologies to accelerate precision immunotherapy. Selection strategies of optimal biomarkers remain controversial due to complicated clinical applications.9 10 For example, though PD-L1 expression level indicated therapeutic benefit, patients with PD-L1 <1% also responded to ICBs.1 In current study, the TMEscore substantially outperformed the counterparts including PD-L1 abundance, TMB, and MSI-H in discriminating response to ICBs.9 10 Merits of TMEscore is mainly attributed to the accurate identification of immune microenvironment activation, especially high CD8+ T cell infiltration tumors, immune exclusion and EBV infection status. Notably, EBV infection commonly accompanies with a low TMB, but is a unique marker with a high potential for response to ICB in GC,5 48 which was consistently confirmed by Subudhi et al in the setting of prostate cancer.61
Although TMB is a wide-recommended biomarker, specific alterations usually initiate carcinogenesis and neo-antigens generation but their roles in immune therapy sensitivity remain obscure. We identified mutations of ARID1A and PIK3CA associated with immune activation facilitating checkpoint immunotherapy. ARID1A is a component of the SWI/SNF chromatin remodeling complex,62 frequently mutated in GC.11 12 ARID1A deficiency closely correlates with the ICB response,54 potentially attributing to impairing MMR and elevating PD-L1 expression. Our study unprecedently proposed that ARID1A deficiency reformed the TME, with two specific ARID1A mutation locations of p.D18550Tfs*33 and p.F2141Sfs*59 harboring markedly higher TMEscore. Current work also indicated a potential interaction between ARID1A48 and PIK3CA11 mutations and EBV infection, partially explaining the elevated TMEscore in EBV subtype.
Metabolically speaking, we discovered that activation of kynurenine metabolism was correlated with EBV infection and MSI-H status subsequently upregulate immune suppressive markers, such as PD-L1 and IDO. Consistently, a recent report indicated the mechanistic link between kynurenine metabolism and the immunosuppressive microenvironment.63 64 Therefore, the inhibition of kynurenine metabolism may be a potential target for combinational therapy to improve the efficacy of ICB.58
DNA methylation guided the epigenetic regulation of genes, which was not limited in cancer cells but also immune cells and stromal cells, thereafter hypomethylation of specific genes could modify TME components and their interactions.65 Xiao et al have emphasized the contribution of the specific gene SOCS1 methylation of CAFs made in reprogramming the TME induced by PDAC cells.66 Similarly, our analysis of DNA methylation landscape highlighted another gene methylation, VAMP8, correlated with the TME and immune-activity-related pathways. Additionally, extensive exploration of different methylation regions of VAMP8 exhibited an inverse trend in different TMEscore groups, thereby offering a novel understanding of complex interplay linking methylation with TME. Macroautophagy is an essential cellular catabolic process required for survival under conditions of starvation. Recent study indicated that loss of ATG7 in cancer cells which mediates autophagy disruption can enhance antitumor immune responses.67 Our data suggest that ATG7 demethylation was closely associated with immune exclusion and CAF infiltration, which may provide insights into possible mechanisms.
Despite the TMEscore presenting high sensitivity in predicting immunotherapy efficacy, its application may be limited across diverse cancer types.15 Tumor heterogeneity and tissue specificity are presumed to be the main reasons and could also be interpreted by the various immune microenvironments. We are collecting a large number of gastric cancer samples before immunotherapy to determine an appropriate TMEscore cut-off value for consequent clinical practice. To develop TMEscore into a clinical-grade immunotherapy biomarker, we are devoted to carrying out two clinical trial of gastric cancer treated with ICBs (NCT04850716, NCT04850729).
Conclusions
Collectively, we optimized a TME evaluation tool that may serve as a robust biomarker and integrated it as an open-source R package for further application in clinical implementation. The predictive capacity of TMEscore was verified in two advanced gastric cancer cohorts, which highlighted the predictive efficacy of tumor microenvironment evaluation. The intrinsic features involving the ARID1A and PIK3CA mutations, kynurenine metabolism, glycogen metabolism, ATG7 and VAMP8 methylation provide new insight into the potential mechanisms of TMEscore-guided precision immunotherapies.
Data availability statement
Data are available in a public, open access repository. Data are available upon reasonable request. Data may be obtained from a third party and are not publicly available. The raw sequencing data have been deposited at the European Nucleotide Archive and are available under accession number RJEB25780. The analytic code and package used to estimate the TMEscore and prevalent signature are provided for non-commercial use at GitHub:https://github.com/DongqiangZeng0808/TMEscore and https://github.com/IOBR/IOBR. A detailed README file is also available, complete with examples of how to use the package.
Ethics statements
Ethics approval
Patients’ samples were collected and analyzed after informed consents were obtained and approved by the Human Ethics Committee (SYSEC-KY-KS-2019-171) of Sun Yat-sen Memorial Hospital, Sun Yat-sen University. Written informed consent was obtained from individual or guardian participants.
Acknowledgments
We would like to extend sincere gratitude to Professor Lee (Jeeyun Lee, Division of Hematology-Oncology, Department of Medicine, Samsung Medical Center, Sungkyunkwan University School of Medicine, Seoul, Korea) for the constructive comments and data acquisition to improve the paper. We would like to thank Professor Zhou (Youlang Zhou, Research Center of Clinical Medicine, Affiliated Hospital of Nantong University, Nantong, 226001, Jiangsu Province, China) for providing the m6A score of TCGA-STAD and ACRG cohorts.
Supplementary materials
Supplementary Data
This web only file has been produced by the BMJ Publishing Group from an electronic file supplied by the author(s) and has not been edited for content.
Footnotes
Twitter @ZDQ_Interlaken
DZ, Jiani Wu, HL, YL, JX and JP contributed equally.
Contributors DZ, K-MK and WL had full access to all the data in the study and take responsibility for the integrity of data and the accuracy of the data analysis. Study concept and design: DZ, WL, K-MK; Acquisition of data: HL, JP, JX, YLi, Jianhua Wu, ZY, Jiani Wu, GW; Analysis and interpretation of data: DZ, Jianhua Wu, ZY, LS, YX; Drafting of the manuscript: DZ, ZY, Jiani Wu; Critical revision of the manuscript for important intellectual content: K-MK, WL, NL, YLia, JB, MS, YY; Statistical analysis: DZ, ZY, WQ; Obtaining funding: K-MK; Administrative, technical, or material support: DZ, HS; Supervision: K-MK, WL.
Funding This study was supported by a grant from the Korean Health Technology R&D Project, Ministry of Health & Welfare, Republic of Korea (HI16C1990)
Competing interests None declared.
Provenance and peer review Not commissioned; externally peer reviewed.
Supplemental material This content has been supplied by the author(s). It has not been vetted by BMJ Publishing Group Limited (BMJ) and may not have been peer-reviewed. Any opinions or recommendations discussed are solely those of the author(s) and are not endorsed by BMJ. BMJ disclaims all liability and responsibility arising from any reliance placed on the content. Where the content includes any translated material, BMJ does not warrant the accuracy and reliability of the translations (including but not limited to local regulations, clinical guidelines, terminology, drug names and drug dosages), and is not responsible for any error and/or omissions arising from translation and adaptation or otherwise.