Article Text

Abstract
Background Clear cell renal cell carcinoma (ccRCC) displays heterogeneity in appearance—a distinctive pale clear to eosinophilic cytoplasm; however, little is known about the underlying mechanisms and clinical implications. We investigated the role of these eosinophilic features in ccRCC on oncological outcomes and response to tyrosine kinase inhibitors (TKIs) and immune checkpoint inhibitors (ICIs).
Methods One-hundred and thirty-eight ccRCC cases undergoing radical surgery (cohort 1) and 54 metastatic ccRCC cases receiving either TKIs or ICIs (cohort 2) were included. After histological evaluation, all cases were divided into three phenotypes based on the eosinophilic features at the highest-grade area: clear, mixed, or eosinophilic type. Gene expression and immunohistochemical analyses were performed to explore the potential mechanisms of these phenotypes in cohort 1. Further, the association of the three phenotypes with the best objective response to TKI or ICI, clinical benefit (complete/partial response or stable disease), and overall survival (OS) was assessed in cohort 2.
Results The clear type was significantly associated with increased hypoxia as well as angiogenesis gene signatures compared with the eosinophilic type. Gene signatures and protein expression related to effector T cell and immune checkpoint molecules were elevated to a greater extent in the eosinophilic type, followed by the mixed and clear types. The mixed and eosinophilic types exhibited greater PBRM1-negativity and increased prevalence of the epithelial-mesenchymal transition gene signature than the clear type. In the mixed/eosinophilic types of cohort 2, significant clinical benefit was observed in the ICI therapy group versus the TKI therapy group (p=0.035), and TKI therapy vs ICI therapy was an independent factor for worse prognosis of OS (HR 3.236; p=0.012).
Conclusion The histological phenotype based on the eosinophilic features, which are linked to major immunological mechanisms of ccRCC, was significantly correlated with therapeutic efficacy.
- immunohistochemistry
- immunotherapy
- kidney neoplasms
- biomarkers
- tumor
- neovasularization
- pathologic
Data availability statement
No data are available.
This is an open access article distributed in accordance with the Creative Commons Attribution Non Commercial (CC BY-NC 4.0) license, which permits others to distribute, remix, adapt, build upon this work non-commercially, and license their derivative works on different terms, provided the original work is properly cited, appropriate credit is given, any changes made indicated, and the use is non-commercial. See http://creativecommons.org/licenses/by-nc/4.0/.
Statistics from Altmetric.com
Introduction
Clear cell renal cell carcinoma (ccRCC) frequently displays heterogeneous histological features such as glycogen-enriched cytoplasm, eosinophilic cytoplasm, fine vascular network, and enlarged thick vascular structure.1 Owing to the von Hippel-Lindau tumor suppressor gene (VHL) mutation resulting in constitutive hypoxia-inducible factor (HIF) activation, ccRCC cells display a pseudo-hypoxic phenotype, activating the vascular endothelial growth factor (VEGF) and leading to a distinctive appearance.2 A recent report has demonstrated that eosinophilic features (ie, areas with granular, eosinophilic cytoplasm) were less vascularized but harbored abundant infiltration immune cells (ICs) as compared with clear cell areas.3 However, the correlation of eosinophilic ccRCCs with the underlying mechanisms, or responsiveness to systemic therapy involving immune checkpoint blockades, has not been fully investigated.3
Currently, there are many standard strategies with systemic agents for metastatic ccRCC such as tyrosine kinase inhibitors (TKIs), single or double immune checkpoint inhibitor(s) (ICIs), or a combination of TKIs plus ICIs.4 According to guidelines, these agents are recommended based on the International Metastatic RCC Database Consortium (IMDC) risk criteria, which were developed in the TKI era.4 However, to optimize the sequence of current, chaotic regimens, more specific molecular/histology-based biomarkers are required to facilitate the decision-making process. For instance, mutation in a chromatin remodeling gene, polybromo-1 (PBRM1), has been reported to be a predictive biomarker for ICI response.5 6 Moreover, sarcomatoid/rhabdoid features in ccRCC, which are related to epithelial-to-mesenchymal transition (EMT), have also been reported to be a potential surrogate for ICI response.7–9
Nevertheless, there are only a few reliable histological markers that can help guide the optimal treatment for patients with metastatic ccRCC.7–9 In the present study, we focused on the eosinophilic features in ccRCC to determine whether these could be associated with response to TKIs or ICIs. The association of possible mechanisms with eosinophilic components was examined, and patient outcomes to TKI or ICI therapy were evaluated according to the histological phenotypes (online supplemental figure S1).
Supplemental material

Clinicopathological features and histological phenotypes in ccRCC undergoing radical surgery. (A) Cytoplasmic patterns of histological phenotype at the highest-grade area defining the clear type (tumor cells with clear, pale cytoplasm), mixed type (some tumor cells are clear, and some are eosinophilic), and eosinophilic type (tumor cells with eosinophilic cytoplasm). (B) Percentage of the cases of each phenotype classified by pathological factors; χ² test was used for statistics. (C,D) Kaplan–Meier curves of relapse-free survival and CSS stratified by histological phenotypes; a Cox proportional hazards model adjusting for age and sex was used for statistics. ccRCC, clear cell renal cell carcinoma; CSS, cancer-specific survival; RFS, relapse-free survival.
Materials and methods
Participants
The present study was approved by the institutional review board at Kansai Medical University (No. 2018109). We included 138 cases with ccRCC undergoing radical surgery (cohort 1) and 54 cases with metastatic ccRCC (cohort 2) in this study, cohort 1 underwent radical or partial nephrectomy between 2006 and 2017, and their formalin-fixed, paraffin-embedded (FFPE) tissues were available for gene expression analysis and immunohistochemistry (IHC). Cohort 2 underwent biopsy, metastasectomy, or cytoreductive surgery before the initiation of systemic therapy between 2009 and 2019. This cohort included two treatment groups: the TKI therapy group (patients treated with TKI(s) only, that is, sunitinib, pazopanib, sorafenib, or axitinib), and the ICI therapy group (patients treated with a first-line ICI or previous TKI(s) followed by ICI). ICI treatment included a monotherapy with nivolumab 240 mg/body intravenously or a combination of nivolumab 240 mg/body intravenously plus ipilimumab 1 mg/kg intravenously every 3 weeks for four doses, followed by nivolumab 240 mg intravenously every 2 weeks.
Histological evaluation
For all cohorts, H&E-stained slides of whole tissue sections were re-evaluated by a urological pathologist (CO), who was blinded to the clinical outcomes, and all tumors were histologically diagnosed as ccRCC—containing the typical area of carcinoma with a small and thin-walled vascular network. Histological features, including the WHO/International Society of Urological Pathology (WHO/ISUP) grade, sarcomatoid/rhabdoid features, necrosis and pathological stage (2018 TNM classification), and the histological phenotypes, such as clear (tumor cells with clear or pale cytoplasm), mixed (some tumor cells are clear, and some have eosinophilic cytoplasm), or eosinophilic type (tumor cells with eosinophilic cytoplasm), were evaluated at the area of the highest tumor grade (online supplemental figure S2).10–12 For interobserver variability assessment, a total of 80 H&E slides randomly selected from the two cohorts (40 cases each) were independently reviewed by another pathologist (JI) with respect to WHO/ISUP grade and histological phenotype.
RNA expression profiling
Tumor-rich areas, corresponding to the region of interest for histological phenotyping, were selected from FFPE tissue blocks, and 95 tissue samples were obtained from cohort 1 by macrodissection procedure. The mRNA was isolated using ReliaPrep FFPE Total RNA Miniprep System (Promega, Madison, Wisconsin, USA). The IMmotion 150 gene signature13 consisting of genes related to angiogenesis, immune and antigen presentation, and myeloid inflammation, and the ClearCode34 gene signature14 consisting of genes related to hypoxia, cell cycle, glucose metabolism, and EMT were quantified. The mRNA expression analysis was performed using the NanoString nCounter system and analyzed with nSolver Analysis Software (NanoString Technologies, Seattle, Washington, USA), as previously reported.15
Gene expression signatures were defined according to previous reports; angiogenesis (angio):13 VEGFA, KDR, ESM1, PECAM1, ANGPTL4, and CD34; T-effector (Teff):13 16 CD8A, CXCL9, PRF1, IFNG, and CD274; myeloid inflammation:13 IL-6, CXCL1, CXCL2, CXCL3, CXCL8, and PTGS2; EMT:17–19 VIM, CDH2, and FOXM1. Each gene signature score was calculated as follows: the z scores of signature genes were normalized across all patients and then averaged to create a single signature score for each patient.20
Immunohistochemical analysis
For IHC, tissue microarrays were constructed from FFPE tissue block(s) that had been selected from the most representative location described above in cohort 1. IHC staining was performed using a VentanaDiscovery Ultra autostainer (Roche Diagnostics K.K, Tokyo, Japan) and Leica Bond-III (Leica Biosystems, Melbourne, Australia). Antibody sources, dilutions, and detection are presented in online supplemental table S1. Protein expression levels determined via IHC were semi-quantified using the H-score (scored from 0 for ‘no signal’ to 3 for ‘strong signal’).21 Additionally, we evaluated the density of CD8+ tumor-infiltrating lymphocytes (TILs) (calculated as the number of cells/mm2 of the location corresponding to a region of interest for histological phenotyping)22 and the microvessel area (MVA; calculated as CD31 area/area of a region of interest for histological phenotyping).23 ImageJ software was used for an automated imaging analyzer.24 The programmed death ligand 1 (PD-L1) expression on tumor-infiltrating ICs, which included macrophages, dendritic cells, and lymphocytes, was scored by considering the PD-L1+area of tumor-infiltrating ICs according to previously reported criteria: IC0 (<1%), IC1 (≥1%,<5%), IC2 (≥5%,<10%), or IC3 (≥10%).25 The PD-L1 expression on tumor cells (TCs) was scored based on the H-score: TC0 (H-score 0), TC1 (H-score 1), TC2 (H-score 2), or TC3 (H-score 3)21
Clinical outcomes
For cohort 1, relapse-free survival (RFS) was defined as the time from the surgery to relapse on imaging, and cancer-specific survival (CSS) was defined as the time from surgery to ccRCC-caused death. In cohort 2, the primary endpoint was overall survival (OS), defined as the time from the TKI or ICI initiation to death. The secondary endpoints included the maximum tumor shrinkage, the best objective response and progression-free survival (PFS) during each systemic therapy (ie, TKI(s) for TKI therapy group or ICI for ICI therapy group) according to the Response Evaluation Criteria in Solid Tumors (RECIST) V.1.1.
Statistical analysis
To evaluate the statistical significance among two or more groups, the χ² test for categorical variables, one-way analysis of variance for parametric variables, and Mann-Whitney U-test or Kruskal-Wallis test for non-parametric variables were used. Interobserver agreement was statistically assessed using kappa statistics. Correlations between the two variables were evaluated using Spearman’s rank correlation test. RFS and CSS for cohort 1 and OS and PFS for cohort 2 were assessed using the Kaplan-Meier method with the log-rank test and the Cox proportional hazards model. For multiple comparisons, the Holm-Bonferroni method was used. Multivariate analyses were performed using a backward stepwise Cox proportional hazards model for OS. All statistical analyses were performed using EZR V.1.54 (Saitama Medical Center, Jichi, Japan). A two-sided p<0.05 was considered statistically significant.
Results
Clinicopathological characteristics in ccRCC undergoing radical surgery
The clinicopathological features of 138 patients (cohort 1) are presented in table 1. Regarding histological phenotypes, 56 (40.6%) patients with the clear type, 65 (47.1%) with the mixed type, and 17 (12.3%) with the eosinophilic type were observed. Representative images of the histological phenotypes are shown in figure 1A. The worse tumor stage, tumor grade, necrosis, and sarcomatoid/rhabdoid features were significantly enriched in the eosinophilic type, followed by the mixed type (figure 1B). These trends were validated in 95 tissue samples for gene expression analysis (online supplemental figure S3). Interobserver agreement between the two pathologists was substantially greater for histological subtyping than for WHO/ISUP grading (kappa statistics=0.80 vs 0.76, respectively).
Clinicopathological characteristics of 138 ccRCC cases undergoing radical surgery (cohort 1)
Survival analysis showed a 5-year RFS rate of 72.3% (HR 2.95; 95% CI 1.16 to 7.50; p=0.023) for the mixed type and 43.1% (HR 8.42; 95% CI 3.07 to 23.1; p<0.001) for the eosinophilic type vs 96.0% for the clear type (figure 1C). Five-year CSS rates were 91.4% (HR 3.25; 95% CI 0.67 to 15.6; p=0.142) for the mixed type and 82.0% (HR 7.52; 95% CI 1.35 to 41.8; p=0.021) for the eosinophilic type vs 98.1% for the clear type (figure 1D).
Gene expression and IHC analyses assessing the underlying mechanisms of histological phenotypes
Hierarchical clustering was performed using the IMmotion gene signature13 (figure 2A) and the 34-gene signature sets14 (online supplemental figure S4), identifying the angio/immune-related clusters (cluster1: Angioup, Teffdown, n=42; and cluster 2: Angiodown, Teffup, n=53; online supplemental figure S5) and the ccA/ccB subtypes (ccA: n=41 and ccB: n=54), respectively (online supplemental table S2). The eosinophilic type and sarcomatoid/rhabdoid features were significantly enriched in cluster 2 (p=0.001 and p=0.005, respectively; online supplemental table S2).

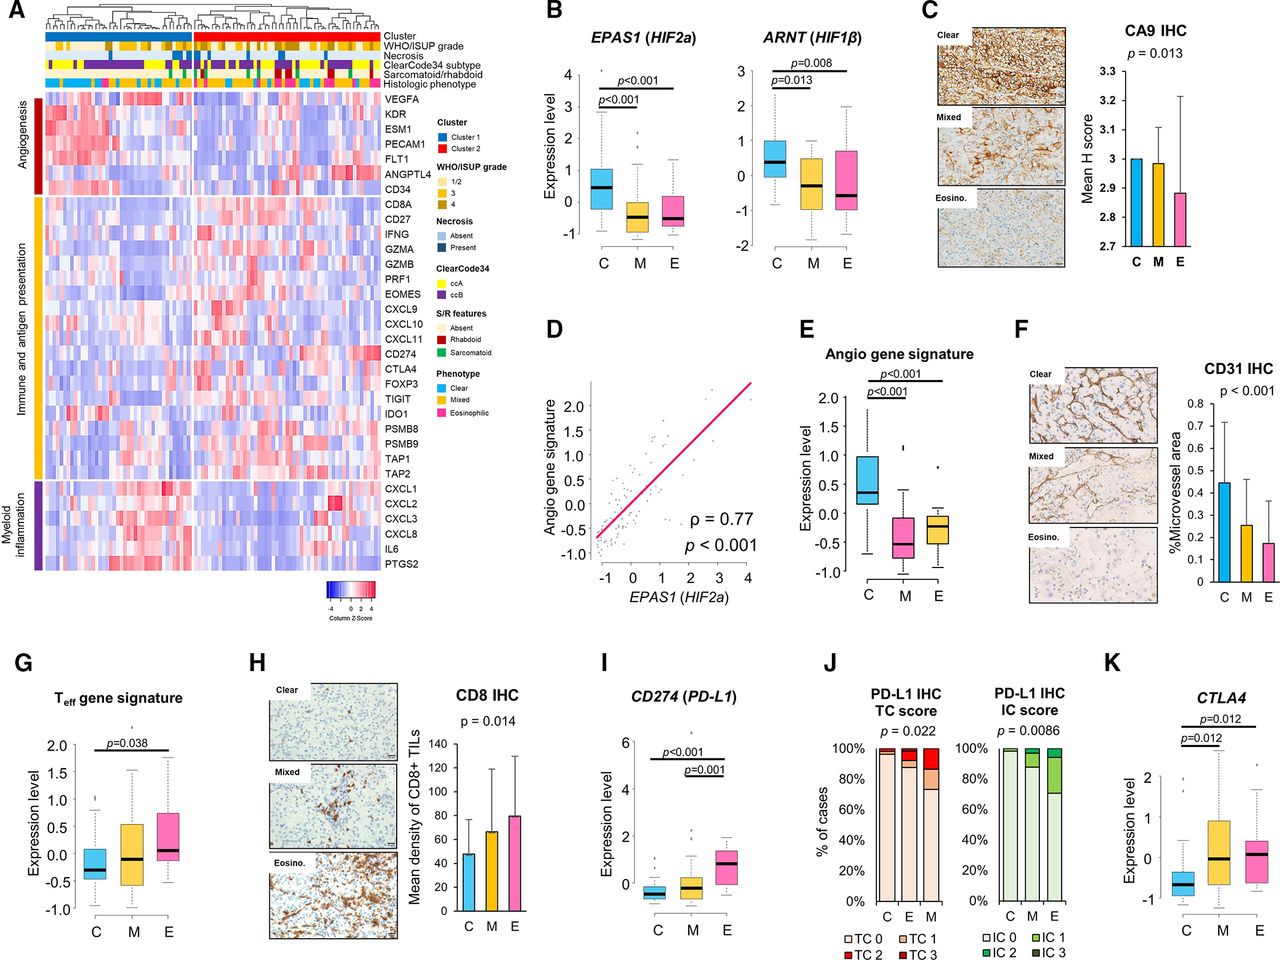
mRNA and protein expression analyses for the histological subtypes. (A) Hierarchical cluster analysis using the IMmotion 150 gene signature. The color bar on the top of the heatmap represents, from top to bottom, the cluster, WHO/ISUP grade, necrosis, ClearCode34 molecular subtype, sarcomatoid/rhabdoid features, and histological phenotype. Comparison of gene and protein expression (mean Z-score, H-score, density score, or % microvessel area) between histological phenotypes; (B,C) Hypoxia-related genes and protein, CA9 IHC. (D) Correlation between angio gene signature score and HIF2a expression; the Spearman’s rank correlation test was used for statistical analysis. (E,F) Angio gene signature score and CD31 IHC. (G,H) Teff gene signature score and CD8+ TILs IHC. (I,J) CD274 (PD-L1) expression, PD-L1 IHC tumor cell (TC) score, and tumor-infiltrating IC scores. (K) CTLA-4 expression. Data are presented as mean±SD or median (range). One-way analysis of variance with Tukey test or Kruskal-Wallis test with Holm’s method was used. angio, angiogenesis; ARNT, aryl hydrocarbon receptor nuclear translocator; C, clear type; CA9, carbonic anhydrase IX; CD274, cluster of differentiation 274; CD31, cluster of differentiation 31; CD8, cluster of differentiation 8; CTLA-4, cytotoxic T-lymphocyte associated antigen-4; E, eosinophilic type; EPAS1, endothelial PAS domain-containing protein 1; HIF1β, hypoxia-inducible factor 1-beta; HIF2α, hypoxia-inducible factor 2-alpha; IC, immune cell; IHC, immunohistochemistry; ISUP, International Society of Urological Pathology; M, mixed type; PDL-1, programmed death-ligand 1; Teff, T-effector; TIL, tumor-infiltrating lymphocyte.

Clinical outcomes and histological phenotypes in metastatic ccRCC (cohort 2). (A) Percentage of cases of each phenotype based on pathological factors; χ² test was used for statistics. (B,C) Kaplan-Meier curve of OS stratified by histological phenotypes, and concordance indices of the IMDC risk classification and histological phenotyping. The log-rank test was used for statistics. (C) Maximum change from baseline in tumor burden after systemic therapy initiation in cohort 2. (D) Percentage of cases with the best objective response to the tyrosine-kinase inhibitor or immune checkpoint inhibitor. Clinical benefit indicates CR, PR, or SD. The χ² test was used for statistical analysis. (E,F) Kaplan-Meier curves of OS stratified by the therapeutic group combined with histological phenotypes; for example, TKI-C, ICI-M, and TKI-M/E. The log-rank test with Holm’s method was used for statistics. CR, complete response; IMDC, International Metastatic RCC Database Consortium; OS, overall survival; PD, progression disease; PR, partial response; SD, stable disease; TKI-C, clear type treated with TKI, ICI-M, mixed type treated with ICI; TKI-M/E, mixed and eosinophilic types treated with TKI.
We analyzed the association between possible angio/immune genes and histological phenotypes. Among the hypoxia-related genes, endothelial PAS domain-containing protein 1 (EPAS1) or hypoxia-inducible factor-2 alpha (HIF2α), and aryl hydrocarbon receptor nuclear translocator (ARNT) or hypoxia-inducible factor 1-beta (HIF1β), which forms a heterodimer with HIF2α,2 were significantly upregulated in the clear type compared with the mixed and eosinophilic types (all, p<0.01; figure 2B). The expression of carbonic anhydrase 9 (CA9), which is activated by HIF accumulation driven by hypoxia and inactivation of the VHL,26 was significantly lower in the eosinophilic type than the mixed or clear types (both p<0.05; figure 2C).
Next, we investigated hypoxia-induced angiogenesis. The expression of HIF2a was substantially correlated with the angio gene signature score (figure 2D). The angio gene signature score was significantly higher in the clear type than the mixed or eosinophilic types (both p<0.001; figure 2E). The % MVA on staining with the vascular endothelial cell marker CD31 showed a significant decrease in the mixed type, followed by the eosinophilic and the clear types (p<0.001; figure 2F).
The Teff gene signature score was significantly higher in the eosinophilic type versus the clear type (p=0.038; figure 2G). Similarly, CD8+TILs were largely seen in the eosinophilic type followed by the mixed type (p=0.014; figure 2H). There was no difference in the expression levels of the myeloid gene signature among the phenotypes (online supplemental figure S6A). We then evaluated the association between immune checkpoint molecules and histological phenotypes. Upregulation of CD274 or PD-L1 was observed, especially in the eosinophilic type (all, p≤0.001; figure 2I). IHC analysis revealed that although PD-L1 negativity was commonly observed in both ICs and TCs, tumors displaying higher levels of PD-L1 expression, such as TC3 or IC2/3, were enriched with the eosinophilic phenotype followed by the mixed type (TC: p=0.022; and IC: p=0.0086; figure 2J and online supplemental figure S6B). Furthermore, the gene encoding cytotoxic T-lymphocyte-associated protein 4 (CTLA-4) showed a significant upregulation in the mixed and eosinophilic types compared with the clear type (all p=0.012; figure 2K).
Association between histological phenotypes and other potential target markers for immunotherapy
Because of the pivotal role of EMT in immune escape and the elevation of multiple immune checkpoint molecules in several cancers,27 28 we investigated the correlation between EMT and the inflammatory tumor microenvironment in ccRCC. The Teff gene signature score (p=0.002, figure 3A) and expression level of CD274 (p<0.001, figure 3B) showed positive correlations with the EMT signature score but not with CTLA4 expression. Histologically, tumors with sarcomatoid/rhabdoid features had higher EMT gene signature scores than those without such features (p=0.0047; figure 3C), which is consistent with the findings of a previous study.7 The eosinophilic type had the highest EMT gene signature score among all histological phenotypes (all, p<0.01; figure 3D). Forkhead box M1 (FOXM1), which is a key molecule in the EMT gene signature in RCC,19 showed higher expression in the eosinophilic type, followed by the mixed type and then the clear type (p=0.016; figure 3E).

Potential markers of response to immune checkpoint blockade. Correlation between EMT gene signature and immune-related factors; (A) EMT and Teff gene signature scores; (B) EMT gene signature score and expression levels of CD274 (PD-L1) or CTLA-4; The Spearman’s rank correlation test was used for statistical analysis. Correlation between EMT gene signature and histological factors: (C) sarcomatoid/rhabdoid features; (D) histological phenotypes. (E) FOXM1 IHC and histological phenotypes. (F) Representative stains of PBRM1, BAP1. Mean H-scores were compared between histological phenotypes. Error bars are SD. One-way analysis of variance with the Tukey test was used for statistics. BAP1, breast cancer 1-associated protein 1; C, clear type; CD274, cluster of differentiation 274; CTLA-4, cytotoxic T-lymphocyte associated antigen-4; E, eosinophilic type; FOXM1, forkhead box M1; IHC, immunohistochemical; M, mixed type; PBRM1, polybromo-1; PDL-1, programmed death-ligand 1; Teff, T-effector.
PBRM1 and BAP1 as candidate predictive biomarkers for immunotherapy in malignancies, including ccRCC.5 6 29 The reliability of PBRM1 and breast cancer 1-associated protein 1 (BAP1) IHC-based assays for detecting mutations in these genes has been established previously.30 The nuclear positivity of PBRM1 and BAP1 was significantly lower in the eosinophilic type than in the clear type, followed by the mixed type (all p<0.001; figure 3F).
Baseline clinicopathological characteristics in metastatic ccRCC
The baseline characteristics of 54 patients (cohort 2) are presented in table 2. Of 54 cases, 21 (38.9%) and 33 (61.1%) were included as the TKI therapy group and ICI therapy group, respectively. No significant difference was found between the two groups for any variable, including IMDC risk, sampling method, pathological factors, and histological phenotypes. The interobserver agreement for histological subtyping was comparable with that for WHO/ISUP grading (kappa statistics=0.76 vs 0.75). The eosinophilic type, followed by the mixed type (figure 4A), was enriched with the worse tumor grade, necrosis, and sarcomatoid/rhabdoid features. Regarding prognostic ability, the histological phenotypes (p=0.03; figure 4C), but not the IMDC risk stratification (figure 4B) and WHO/ISUP grade (online supplemental figure S7) (p=0.149 and p=0.265, respectively), showed obvious differences in the OS rates.
Baseline clinicopathological characteristics of 54 cases with metastatic ccRCC (cohort 2)
Oncological outcomes and histological phenotypes
The target metastatic sites were well balanced between the two groups (online supplemental table S3). During the follow-up period, 22 (40.7%) cases died of ccRCC, and 24 (44.4%) cases died of all causes (non-RCC reasons: suicide: n=1, and fall accident: n=1). The median OS for the entire cohort was 25.4 months (95% CI 13.8 months to not reached).
The maximum change in target lesions from the baseline is shown for all cases in figure 4D. These values were −25.66%±51.11, 8.10%±55.83, and −14.09%±47.07 (average±SD) for the clear, mixed, and eosinophilic types, respectively (p=0.125). Regarding the best overall response, most cases with the eosinophilic type (80%) treated with TKI resulted in PD, whereas this type in ICI groups had partial response or stable disease (online supplemental table S4). When the mixed and eosinophilic types were combined, the ICI therapy group showed a significantly higher number of cases with clinical benefit than the TKI therapy group (85.7% vs 50.0%, p=0.035; figure 4E).
The OS curves for the therapeutic and histological groups are shown in figure 4F. The median OS times of the TKI-mixed and ICI-mixed groups were 8.93 months and not reached (p=0.43), whereas those of TKI-eosinophilic and ICI-eosinophilic groups were 10.6 months and 15.0 months (p=1.00), respectively. When combining cases with the mixed and eosinophilic types and comparing them to the clear type (figures 2B–K and 3A–E), the ICI therapy group showed a significantly improved OS time compared with the TKI therapy group (p=0.047), with median OS of 27.0 and 8.93 months, respectively (figure 4G). Furthermore, in this cohort, the Cox proportional hazard regression model indicated that ICI therapy versus TKI therapy was the only independent prognostic factor for OS (HR 3.236; 95 CI 1.297 to 8.057; p=0.012; table 3). Although there was no significant difference in the PFS rates between the ICI versus TKI groups (p=0.2), the trends of the PFS curves for the therapy-phenotype groups were similar to the OS curves in mixed/eosinophilic ccRCCs (online supplemental figure S8).
Cox regression analysis of prognostic factors for overall survival in metastatic mixed/eosinophilic ccRCCs
Discussion
In the present study, we found that histological phenotypes characterized by eosinophilic features could stratify the oncological outcomes of ccRCCs. Additionally, we are the first to report this histological phenotype as a predictive marker for response to the ICI and TKI regimens.
In 1982, Fuhrman et al reported that clear cell tumors had a lower tumor grade and a lower rate of metastases compared with mixed and granular types (equivalent to the eosinophilic type).12 Although their report was published in the era before RCC subtype identification (eg, ccRCC, chromophobe RCC, Xp11.2 translocation RCC), our results are largely consistent with their findings—eosinophilic ccRCC was associated with a higher tumor grade and worse oncological outcomes regardless of the tumor stage. Furthermore, to ensure the reproducibility of determining the histological phenotype, we focused on the feature at the area of the highest grade, which is done routinely in clinical settings. The excellent interobserver agreement between the two pathologists was confirmed in the present study, demonstrating that this classification is feasible and ready to use in daily clinical practice, unlike costly genomic and transcriptomic analyses.
Nilsson et al3 were the first to perform RNA sequencing to compare histologically verified clear cell and eosinophilic areas from five biphasic ccRCC samples. They suggest that although the vasculature was more extensive in clear cell areas, more inflammation with more profuse T cell infiltration appeared in the eosinophilic areas. However, contrary to our results, the gene ontology term ‘hallmark hypoxia’ was enriched in the eosinophilic component with a low microvessel density. The present study suggests that the expression of HIF-related genes and CA9 protein was lower in the eosinophilic type than the clear type, linking these phenotypes to the expression of angiogenic factors. A previous study demonstrated that the inhibition of HIF-2 (PT2399) in ccRCCs leads to a reduction in human VEGF expression, the area of tumor vasculature, and necrotic tumors.31 Therefore, our results are in agreement with the regulation of hypoxia-induced angiogenesis.
Additionally, EMT may play an important role in angiogenic escape and/or switching.32 TKI-resistant post-ccRCC tumors showed upregulation of EMT-related genes and increased sarcomatoid features in ccRCC human and cell lines.32 Liang et al found that, among the core EMT-associated genes from the Cancer Genome Atlas data, FOXM1 and tissue inhibitor of metalloproteinase 1 (TIMP-1) were independent markers for predicting the prognosis of ccRCC and interacting with immune regulation genes.19 The present study also indicates that the mixed and eosinophilic ccRCCs showed upregulation of the EMT gene signature, including FOXM1, a higher prevalence of sarcomatoid/rhabdoid features, and poor response to TKI therapy. Additionally, the EMT-related signature was correlated with effector T cell signatures and PD-L1 expression. Therefore, EMT-targeted therapy plus immunotherapy could be a more effective therapeutic strategy for the mixed and eosinophilic types of ccRCCs.28
Our histological classification was superior to IMDC risk in terms of the prognostic predictive accuracy of metastatic ccRCC, suggesting that the IMDC clinical factor-based stratification, established in the TKI era, may not be appropriate for the agents and regimens used in current clinical practice.33 Regarding potential target markers for ICI therapy, another study with a large cohort using the database of Check Mate 009, 010, and 025 demonstrated significant clinical benefit of an anti-PD-1 agent in cases with PBRM1 loss-of-function due to a truncating mutation.34 Additionally, Motzer et al investigated IMmotion 151 data and found that sarcomatoid tumors exhibiting increased PD-L1 expression and cell cycle progression due to CDKN2A/B alterations showed clinical benefit with checkpoint blockade versus antiangiogenics alone.8 Thus, the results of our study indicate that the presence of eosinophilic tumors can be a reasonable surrogate marker for estimating the treatment response to ICIs. Furthermore, we speculate that ICI (ie, monotherapy or combination therapy) may not always be necessary for the clear type of ccRCC because this type represents an immune desert/excluded status with lower expression of immune checkpoint proteins, which translates into few benefits to prolong OS over TKI monotherapy, as demonstrated in figure 4G.
This study has several limitations. First, it has a retrospective design with a small cohort and various treatment agents and courses. Second, the tissues of the metastatic cases could not be used for gene expression or IHC analysis due to non-uniform sampling methods, leading to different amounts and qualities of tissue specimens. However, the consistency between histological phenotype and clinicopathological behavior in both cohort 1 (gene expression assessed) and cohort 2 was definitively confirmed. To externally validate our results, additional larger confirmatory studies are required. Third, we might not be able to eliminate the impact of previous TKI use on histological phenotype in some patients of the ICI group. Despite these concerns, our histological classification stratified by eosinophilic features could be useful to predict oncological outcomes and to select an optimal systemic agent for patients with metastatic ccRCC.
Conclusion
This study demonstrated that histological phenotypes, such as clear, mixed, or eosinophilic types, which have different underlying mechanisms, were significantly correlated with survival outcomes and response to checkpoint and angiogenesis blockade in patients with ccRCC.
Data availability statement
No data are available.
Ethics statements
Patient consent for publication
Ethics approval
The Kansai Medical University institutional review board approved this study.
Acknowledgments
We greatly thank Ryousuke Yamaka for his technical assistance in tissue sampling and NanoString assay. This work was supported by the research grant from Kansai Medical University (KMU) research consortium.
References
Supplementary materials
Supplementary Data
This web only file has been produced by the BMJ Publishing Group from an electronic file supplied by the author(s) and has not been edited for content.
Footnotes
Contributors Study concept and design: TY, CO. Acquisition, analysis or interpretation of data: TY, CO, JI, NA. Drafting of the manuscript: TY. Critical revision of the manuscript for important intellectual content: all authors. Statistical analysis: TY. Study supervision: TY, CO, KT, TM, HK.
Funding This study has been supported by the Japan Society for the Promotion of Science KAKENHI fund (Grant No. 20K07601 to TY, Grant No. 19K16875 to CO and Grant No. 20K16457 to HO).
Competing interests None declared.
Provenance and peer review Not commissioned; externally peer reviewed.
Supplemental material This content has been supplied by the author(s). It has not been vetted by BMJ Publishing Group Limited (BMJ) and may not have been peer-reviewed. Any opinions or recommendations discussed are solely those of the author(s) and are not endorsed by BMJ. BMJ disclaims all liability and responsibility arising from any reliance placed on the content. Where the content includes any translated material, BMJ does not warrant the accuracy and reliability of the translations (including but not limited to local regulations, clinical guidelines, terminology, drug names and drug dosages), and is not responsible for any error and/or omissions arising from translation and adaptation or otherwise.