Article Text

Abstract
Background Metformin (Met) is the first-line treatment for type 2 diabetes mellitus and plays an effective role in treating various diseases, such as cardiovascular disease, neurodegenerative disease, cancer, and aging. However, the underlying mechanism of Met-dependent antitumor immunity remains to be elucidated.
Methods MitoTEMPO, a scavenger of mitochondrial superoxide, abolished the antitumor effect of Met, but not antiprogrammed cell death (PD-1) antibody (Ab) treatment. Consequently, we studied the mechanism of the Met-induced antitumor effect. Expressions of glucose transporter (Glut)-1, mitochondrial reactive oxygen species (mtROS), interferon (IFN)-γ, Ki67, autophagy markers, activation markers for NF-E2-related factor 2 (Nrf2), and mammalian target of rapamaycin complex 1 (mTORC1) in CD8+ tumor-infiltrating T lymphocytes (CD8TILs) were examined by flow cytometry analysis. In addition, conditional knockout mice for Nrf2 and p62 were used to detect these markers, together with the monitoring of in vivo tumor growth. RNA sequencing was performed for CD8TILs and tumor cells. Melanoma cells containing an IFN-γ receptor (IFNγR) cytoplasmic domain deletion mutant was overexpressed and used for characterization of the metabolic profile of those tumor cells using a Seahorse Flux Analyzer.
Results Met administration elevates mtROS and cell surface Glut-1, resulting in the production of IFN-γ in CD8TILs. mtROS activates Nrf2 in a glycolysis-dependent manner, inducing activation of autophagy, glutaminolysis, mTORC1, and p62/SQSTM1. mTORC1-dependent phosphorylation of p62 at serine 351 (p-p62(S351)) is also involved in activation of Nrf2. Conditional deletion of Nrf2 in CD8TILs abrogates mTORC1 activation and antitumor immunity by Met. In synergy with the effect of anti-PD-1 Ab, Met boosts CD8TIL proliferation and IFN-γ secretion, resulting in decreased glycolysis and oxidative phosphorylation in tumor cells. Consequently, Glut-1 is elevated in CD8TILs, together with the expansion of activated dendritic cells. Moreover, tumor cells lacking in IFNγR signaling abolish IFN-γ production and proliferation of CD8TILs.
Conclusions We found that Met stimulates production of mtROS, which triggers Glut-1 elevation and Nrf2 activation in CD8TILs. Nrf2 activates mTORC1, whereas mTORC1 activates Nrf2 in a p-p62(S351)-dependent manner, thus creating a feedback loop that ensures CD8TILs’ proliferation. In combination with anti-PD-1 Ab, Met stimulates robust proliferation of CD8TILs and IFN-γ secretion, resulting in an IFN-γ-dependent reprogramming of the tumor microenvironment.
- immunomodulation
- lymphocytes
- tumor-infiltrating
- tumor microenvironment
- adaptive immunity
- cd8-positive T-lymphocytes
Data availability statement
Data are available upon reasonable request. All data relevant to the study are included in the article or uploaded as supplementary information.
This is an open access article distributed in accordance with the Creative Commons Attribution Non Commercial (CC BY-NC 4.0) license, which permits others to distribute, remix, adapt, build upon this work non-commercially, and license their derivative works on different terms, provided the original work is properly cited, appropriate credit is given, any changes made indicated, and the use is non-commercial. See http://creativecommons.org/licenses/by-nc/4.0/.
Statistics from Altmetric.com
- immunomodulation
- lymphocytes
- tumor-infiltrating
- tumor microenvironment
- adaptive immunity
- cd8-positive T-lymphocytes
Background
Metformin (Met) is a biguanide, used as first-line treatment for type 2 diabetes mellitus because of its safety and reliability in reducing blood glucose levels. Currently, an estimated 150 million people worldwide take Met. While it is widely accepted that Met acts by suppressing hepatic gluconeogenesis, via activation of AMP-activated protein kinase (AMPK), and inhibiting respiratory chain complex I in mitochondria, the underlying mechanisms of action are not yet fully understood.1 AMPK-independent mechanisms of Met action are also presumed to exist as Met was shown to inhibit gluconeogenesis even in hepatocytes from mice that lack AMPK catalytic subunits.2 Moreover, Met is also known to have complicated physiological effects, including roles in cardiovascular disease, neurodegenerative disorders, cancers, and aging; however, its mechanisms of action in these conditions similarly remain unclear.
Accumulating evidence suggests that long-term use of Met reduces cancer incidence and prolongs the life span of patients with type 2 diabetes compared with those taking other drugs.3–5 In addition, combined use of Met with an anti-PD-1 antibody (Ab), an immune checkpoint inhibitor that reactivates dysfunctional T cells,6 has been shown to have therapeutic benefits for the treatment of cancers in humans7 and mice.8 The underlying mechanisms involved in these Met-dependent (as well as combination therapy) antitumor effects have remained elusive.
Mitochondrial respiratory chain complex I is believed to be a Met target; therefore, Met’s suppressive effects on cancer are presumed to act by inhibiting oxidative phosphorylation (OxPhos). However, such inhibition would require millimolar concentrations that are supraphysiological. Conversely, the more subtle complex I inhibition likely to be caused by physiological concentrations of Met may mildly suppress electron transport, leading to the production of low-level mitochondrial reactive oxygen species (mtROS). While large amounts of ROS are generally associated with cellular damage and accelerated aging, they also act as second messengers, especially at low concentrations, to modulate cellular responses.9 Indeed, Met-induced mtROS help extend life span in Caenorhabditis elegans, and these effects are abrogated by antioxidants.10 In addition, in a T-Uqcrfs−/− mouse model (deficient in a complex III subunit), mitochondrial complex intIII-derived ROS were shown to participate in nuclear factor activation in activated T cells, leading to interleukin-2 production by CD4+ T cells.11
In light of these findings, our previous observation that Met stimulates antitumor immunity by reactivating CD8+ tumor-infiltrating T lymphocytes (CD8TILs)12 prompted us to examine whether Met-dependent mtROS production occurs, and if so, whether mtROS may be involved in activating CD8TILs and tumor immunity. The present study aimed to elucidate the underlying mechanisms involved in activation and proliferation of CD8TILs and reorganization of the tumor microenvironment (TME) by Met.
Methods
Mice
BALB/c and C57BL/6 (B6) mice were purchased from SLC (Shizuoka, Japan). Gzmb-Cre mice were obtained from the Jackson laboratory (Bar Harbor, Maine, USA). All mice were maintained under specific pathogen-free conditions in the animal facility of Okayama University. The Institutional Animal Care and Use Committee of Okayama University Graduate School of Medicine approved the studies.
Generation of NF-E2-related factor 2 (Nrf2) and p62 conditional KO mice
Nrf2 flox/+ mice were generated by UNITECH Co (Kashiwa, Japan). Briefly, Exon 3–5 of Nfe2I2 gene (encoding Nrf2 protein) was sandwiched by loxP and FRT-Neo-FRT-loxP sites, and the linearized targeting vector was transfected into B6 Embryonic stem (ES) cells. Homologous recombination at the correct position was achieved using the diphtheria toxin A sequence. G418-resistant clones were screened for homologous recombination by Southern blot. Germline chimeric mice were generated by injecting the ES cells into BALB/c blastocysts. Chimeric mice with a high ES cell contribution were crossed with C57BL/6 mice to generate Nrf2neo/+ mice, which were crossed with CAG-FLP mice to remove the Neo cassette and generate Nrf2flox mice. The FRT site was removed by crossing Nrf2flox mice with C57BL/6 mice. p62flox mice were generated in a previous study.13 Nrf2flox/+ and p62flox/+ mice were crossed with Gzmb-Cre mice, and their F1 progeny were interbred to generate Nrf2flox/flox or p62flox/flox-Gzmb-Cre mice. Activation of CD8T cells from these mice results in the expression of granzyme B-Cre, leading to the deletion of Nrf2 or p62.
Cell lines
BALB/c fibrosarcoma Meth A and B6 OVA gene-transduced B16 melanoma MO5 cells were used for tumor assays as in previous studies.12 3LL cells were kindly provided by Dr H Yagita, Juntendo University School of Medicine, Tokyo, Japan. B16 fucci and B16 fucci δIC cells were used for tumor assays as in previous studies.14
Detection of glucose transporter (Glut)
Cells were cultured in Rosewell Park Memorial Institute (RPMI) 1640 medium in the presence of glucose (0, 0.1, 1.2, 6.1, or 25 mM) at 37℃ for 0, 1, 3, or 6 hours followed by surface staining for CD45.2, CD3, CD8 and Glut-1. Glut-1 staining with anti-Glucose Transporter GLUT1 Ab (EPR3915, Abcam) was previously demonstrated on the cell surface.15
Statistical evaluation
Student’s t-test was used for statistical comparisons of normally distributed data.
Results
Production of mtROS and Nrf2 activation in CD8TILs by Met
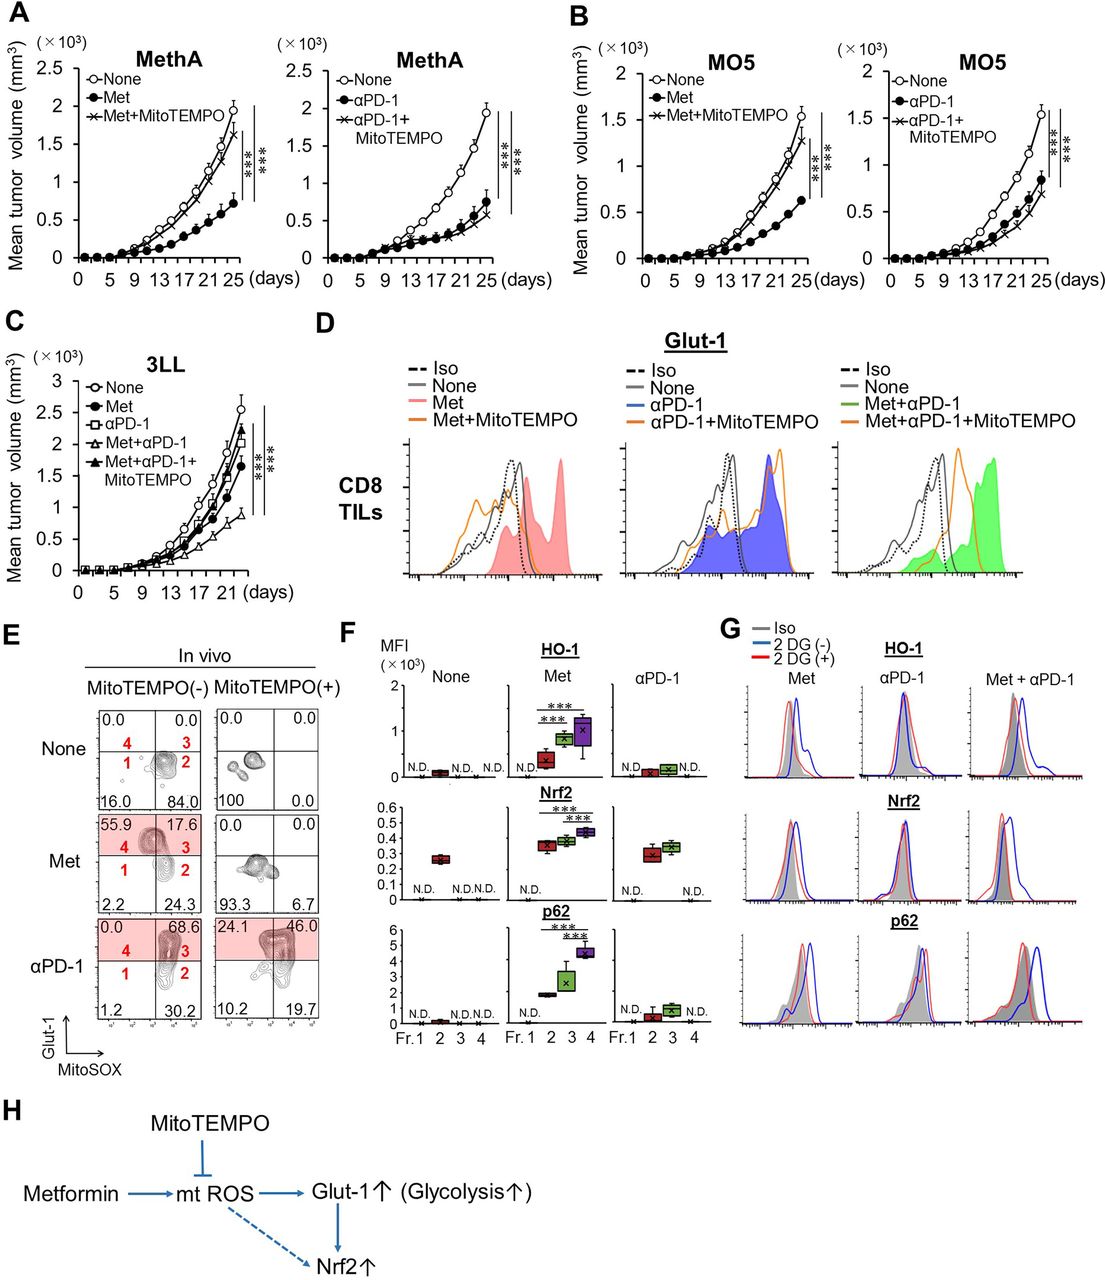
To explore whether mtROS may be involved in Met and/or anti-PD-1 Ab-dependent antitumor immunity, we used MitoTEMPO, a mitochondrially targeted superoxide dismutase mimetic capable of scavenging mitochondrial superoxide. Administration of MitoTEMPO to tumor-bearing mice was found to abrogate the Met-dependent antitumor effect (figure 1A–C and online supplemental figures S1A–C) and interferon (IFN)-γ production by CD8TILs (online supplemental figure S2A). However, anti-PD-1 Ab-induced tumor growth inhibition and cytokine production by CD8TILs were unaffected (figure 1A–C, online supplemental figure S1A–C and online supplemental figure S2A). The results suggested that the Met-induced antitumor effect depended on mtROS, whereas the effect of anti-PD-1 Ab did not.
Supplemental material
Supplemental material
Supplemental material

mtROS and Met-dependent CD8TIL activation. (A–C) Mice were challenged with intradermal dorsal tumors on day 0. MitoTEMPO was administered from day 5; Met and/or anti-PD-1 Ab treatments were initiated on day 7. Anti-PD-1 Ab was injected every 4 days. Tumor growth was monitored every other day. Data show mean tumor volume±SE from pooled data of two independent experiments (n=5×2). (D) Glut-1 expression on the surface of CD8TILs of Meth A-bearing mice that were treated as indicated. (E) mtROS and Glut-1 expression in CD8TILs of treated mice. (F) Expressions of HO-1, Nrf2, and p62 in fractions1–4 of CD8TILs as in (E) from mice treated as indicated. (G) Expressions of HO-1, Nrf2, and p62 of total CD8TILs after incubation with or without 2DG. (H) Met-induced mtROS production, Glut-1 elevation, and Nrf2 activation. (E,F) Results are representative of three and four independent experiments, respectively. (D,G) The experiments were performed twice with similar outcome. *P<0.05, **P<0.01, ***P< 0.001 using Student’s t-test. Ab, antibody; CD8TIL, CD8+ tumor-infiltrating T lymphocyte; HO-1, hemeoxygenase-1; Met, metformin; mtROS, mitochondrial reactive oxygen species; Nrf2, NF-E2-related factor 2; MFI, mean fluorescence intensity.
IFN-γ production from CD8 T cells is dependent on glycolysis.16 Cell surface expression of Glut-1, a Glut, for glucose uptake is the first step in the activation of glycolysis in CD8+ T cells. In addition, ROS is known to upregulate Glut-1 on cell surface via vesicular trafficking.17 Therefore, we investigated whether mtROS is involved in expression of Glut-1 on cell surface of CD8TILs after Met treatment. Glut-1 elevation was observed in CD8TILs of mice treated with Met, anti-PD-1 Ab or both. Administration of MitoTEMPO abrogated the elevation of Glut-1 induced by Met, Met plus anti-PD-1 Ab, but not by anti-PD-1 Ab alone (figure 1D). The results indicate that Met (but not anti-PD-1 Ab)-induced Glut-1 elevation depends on mtROS. Glut-1 elevation was dependent on both the incubation time and the presence of glucose in the culture medium (online supplemental figures S2B,C). Furthermore, Glut-1+, but not Glut-1−, CD8TILs produced IFN-γ (online supplemental figure S2D). Importantly, Glut-1 elevation was only observed in CD8TILs but not CD8+ T cells from draining lymph nodes (dLNs) or the spleen (online supplemental figure S2E).
We were curious about the relationship between mtROS and Glut-1 elevation in CD8TILs. Tumor infiltrating lymphocytes (TILs) from tumor-bearing mice treated with Met or anti-PD-1 Ab, along with or without coadministration of MitoTEMPO, were cultured, and levels of Glut-1 and mtROS levels were monitored over time (online supplemental figure S3A and figure 1E). Neither mtROS nor Glut-1 expression was observed on ex vivo CD8TILs before treatment with Met or anti-PD-1 Ab. However, after 6-hour incubation, two populations of Glut-1highROShigh (fraction 3) and Glut-1highROSlow (fraction 4) cells were observed in CD8TILs of Met-treated mice (figure 1E). Both of the Glut-1high populations were abrogated by coadministration of MitoTEMPO (figure 1E). By contrast, in anti-PD-1 Ab-treated mice, only the Glut-1highROShigh CD8TIL population was observed, and MitoTEMPO treatment did not reduce this population (figure 1E). These inhibitory patterns were recapitulated in vitro by incubating CD8TILs with MitoTEMPO (online supplemental figure S3B). As ROS is known to activate Nrf2, a major transcription factor for antioxidative stress response,18 we hypothesized that the Glut-1highROSlow population (fraction 4) in the Met-treated group may have derived from partial mtROS elimination from cells by an Nrf2-dependent antioxidative stress response, otherwise found in the Glut-1highROShigh population (fraction 3). To test this, we examined the expression of heme oxygenase-1 (HO-1), which acts downstream of Nrf2 and plays a critical role in protecting cells from oxidative stress.19 HO-1 levels were highest in fraction 4, reduced in fraction 3 after Met treatment, but absent after anti-PD-1 Ab treatment (figure 1F). Moreover, Nrf2 expression was highest in fraction 4, as was expression of p62 (that acts downstream of Nrf2) (figure 1F). The elevation of HO-1, Nrf2, and p62 in total CD8TILs was observed in mice treated with Met or after combination therapy, but was abolished after incubation with 2-deoxyglucose (figure 1G), demonstrating that Nrf2 activation is dependent on glycolysis. Collectively, Met stimulates mtROS production, resulting in the activation of Nrf2 in a glycolysis-dependent manner (figure 1H).
Supplemental material
Antitumor effect of glucose supplementation with Met and/or anti-PD-1 Ab
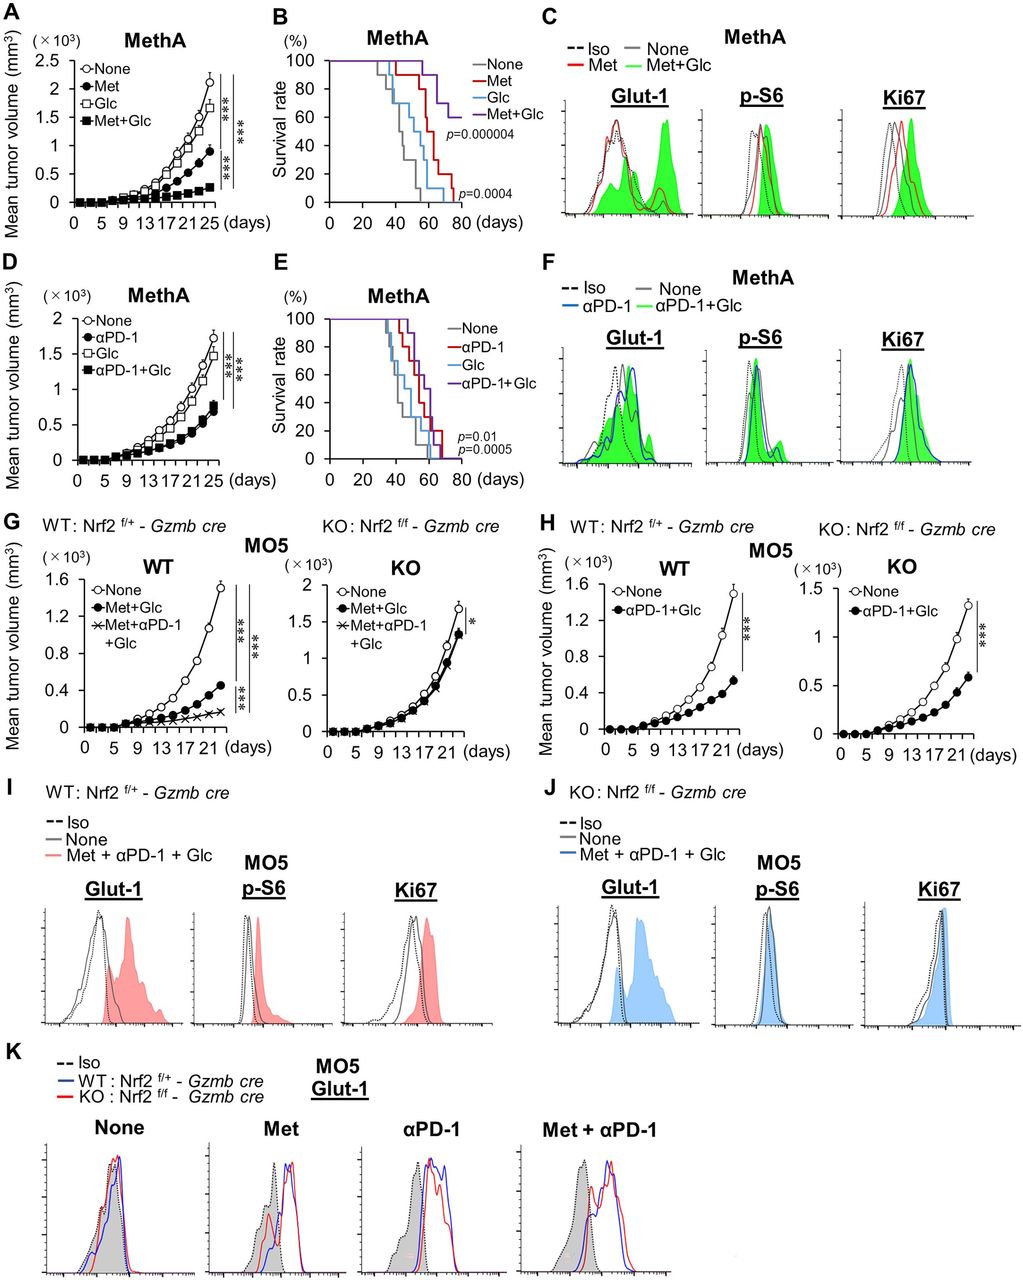
Met-dependent activation of Nrf2 was found to be dependent on glycolysis; therefore, it is plausible this mechanism may play a role in the antitumor effect of Met. We hypothesized that glucose dietary supplementation in mice could amplify Met-dependent antitumor effects because increased glucose concentrations would elevate levels of Glut-1 (online supplemental figure S2C). We found that Met treatment, in combination with glucose supplementation in the drinking water, resulted in enhanced efficacy of Met and the combination therapy against Meth A and MO5 cell tumors (figure 2A,B, and online supplemental figures S4A–G). In addition to Glut-1, we examined levels of phosphorylated S6 protein (p-S6), downstream of mammalian target of rapamaycin complex 1 (mTORC1), and Ki67, a cell proliferation marker, in CD8TILs. Elevation of Glut-1, p-S6, and Ki67 was observed, including in ex vivo CD8TILs derived from mice supplemented with glucose in the drinking water (figure 2C). In contrast, no additive effect was observed from glucose supplementation (figure 2D,E, and online supplemental figures S4H), and no elevation of Glut-1, p-S6, and Ki67 was detected after anti-PD-1 Ab treatment (figure 2F).
Supplemental material
Supplemental material

Antitumor effects by glucose supplementation and the Nrf2 dependency. (A–F) Syngeneic mice inoculated with Meth A (A,B,D,E) were treated with Met, anti-PD-1 Ab, and glucose, as indicated from day 7 after tumor challenge. Tumor growth and survival time were monitored, and the data show mean tumor volume±SE from pooled data of two independent experiments (n=5×2). Expressions of Glut-1, p-S6, and Ki67 of ex vivo CD8TILs of mice treated as indicated are shown (C,F). The experiment was performed twice with a similar outcome. (G,H) Antitumor immunity in conditional Nrf2KO mice. WT (Nrf2f/+-Gzmb CRE) and KO (Nrf2f/f-Gzmb CRE) mice, inoculated with MO5, were administered with Met, anti-PD-1 Ab, and glucose, as indicated, from day 7 after tumor challenge. Tumor growth was monitored, and the data show mean tumor volume±SE from pooled data of two independent experiments (n=5×2). (I,J) Expressions of Glut-1, p-S6, and Ki67 in ex vivo CD8TILs from mice, treated as indicated. Flow cytometry data are from TILs pooled from five mice. (K) Glut-1 expressions on CD8TILs of mice treated as indicated after incubation for 6 hours in vitro. (F,J,K) Results are representative of three independent experiments. (G,H) The experiments were performed twice with similar outcome. *P<0.05, **P<0.01, ***P<0.001 using Student’s t-test. CD8TIL, CD8+ tumor-infiltrating T lymphocyte; KO, knockout; Met, metformin; Nrf2, NF-E2-related factor 2; WT, wild type.
The reason for the difference between Met and anti-PD-1 Ab treatments could be related to differences in the local glucose concentration in the tumor. To test this, the tumor glucose concentration was measured on day 3 after treatment. Consistent with this hypothesis, glucose levels were increased in response to Met and the combination therapy of Met and anti-PD-1 Ab, but not anti-PD-1 Ab alone (online supplemental figure S4I). Furthermore, tumor weights were inversely correlated with glucose concentration at the tumor tissue (online supplemental figure S4J).
Conditional deletion of Nrf2 and expressions of GLUT-1, p-S6, and Ki67 of CD8TILs
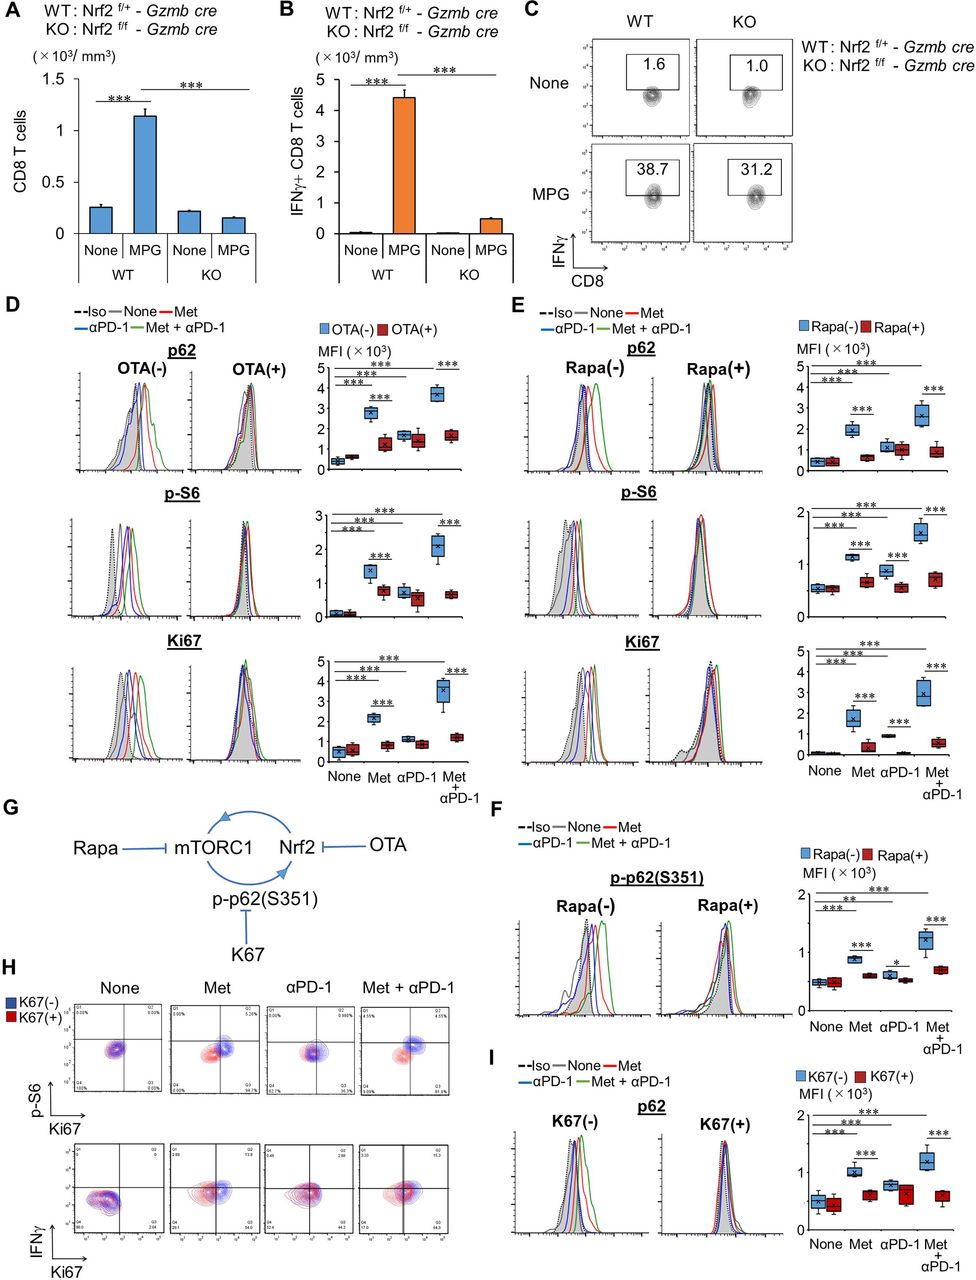
To test the role of Nrf2 in CD8TILs, we generated Nrf2 flox mice (online supplemental figures S5A–C) and crossed them with granzyme B-Cre (Gzmb-Cre) transgenic mice (Nrf2f/f – Gzmb-Cre) to produce inducible Nrf2KO CD8TILs. Nrf2 expression was not detected in CD8T cells on stimulation with T cell antigen receptor (TCR), while it was detected in CD4T cells, as determined by western blotting (online supplemental figure S5D). The strong antitumor effect observed after supplementation of glucose with Met treatment and combination therapy was completely abrogated after conditional deletion of Nrf2 (figure 2G and online supplemental figures S6A). The antitumor effect of anti-PD-1 and glucose supplementation was not affected by Nrf2 deletion (figure 2H and online supplemental figure S6B). Elevations of p-S6 and Ki67 were abolished in Nrf2KO CD8TILs; however, Glut-1 elevation was unaffected (figure 2I,J). Notably, Glut-1 elevation was observed in Nrf2KO CD8TILs of mice treated with Met, anti-PD-1 Ab, or with the combination therapy (figure 2). Thus, Nrf2 is not essential for Glut-1 elevation by the treatments. Although numbers of total CD8TILs and IFN-γ secreting CD8TILs were dramatically decreased, the frequency of IFN-γ producing CD8TILs was not changed in Nrf2KO mice (figure 3A–C).
Supplemental material
Supplemental material

Nrf2 and mTORC1 in Met-dependent antitumor immunity. (A–C) CD8TIL numbers (A) and their IFN-γ production (B,C) in WT and Nrf2 conditional KO mice, treated as indicated. The experiment was performed twice with similar outcome. (D,E) Expression of p62, p-S6, and Ki67 in CD8TILs from mice, treated as indicated, shown as a histogram and bar graph (n=5), after incubation with or without OTA (D) and rapa (E). (F) Expression of p-p62 (S351) in CD8TILs from mice, treated as indicated, shown as a histogram and bar graph (n=5), after incubation with or without rapa. (G) Model of the feedback loop between Nrf2 and mTORC1. (H) Expressions of Ki67 and p-S6 or IFN-γ in CD8TILs from mice, treated as indicated, are shown, after incubation with or without K67. Flow cytometry data are from TILs pooled from five mice in each group. (I) Expression of p62 in CD8TILs from mice, treated as indicated, shown as a histogram and bar graph (n=5), after incubation with or without K67. (F,H,I) Results are representative of four independent experiments. (D,E) The experiments were performed twice with similar outcome. **P<0.01, ***P<0.001 using Student’s t-test. CD8TIL, CD8+ tumor-infiltrating T lymphocyte; IFN, interferon; KO, knockout; Met, metformin; MPG, combination treatment of Met+anti-PD-1 Ab+glucose; mTORC1, mammalian target of rapamaycin complex 1; Nrf2, NF-E2-related factor 2; OTA, ochratoxin A; WT, wild type.
Pharmacological inhibition of Nrf2 and mTORC1 in CD8TILs
Met-induced mTORC1 activation was abrogated completely in Nrf2KO CD8TILs (figure 2J). To further investigate the relationship between Nrf2 and mTORC1, we performed ex vivo experiments with chemical inhibitors of Nrf2 and mTORC1. Levels of p62, p-S6, and Ki67 were elevated in the CD8TILs of Meth A-bearing mice treated with Met over controls (figure 3D). The elevations were more pronounced in CD8TILs of mice treated with combination therapy and less pronounced in those treated with anti-PD-1 Ab alone. Ochratoxin A (OTA), an Nrf2 inhibitor (which blocks translocation of Nrf2 into the nucleus), suppressed the increase of p62, p-S6, and Ki67 in Met and combination therapy groups but not in the anti-PD-1 Ab treatment group (figure 3D). Conversely, rapamycin suppressed the increase of p62, p-S6, and Ki67 after Met and combination therapy (figure 3E). The results indicate that activation of Nrf2 and mTORC1 are codependent. The mechanism of how mTORC1 activates Nrf2 is unknown. A previous report demonstrated that phosphorylated p62 at serine 351 (p-p62(S351)) results in the dissociation of Kelch-like ECH-associated protein 1 (Keap1) from Nrf2, which allows Nrf2 translocation into the nucleus, activating Nrf2.20 The authors also found a novel inhibitor, K67, which inhibits p-p62(S351), mediated Nrf2 activation.21 Based on this study, we checked expression of p-p62(S351) in CD8TILs and found that it was significantly increased (figure 3F). Moreover, the increase was suppressed by rapamycin (figure 3F). It is possible that mTORC1 elevates p-p62(S351), which enabled activation of Nrf2 in CD8TILs, as illustrated in figure 3G. We therefore tested whether K67 blocked elevation of p-S6, Ki67, p62, and IFN-γ production. K67 blocked the elevation of p-S6, Ki67 (figure 3H), and p62 (figure 3I) in CD8TILs of mice treated with Met but not with anti-PD-1 Ab. Notably, K67 did not inhibit IFN-γ production of CD8TILs of mice treated with Met and combination therapy (figure 3H). These results are consistent with our observation that Nrf2 is not essential for IFN-γ production in CD8TILs (figure 3C).
Autophagy and glutaminolysis on activation of mTORC1 in CD8TILs
We next tried to clarify how Nrf2 activates mTORC1. Glutamine is essential for rapidly dividing both normal cells and tumor cells.22 CD8TILs may use autophagy to maintain intracellular glutamine as TME is extremely nutrient-deficient. We found that both Met and the combination therapy markedly elevated LC3B, a marker of autophagy, and use of OTA blocked the elevation (figure 4A), suggesting that Nrf2 activates autophagy. Met and combination therapy also upregulated phosphorylated p62 at serine 403, p-p62 (S403) in an OTA sensitive manner (figure 4B). p-p62 (S403) has previously been implicated as an essential component in selective autophagy.23 We therefore investigated effects of 3MA, an inhibitor of autophagosome formation and chloroquine, an inhibitor of lysosomal degradation within autophagosomes. 3MA blocked elevation of LC3B, p-S6, and Ki67 (figure 4C). Chloroquine inhibited elevation of p-S6 and Ki67 and resulted in LC3B accumulation in CD8TILs (figure 4D). These results suggest that autophagy-dependent degradation products are necessary for mTORC1 activation in CD8TILs. Chloroquine also blocked elevation of HO-1, suggesting that autophagy may play a role in the activation of mTORC1, which in turn results in activation of Nrf2.
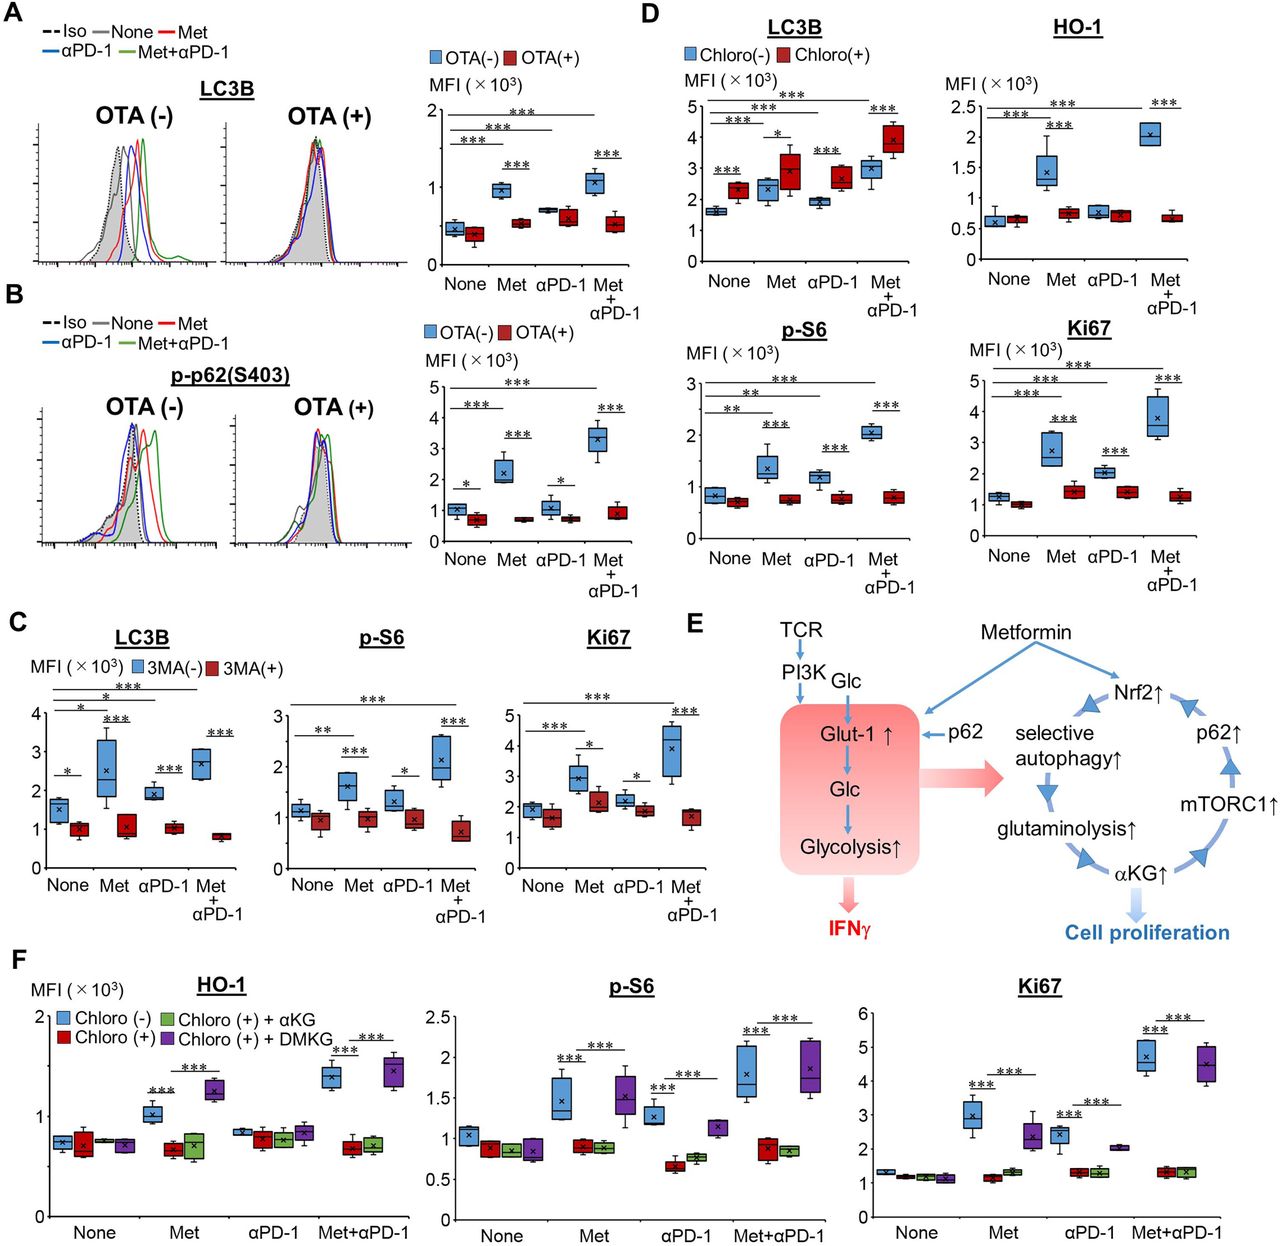
Autophagy and αKG in Met-induced proliferation of CD8TILs. (A,B) Expression levels of LC3B (A) and p-p62 (S403) (B) in CD8TILs from Meth A-bearing mice, treated as indicated, shown as a histogram and bar graph (n=5), after incubation with or without OTA. (C) Expressions of LC3B, p-S6, and Ki67 in CD8TILs from mice, treated as indicated, shown as a bar graph (n=5), after incubation with or without 3MA. (D) Expression levels of LC3B, p-S6, HO-1, and Ki67 in CD8TILs from mice, treated as indicated, shown as a bar graph (n=5), after incubation with or without Chloro. The results are representative of three independent experiments. (E) Mechanistic insight of Met-induced IFN-γ production and proliferation of CD8TILs. (F) Expression levels of HO-1, p-S6, and Ki67 in CD8TILs from mice, treated as indicated, shown as a bar graph (n=5), after incubation with or without Chloro, Chloro and αKG or DMKG. The experiment was performed twice with a similar outcome. *P<0.05, **P<0.01, ***P< 0.001 using Student’s t-test. αKG, α-ketoglutarate; CD8TIL, CD8+ tumor-infiltrating T lymphocyte; Chloro, chloroquine; IFN, interferon; Met, metformin; MPG, combination treatment of Met+anti-PD-1 Ab+glucose; OTA, ochratoxin A.
α-Ketoglutarate (αKG) is known to activate mTORC1 by translocation of mTOR to the lysosomal membrane through GTP loading of RagB, and it can be produced via glutaminolysis from glutamine.24 Therefore, we hypothesized that in CD8TILs, autophagy generates glutamine as a substrate for glutaminolysis, from which αKG would be generated, and that αKG may go on to activate mTORC1 (figure 4E). To explore this, we first investigated whether elevations of p62, p-S6, and Ki67 were dependent on glutaminolysis in CD8TILs. Two inhibitors to glutaminase (that converts glutamine to glutamate), bis-2-(5-phenylacetamido-1,2,4-thiadiazol-2-yl) ethyl sulfide and 6-diazo-5-oxo-L-norleucine, and an inhibitor to glutamine dehydrogenase 1 (that converts glutamate to αKG), epigallocatechin gallate, were all found to block the elevation of p62, p-S6, and Ki67 (online supplemental figures S7A–C). Second, chloroquine-dependent suppression of HO-1, p-S6, and Ki67 was completely restored by incubation of CD8TILs with cell membrane permeable αKG (dimethyl-α-ketoglutarate (DMKG)) but not αKG (figure 4F). Thus, intracellular but not extracellular αKG is required for the activation of mTORC1. Collectively, these results indicate that glutamine, derived from Nrf2-dependent autophagy, is converted to αKG via glutaminolysis and then used to activate mTORC1, as has previously been suggested.25
Supplemental material
Conditional deletion of p62 and expression of Glut-1, p-S6, and Ki67 of CD8TILs
mtROS-mediated Nrf2 activation is essential for Met-dependent proliferation of CD8TILs. In addition, mTORC1-dependent p62 activation is required for Nrf2 activation (figure 3F,H,I). Therefore, to further clarify how p62 and Nrf2 coordinate the activation and proliferation of CD8TILs, we produced conditional p62 knockout (KO) mice through crossing p62f/f mice13 with Gzmb-Cre mice. The antitumor effects of either Met or combination therapy were completely abrogated in the p62 KO mice that were supplemented with glucose (figure 5A and online supplemental figures S8). However, in contrast to the Nrf2KO mice, both absolute numbers and frequency of IFN-γ+CD8TILs were decreased in p62 KO (figure 5B). Elevations of Glut-1, p-S6, and Ki67 were not observed in ex vivo CD8TILs from p62 KO mice (figure 5C,D). Furthermore, elevations of HO-1, p62, p-S6, and Ki67 were not seen in either p62KO or Nrf2KO CD8TILs following in vitro culture (online supplemental figure S9A,B). Met-induced elevation of phospho-4E-BP1 (Thr37 and Thr46), an additional downstream marker of mTORC1, was canceled in CD8TILs of Nrf2KO mice (online supplemental figure S9C). Glut-1 levels, which were elevated in Nrf2 KO CD8TILs (figure 2K), were reduced in p62 KO cells (figure 5E). Thus, Glut-1 elevation by Met, anti-PD-1 Ab, and the combination therapy are dependent on p62 but not on Nrf2. Splenic CD8T cells express extremely low amounts of Glut-1 and OCT1, a transporter for Met, but these levels dramatically increased on TCR (anti-CD3 Ab and anti-CD28 Ab) stimulation, as determined by western blotting (figure 5F). p62 deficiency abrogated cell surface expression of Glut-1 and the uptake of a glucose analog, 2-NBDG, although total Glut-1 protein levels were comparable with those of WT CD8T cells (figure 5F). These results indicate that p62 may be essential for vesicular trafficking of Glut-1 to the cell surface. Consistent with this, 3MA, an inhibitor for autophagy, blocked Glut-1 upregulation in CD8TILs of mice treated with Met, anti-PD-1 Ab, and combination therapy (figure 5G). Nrf2-independent, constitutively expressed p62 is thus essential for Glut-1 expression, but stress (mtROS)-inducible, adaptive elevation of p62, which is regulated by Nrf2, might play a crucial role in cell proliferation through activation of mTORC1 (figure 4E).
Supplemental material
Supplemental material
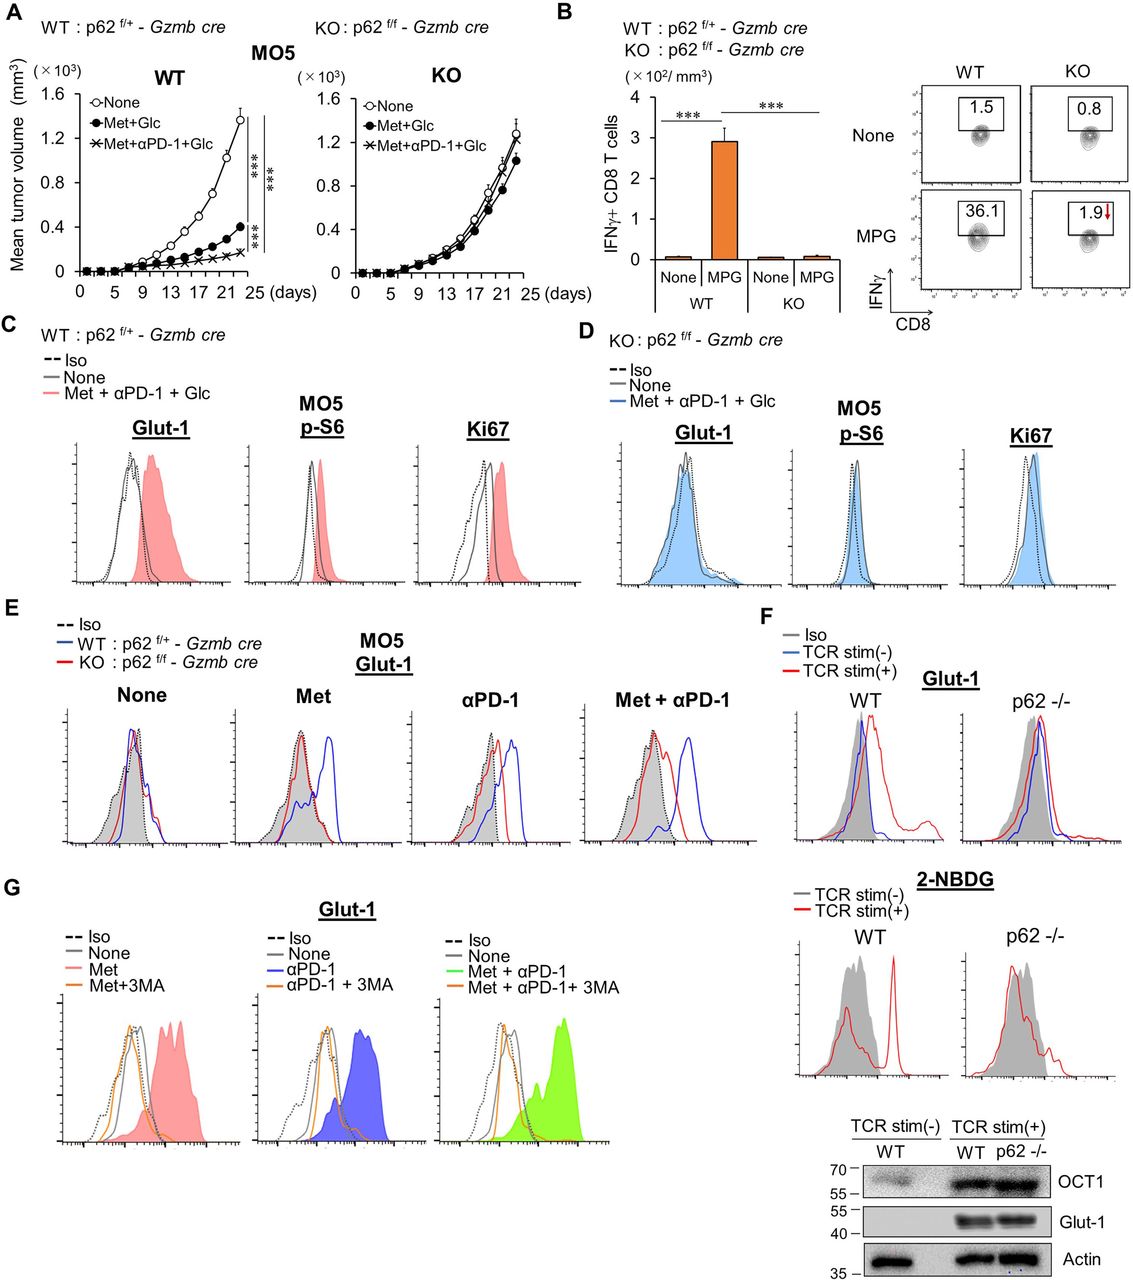
p62 in Met-dependent antitumor immunity. (A) WT (p62f/+-Gzmb CRE) and KO (p62f/f-Gzmb CRE) mice, inoculated with MO5, were administered with Met+Glc, or Met+anti-PD-1 Ab+glucose, as indicated, from day 7 after tumor challenge. Tumor growth was monitored, and the data show the mean tumor volume±SE from pooled data of two independent experiments (n=5×2). (B) Numbers and IFN-γ production of CD8TILs in WT and p62 conditional KO mice, treated as indicated. MPG: combination treatment of Met+anti-PD-1 Ab +glucose. The experiment was performed twice with similar outcome. (C,D) Expression levels of Glut-1, p-S6, and Ki67 in ex vivo CD8TILs from WT (C) and p62KO mice (D), treated as indicated. Histogram data are from TILs pooled from five mice. (E) Glut-1 expressions on CD8TILs of mice treated as indicated after incubation for 6 hour in vitro. The results are representative of three independent experiments. (F) Glut-1 expression on the cell surface and uptake of 2-NBDG of unstimulated or activated CD8T cells from WT or p62KO mice. The lower panel is a western blot for levels of OCT1, Glut-1, and actin as an internal control of unstimulated and activated CD8T cells from WT or p62KO mice. The experiment was performed twice with similar outcome. (G) Glut-1 expression levels in CD8TILs of Meth A-bearing mice treated as indicated after incubation with or without 3MA in vitro. Histogram data are from TILs pooled from five mice. The experiment was performed twice with similar outcome. ***P<0.001 using Student’s t-test. CD8TIL, CD8+ tumor-infiltrating T lymphocyte; IFN, interferon; KO, knockout; Met, metformin; WT, wild type.
Combination therapy induces an intense IFN-γ response in the TME
To characterize how combination therapy is distinct from Met or PD-1 Ab treatments, we identified gene signatures of tumor cells as well as CD8+ immune cells. RNA sequencing analysis revealed distinct gene expression patterns in CD8+ cells, including both CD8TILs and CD8 dendritic cells (CD8DCs) that were dependent on treatments with Met, anti-PD-1 Ab, and combination therapy (figure 6A), as well as signatures of tumor cells (MO5, online supplemental figure S10A). Combination therapy, to a greater extent than either single therapy, induced expression of genes in CD8+ cells associated with T-cell homing receptors such as CXCR6, chemokines including CCL4, IFN-γ, and granzyme B (figure 6B). Enrichment analysis, performed to evaluate the effects of transcription factors on their ability to bind to target genes (weighted parametric gene set analysis (wPGSA)), revealed activation of STAT1, STAT2, IRF1, and IRF8 in CD8+ cells as well as in tumor cells following combination therapy (figure 6C and online supplemental figure S10B). Moreover, gene expressions related to histone acetylation and chromatin remodeling, such as KAT2A, KAT8, KAT5, and SIR1, were observed to be decreased in tumor cells in response to combination therapy (online supplemental figure S10B). In contrast, these were upregulated in response to anti-PD-1 Ab treatment alone (online supplemental figure S10B). Generally Applicable Gene set Enrichment (GAGE)–Kyoto Encyclopedia of Genes and Genomes and GAGE–Gene Ontology scores predicted enhanced gene products in tumor cells related to autoimmune diseases, graft-versus-host disease, allograft rejection, and antigen processing/presentation in response to combination therapy (online supplemental figures S10C,D), suggesting inflammatory changes in the TME.
Supplemental material

IFNγR signaling and tumor cell metabolism. (A–C) Tumor-infiltrating CD8+ cells were collected after FACS sorting from MO5-bearing mice treated as indicated. (A) Gene expression patterns in CD8+ cells assessed by t-distributed Stochastic Neighbor Embedding (tSNE). (B) Immune-related differentially expressed genes (log-fold change). (C) Summary of altered transcriptional regulation assessed by weighted parametric gene set analysis after therapy as indicated. (D,E) Mice inoculated with B16-fucci (D) or B16-fucci δIC (E) were treated with Met and anti-PD-1 Ab, from day 7 after tumor challenge. Tumor growth was monitored, and the data show mean tumor volume±SE from pooled data of two independent experiments (n=5×2). (F,G) Expression levels of GLUT-1, p-S6, and Ki67 of CD8TILs of mice inoculated with B16-fucci (F) or B16-fucci δIC (G) are shown after in vitro incubation for 6 hours. Tumor-infiltrating cells were a pool of five mice in each group. (H) Glucose concentration of tumors of mice inoculated with B16-fucci (upper) or B16-fucci δIC (lower), treated with or without MG. (I,J) Metabolic profile including ECAR and OCR of B16-fucci (upper) or B16-fucci δIC (lower) incubated with IFN-γ. (D–J) The experiments were performed twice with similar outcome. *P<0.05, ***P<0.001 using Student’s t-test. CD8TIL, CD8+ tumor-infiltrating T lymphocyte; FCCP, carbonyl cyanide-p-trifluoromethoxyphenylhydrazone; IFN, interferon; IFNγR, IFN-γ receptor; Met, metformin; MG, Met+anti-PD-1 Ab; R/A, rotenone and antimycin A.
We used fluorescence-activated cell sorting (FACS) analysis to confirm the increased expression of certain targets in CD8TILs and CD8DCs from the RNA-sequencing dataset. CXCR4, CXCR6, and CXCR3 were elevated in CD8TILs in response to combination therapy in a MitoTEMPO-sensitive manner (online supplemental figure S11A). Upregulation of IRF8 and IRF1 were confirmed in both CD8TILs and CD8DCs, and MitoTEMPO treatment or injection of IFN-γ-neutralizing Abs (anti-IFN-γ Ab) blocked these increases (online supplemental figures S11B,C). MitoTEMPO and anti-IFN-γ Ab also blocked CD80, CD86, and major histocompatibility complex class II in CD8DCs (online supplemental figure S11D). An increase in the CD11c+CD11b− dendritic cell (DC) population was observed after combination therapy, which was blocked by either MitoTEMPO or anti-IFN-γ Ab (online supplemental figure S11E). Collectively, these results indicate that IFN-γ produced from CD8TILs plays an important role in the induction of IRF8 and IRF1 in CD8TILs possibly in an autocrine manner and CD8DCs and tumor cells in a paracrine manner. It also promotes CD8DC activation and expansion.
Supplemental material
Activation of CD8TILs and IFN-γ receptor (IFNγR) signaling in tumor cells
wPGSA analysis revealed activation of STAT1, STAT2, IRF1, and IRF8 in tumor cells of mice treated with combination therapy (online supplemental figure S10B); therefore, we decided to investigate the impact of IFNγR signaling on antitumor immunity in tumor cells. To do this, we used two melanoma cell lines, B16 fucci and B16 fucci δIC, in which a deletion mutant of cytoplasmic domain of IFNγR was overexpressed. It was previously reported that an antitumor effect of adoptively transferred, tumor antigen-specific CD8T cells was observed in B16 fucci-bearing mice, but the effect was abolished in B16 fucci δIC-bearing mice.14 The results imply that IFNγR signaling in tumor cells is required for CD8T cell-dependent antitumor effect. The antitumor effect was suggested to connect with IFN-γ-induced cell cycle arrest at G1 phase in tumor cells.14 Consistent with this, combination therapy-induced tumor growth inhibition was observed in B16 fucci-bearing mice, but the effect was abolished in B16 fucci δIC-bearing mice (figure 6D,E, and online supplemental figures S12A,B). Importantly, IFN-γ production and the elevation of p-S6, p62, and Ki67 levels were also completely abolished in CD8TILs of B16 fucci δIC-bearing mice, as compared with those in B16 fucci-bearing mice (figure 6F,G). Moreover, the elevation of glucose concentrations in tumors was absent from B16 fucci δIC mice (figure 6). The biology of CD8TILs thus seemed to be determined by the presence of IFNγR signaling in tumor cells. In addition, we found that gene products related to the mitochondrial respiratory chain were decreased in tumor cells (MO5) but not in CD8TILs of mice treated with combination therapy (online supplemental figure S13). The results prompted us to investigate the effects of IFN-γ on the metabolism of B16 fucci and B16 fucci δIC cells in vitro. Both OxPhos and glycolysis were significantly decreased in B16 fucci lines but not in B16 fucci δIC after IFN-γ treatment (figure 6I,J). Thus, metabolism appears to be globally downregulated by IFNγR signaling in tumor cells.
Supplemental material
Supplemental material
Discussion
The current study identified a novel role for Nrf2 in Met-induced, CD8T cell-mediated antitumor immunity and the synergistic effect of Met in combination with anti-PD-1 Ab. Recent evidence indicates that Met not only decreases the number of myeloid-derived suppressor cells26–28 and regulatory T cells29 in tumors but also converts tumor-associated macrophages from an M2-like to M1-like phenotype.28 30 Downregulation of these negative regulatory cells would likely reorganize the TME toward tumor-specific conditions and reactivate exhausted T cells via PD-1 blockade. This could partly explain the underlying mechanism of the synergistic effect between Met and anti-PD-1 Ab. By contrast, our results revealed intrinsic factors required for CD8T cell proliferation to tumors, revealing a Met-induced, glycolysis-dependent feedback loop comprising Nrf2, p62, and mTORC1. This loop synergized with the effects of anti-PD-1 Ab treatment to stimulate the proliferation of CD8TILs. Met-induced Nrf2 activation is dependent on both mtROS and glycolysis and is followed by the induction of autophagy and glutaminolysis, which activates mTORC1. Intriguingly, mTORC1-dependent phosphorylation of p62 (p-p62(S351)) seems to play a role in activation of Nrf2, similar to the mechanism found in cancer cells.20 Anti-PD-1 Ab treatment reactivates dysfunctional TCR signaling by activating PI3K-Akt,31 leading to elevated glycolysis. Met-dependent, Glut-1 elevation might therefore be further enhanced by anti-PD-1 Ab-dependent, PI3K/Akt activation. Consistent with this, Glut-1 levels in CD8TILs were highest after combination therapy (figure 1D). As the combination therapy induced greater elevation of glycolysis, this might result in stronger activation of Nrf2 and, therefore, greater elevations of p62, p-S6, Ki67, LC3B, and HO-1 than after treatment with either Met or anti-PD-1 Ab alone (figure 3D,E, and figure 4A,D). This may be related to a previous observation that, in cancer cells, Nrf2 redirects glucose and glutamine to anabolic pathways which cause cell proliferation.32
The combination therapy with Met and anti-PD-1 Ab was found to boost proliferation of IFN-γ-secreting CD8T cells in tumors, producing profound effects on the TME. IFN-γ responses of CD8TILs and CD8DCs were apparent because anti-IFN-γ Ab blocked elevation of IRF8 and IRF1, as determined by FACS analysis. IFN-γ also plays a role in the activation and expansion of DCs. IRF8 may play a role in the stimulation of selective autophagy in CD8TILs and CD8DCs, as it was previously shown to induce stress-induced autophagy in macrophages to clear Listeria monocytogenes.33 wPGSA revealed intense activation of IRF1, IRF 2, and IRF8, in addition to STAT1 and STAT2 pathways in tumor cells from mice treated with combination therapy, suggesting that tumor cells strongly responded to IFN-γ that had been secreted from T cells. Defects of IFNγR signaling in tumor cells are known to result in resistance to anti-CTLA4 therapy.34 IFNγR signaling has been implicated as an inducer of cell cycle inhibition and apoptosis in tumor cells.14 35 36 IFN-γ-induced apoptosis induction in tumor cells may result in tumor antigen release, which helps DCs-mediated priming of naïve CD8T cells in dLNs.37 Indeed, combination therapy promoted the elevation of Glut-1, p-S6, and Ki67 levels in CD8TILs of B16-fucci-bearing, but not B16-fucci δIC-bearing mice (figure 6F,G). This suggests that the priming and activation of CD8TILs are linked with the metabolic profile of tumor cells. IFN-γ downregulated both Extracellular Acidification Rate (ECAR) and Oxygen Consumption Rate (OCR) in B16-fucci but not B16-fucci δIC tumor cells in vitro. The metabolic downregulation in tumor cells might result in elevated glucose concentrations in tumors (figure 6H1,J), helping CD8TILs to fight against cancers.
In addition, the downregulation of glycolysis in tumor cells has profound implications for tumor immunity. Consuming large amounts of glucose allows tumor cells to grow rapidly and dominate CD8TILs by exhausting glucose levels38 and lowering the oxygen concentration.39 Lactate is a glucose-derived metabolite secreted from tumor cells and decreases the TME pH, suppressing T-cell function.40 Moreover, lactate is returned to tumor cells, via monocarboxylate transporter 1, and fuels the TCA cycle, which stimulates the respiratory chain.41 Thus, OxPhos, in mitochondria, may promote metastasis to distant organs.42 43 In this context, IFN-γ-induced downregulation of glycolysis might be important in preventing the spread of tumor cells and invasion. In addition, some tumors rely heavily on OxPhos, and inhibiting OxPhos is a target of anticancer therapy.44 OxPhos inhibitors, including biguanides, have been highlighted as candidates for treating these tumors.45–47 Analogously, IFN-γ-induced downregulation of OxPhos might contribute to the prevention of tumor metastasis.
Dietary supplementation of glucose significantly enhanced the antitumor effect of Met or combination therapy with Met and anti-PD-1 Ab. However, the same supplementation of glucose did not synergize with the antitumor effects of anti-PD-1 Ab treatment alone. CD8TILs derived from mice who were administered Met or anti-PD-1 Ab expressed comparable levels of Glut-1 on the cell surface following exposure to glucose in vitro (figure 1D), indicating that CD8TILs from mice receiving either treatment showed nearly equal capacity and/or sensitivity in terms of their response to glucose. Therefore, differential glucose concentrations in tumor tissues from mice receiving Met or anti-PD-1 Ab may instead account for the distinct antitumor effects. Indeed, glucose levels in the tumor were significantly higher in the Met group than in the anti-PD-1 Ab treatment group with glucose supplementation. Met is known to contribute to normalization of tumor vessels.48 Therefore, it is possible that protective effects on tumor vessels via Met treatment may alter the glucose concentration in the TME. Met is known to protect the blood–brain barrier at the cerebrovascular level via Nrf2 activation.49 The Nrf2 pathway also contributes to the construction of airway epithelial barrier integrity in response to corticosteroid inhalation.50 Therefore, future studies focusing on the link between tumor vessels and Nrf2 activation will be important to elucidate the mechanisms of Met-dependent antitumor immunity.
Conclusions
The present study demonstrates that Met-induced antitumor immunity is reliant on mtROS, which stimulates both glycolysis and Nrf2. Nrf2 activates mTORC1 via the induction of selective autophagy and glutaminolysis. mTORC1 further activates Nrf2 via p-p62(S351), creating a feedback loop that ensures CD8TILs’ proliferation in synergy with anti-PD-1 Ab treatment. IFN-γ production helps reorganize the TME toward conditions that promote sustained antitumor immunity. Reducing amounts of mtROS produced by the subtle inhibition of OxPhos by Met and the resulting effects on Nrf2 activation may therefore be involved not only in tumor immunity but also in the actions of Met in various disease contexts.
Data availability statement
Data are available upon reasonable request. All data relevant to the study are included in the article or uploaded as supplementary information.
Ethics statements
Acknowledgments
We thank Koji Hase, Yusuke Ohba, Toshifumi Matsuyama, and Keiji Tanaka for their critical discussion and technical consultation. We also thank Ono Pharmaceutical Co. for providing us with the anti-PD-1 Ab (clone 4H2).
References
Supplementary materials
Supplementary Data
This web only file has been produced by the BMJ Publishing Group from an electronic file supplied by the author(s) and has not been edited for content.
Footnotes
Contributors MN designed and performed the experiments. NY and EW contributed to the generation of conditional knockout mice and their maintenance. TOg and KS performed RNA sequencing. KeK and EK analyzed the RNA-sequencing data. TOh and MK produced the inhibitor, K67. HM and KKa produced B16 fucci and B16 fucci δIC. HU supervised the project, designed the experiments, and wrote the paper.
Funding This study was supported by grants to HU from JSPS KAKENHI (grant numbers 18H04033 and 17K19598) and the Secom Science and Technology Foundation.
Disclaimer The content is solely the responsibility of the authors.
Competing interests There is no competing interest.
Provenance and peer review Not commissioned; externally peer reviewed.
Supplemental material This content has been supplied by the author(s). It has not been vetted by BMJ Publishing Group Limited (BMJ) and may not have been peer-reviewed. Any opinions or recommendations discussed are solely those of the author(s) and are not endorsed by BMJ. BMJ disclaims all liability and responsibility arising from any reliance placed on the content. Where the content includes any translated material, BMJ does not warrant the accuracy and reliability of the translations (including but not limited to local regulations, clinical guidelines, terminology, drug names and drug dosages), and is not responsible for any error and/or omissions arising from translation and adaptation or otherwise.