Article Text

Abstract
Background A major current challenge is to exploit tertiary lymphoid structures (TLSs) to promote the lymphocyte infiltration, activation and differentiation by tumor antigens to increase antitumor immune responses. The mechanisms that underlie the role of TLS formation in the adaptive immune responses against nasopharyngeal carcinoma (NPC) remain largely unknown.
Methods Cell populations and the corresponding markers were identified by single-cell RNA sequencing and fluorescence-activated cell sorting analysis. In vitro differentiation experiments were used to simulate the generation, regulation and function of the Th-CXCL13 cell subset in the tumor microenvironment of NPC. These were followed by histological evaluation of the colocalization of tumor-associated B cells (TABs) and Th-CXCL13 cells within TLSs, and statistical analysis of the relationship between the cells in TLSs and overall survival.
Results A PD-1+CXCR5−CD4+ Th-CXCL13 cell subset was identified in NPC. This subset was a major source of CXCL13, representing the majority of the CD4+ T cells at levels comparable with Th1 and Tfh cells present in the TLSs. Monocytes activated by toll-like receptor 4 agonists served as the antigen-presenting cells that most efficiently triggered the expansion of Th-CXCL13 cells. Transforming growth factor beta 1 (TGF-β1) stimulation and activation of Sox4 were critical for the induction and polarization of Th-CXCL13 cells in this process. The potential functional contributions of TABs recruited by Th-CXCL13 cells which induced plasma cell differentiation and immunoglobulin production via interleukin-21 and CD84 interactions in the TLSs demonstrated improved survival.
Conclusions Induction of Th-CXCL13 cells links innate inflammation to immune privilege in tumor-associated TLSs and might predict better survival.
- head and neck neoplasms
- adaptive immunity
- tumor microenvironment
- lymphocytes
- tumor-infiltrating
- immunity
- cellular
Data availability statement
All data relevant to the study are included in the article or uploaded as supplementary information.
This is an open access article distributed in accordance with the Creative Commons Attribution Non Commercial (CC BY-NC 4.0) license, which permits others to distribute, remix, adapt, build upon this work non-commercially, and license their derivative works on different terms, provided the original work is properly cited, appropriate credit is given, any changes made indicated, and the use is non-commercial. See http://creativecommons.org/licenses/by-nc/4.0/.
Statistics from Altmetric.com
- head and neck neoplasms
- adaptive immunity
- tumor microenvironment
- lymphocytes
- tumor-infiltrating
- immunity
- cellular
Background
Tumors are associated with a complex immune microenvironment characterized by the aggregation and distribution of many immune cell populations, reflecting the ability of the local immune system to perceive tumor cells.1 The immune setting within the locoregional tumor microenvironment (TME) significantly influences the fate of the tumor.2 Tumor-infiltrating immune cell populations include cell subsets belonging to both the innate and adaptive arms of the immune system.3 Many studies have described the existence of naturally occurring T-cell and B-cell responses to tumor-specific antigens or other innate immune responses in some tumors.4 5 Responsive tumors harbor significantly more predicted neoantigens and exhibit evidence of a coordinated immune response by T cells, B cells and antigen-presenting cells (APCs).6 Strong lymphocyte infiltration has been reported to be associated with good clinical outcomes in different human tumors. The intratumoral activation of T-cell responses may result in the control of tumor growth in some cancers.7 8 It is clear that the presence of tumor-infiltrating lymphocytes (TILs) is an important biomarker of inflammation that can predict responses to different forms of immunotherapy.9 In addition to T cells, the adaptive immune system mainly consists of B-cell populations. The protective role of T cells in the TME often depends on cooperation with B cells, and there is a growing appreciation of the roles played by T and B cells in the TME, which may influence immune responses and therapeutic efficacy.
Tumor-infiltrating B cells have been identified, but their overall functional roles and regulatory mechanisms in cancer are incompletely understood.10 B cells and plasma cells can support antitumor immune responses through several mechanisms.11 In addition to traditional immunological mechanisms of B cells, recent studies revealed that B cells can concentrate at the edge of the tumor or form various complex tumor-associated immune aggregates in cases where chronic inflammatory conditions parallel tumor development. These aggregates range from small unorganized clusters to coordinated infiltration by different immune cell subsets and are frequently associated with tertiary lymphoid structure (TLSs) or ectopic forms of lymphoid tissues which support the further maturation and isotype switching of tumor-specific B cells as well as the development of tumor-specific T-cell responses.12 13
CXCL13, originally identified as a B-cell chemoattractant, plays important roles in inflammatory diseases and different cancers.14 Studies suggest that CXCL13 and its receptor CXCR5 play fundamental roles in inflammation, infectious diseases and cancers.15 B cells localized in so-called ectopic lymphoid tissues or TLSs, which have been identified in several types of cancers, are associated with favorable clinical outcomes, regardless of the approaches used to quantify the TLSs and the stages of the diseases.16–19 In particular, neoantigen-specific interactions between T and B cells in the TLSs and in less organized clusters of TILs seem to be crucial.20 These observations highlight the importance of coordinated immune responses, including the formation of TLSs and their roles in antitumor immunity.
In this study, we identified a PD-1+CXCR5−CD4+Th-CXCL13 cell subset with B-cell helper function in TLSs of human nasopharyngeal carcinoma (NPC). To better understand the mechanisms by which such T and B cells in the TLSs work together to mediate antitumor immunity, we investigated the colocalization patterns, phenotypes and gene expression profiles of tumor-associated T-lineage and B-lineage cells in NPC.
Materials and methods
Tumor sample collection and cell preparation
Fresh tumor biopsies and paired peripheral blood samples were retrieved from patients with NPC, while normal tissues (non-neoplastic nasopharyngeal tissues) and paired peripheral blood samples were obtained from patients without cancer from the Sun Yet-Sen Memorial Hospital as controls. Mononuclear cells were isolated from the blood and tissues as described previously.21 Peripheral blood mononuclear cells (PBMCs) were isolated using Ficoll density gradient centrifugation. Fresh tumors were obtained and transferred into 1.5 mL tubes with RPMI1640 on ice at the time of resection. The biopsy tissues were mechanically dissociated into small pieces and then transferred into a culture dish containing 2 mL RPMI1640 with 50 µg/mL Liberase TM Research Grade (Roche) and 5 U/µL DNase I (Sigma), and incubated for 15 min at 37°C in a shaker incubator. Large clumps and cell debris were disrupted and filtered through a 40 µm cell strainer (Falcon, Durham, North Carolina, USA). Finally, the single-cell suspension containing TILs was resuspended in RPMI1640 supplemented with 10% fetal bovine serum (FBS) and used for subsequent experiments.
Processing of RNA-Seq data (10× Genomics)
Processing of 10× Genomics RNA-seq data was conducted according to the related research established in our laboratory.22 We conducted 3′ droplet-based single-cell RNA sequencing (scRNA-seq) (10× Genomics) on 102 525 cells from 17 EBV+ NPC and 7 non-cancerous nasopharyngeal samples (normal tissues).
RNA extraction and quantitative reverse transcription PCR (RT-qPCR)
The RNA extraction and RT-qPCR were performed according to the manufacturer’s instructions. The specific primers used to amplify the genes are listed in online supplemental table 1. The expression levels of the target genes were normalized to the ACTB gene. Total RNA was isolated from the samples using TRIzol reagent (Invitrogen). For expression analyses of the target genes and the non-target housekeeping control gene, 2 µg of RNA was reverse-transcribed using the GoScript Reverse Transcription System (Promega) in a 20 µL reaction mixture. The mRNA level was evaluated by RT-qPCR using the SYBR Green I Master Mix (Roche) and analyzed on a Roche Light Cycler 480.
Supplemental material
Tissue homogenate
The fresh NPC tumor samples were cut into pieces and 10% (w/v) tumor homogenates were prepared in RPMI1640 using a tissue homogenizer (Bertin Precellys) according to the manufacturer’s instructions. The homogenization and extraction were carried out in 2.0 mL tissue lysis tubes containing RPMI1640 buffer. Samples were agitated at 9000 rpm for 30 s, twice, and were maintained at 4°C. Following centrifugation at 14 000 g and at 4°C for 10 min, the supernatants were collected for detection of cytokines.
Flow cytometry analysis
The detection of surface markers, intracellular cytokines and transcriptional factors was performed as described previously.23 In vitro stimulation of 1×10⁶ TILs with anti-CD3/CD28 beads (beads to cells=1:1, eBioscience) or staphylococcal enterotoxin B (SEB) (100 ng/mL, Sigma) for 6 hours at 37°C in 100 µL of RPMI1640 medium with 10% FBS containing 5 μg/mL brefeldin A (BFA, BD Biosciences). For surface markers staining, cells were washed twice with phosphate buffered saline (PBS) and incubated with the respective monoclonal antibodies (mAbs) at 4°C for 30 min. For staining of intracellular cytokines and transcription factors, the incubated cells were collected and fixed for 10 min followed by permeabilization with eBioscience Intracellular Fixation & Permeabilization Buffer (Thermo Fisher). The permeabilized cells were then incubated with the respective mAbs at 4°C for 30 min. After staining, the cells were washed twice with PBS. Cell viability was evaluated using 7-Aminoactinomycin D (7-AAD), which can be used for the exclusion of non-viable cells in flow cytometric assays. Flow cytometry was performed on a CytoFLEX S (Beckman), and the data were analyzed using FlowJo software (TreeStar, San Carlos, California, USA). The antibodies used for flow cytometry analysis are listed in online supplemental table 2. Baseline characteristics of patients with NPC for fluorescence-activated cell sorting (FACS) analysis are listed in online supplemental table 3.
Immunohistochemistry (IHC) and multiplex immunohistochemical (MIHC) staining
A retrospective study was performed on formalin-fixed, paraffin-embedded (FFPE) tumor tissues of NPC. MIHC staining was performed as described previously.24 Briefly, 4 µm sections from full FFPE blocks of tumor tissues were sectioned, dewaxed, and fixed with 10% neutralized formaldehyde. Then, antigen was retrieved using heated citrate buffer (pH 6.0) and/or Tris-EDTA buffer (pH 8.0) for 15 min. Each section was subjected to four to seven successive rounds of antibody staining after the initial establishment of staining conditions for each individual primary antibody and successive optimization. Each staining step consisted of blocking with 20% normal goat serum/fetal bovine serum in PBS and incubation with primary Abs, followed by biotinylated anti-mouse/anti-rabbit/anti-goat secondary antibodies and streptavidin–horseradish peroxidase (HRP) substrate. Then, the immunoreactive stains were visualized using tyramide signal amplification (TSA) with fluorophores Opal 520, 560, 620, 650 and 690 diluted in 1×Plus Amplification Diluent. Finally, the Ab–TSA complexes were stripped in heated citrate buffer (pH 6.0) and/or Tris-EDTA buffer (pH 8.0) for 15 min. Nuclei were counterstained with 4’, 6-diamidino-2-phenylindole, dihydrochloride (DAPI) and sections were mounted using PermaFluor fluorescence mounting medium (PANOVUE). The same procedure without primary antibodies was used as a negative control. The IHC staining results were scored based on two criteria: (1) the proportion of positive cell staining: 0 (none), 1 (1% to 10%), 2 (11% to 50%), 3 (51% to 75%), and 4 (76% to 100%); and (2) the average intensity of the positive cells: 0 (none), 1 (weak), 2 (moderate) and 3 (strong). The proportion and intensity scores were then multiplied to obtain a total score (ranging from 0 to 12). All patients were divided into two groups according to the median total score. The MIHC staining results were scored based on the percentage of the number of cell subsets. Using MIHC staining for PD-1, CXCR5, and CD4+ in NPC tissue, four cell subsets (CD4+PD-1+CXCR5+ Tfh, CD4+PD-1+CXCR5− Th-CXCL13, CD4+PD-1−CXCR5+ and CD4+PD-1−CXCR5−) were identified using Halo analysis software. Computer recognition software used indicated molecules to identify subsets of cells automatically and count them (online supplemental figure 5). All patients were divided into two groups according to the median total percentage. Cumulative survival time was calculated and measured in months from the last review. The log-rank test was applied to compare the groups. The antibodies used for IHC staining are listed in online supplemental table 2. Cell quantification was performed across whole tumor sections using Halo analysis software (PANOVU). Information for all paraffin sections of NPC tumors that were used for retrospective study is listed in online supplemental tables 4 and 5. A scoring example representing the 0–4 score for infiltrating immune cell positivity and 0–3 for intensity is shown in online supplemental figure 1.
In vitro culture system for monocytes (MOs), dendritic cells (DCs) and macrophages (Mφ)
The in vitro culture of monocytes (MOs), dendritic cells (DCs) and macrophages (Mφ) was performed as described previously.25 Briefly, MOs were purified from healthy PBMCs or TILs using anti-CD14 magnetic beads (Miltenyi Biotec) according to the manufacturer’s instructions. To induce the differentiation of DCs, the MOs were cultured for 6 days in RPMI1640 medium containing 10% FBS supplemented with granulocyte-macrophage colony stimulating factor (GM-CSF; 800 U/mL) and interleukin (IL)-4 (400 U/mL) (R&D), and half of the culture medium was replaced on days 3 and 5. DCs were identified by FACS analysis of CD1a, CD14 and CD11c expression (online supplemental figure 1C). To obtain Mφ, the MOs were cultured for 6 days in RPMI1640 medium containing 10% FBS supplemented with GM-CSF (800 U/mL). Mφ were identified by FACS analysis of CD68, CD11b, CD163, CD206, CD115 and CD14 expression, with high expression of MHC-II and CD86 (online supplemental figure 1D). The MOs were cultured for 18 hours in RPMI1640 medium with 10% FBS in the presence or absence of lipopolysaccharide (LPS; 5 µg/mL, Sigma-Aldrich). These MO-derived DCs and Mφ were sensitized with interferon gamma (IFN-γ;10 ng/mL, PeproTech) and then left untreated or treated with LPS (5 µg/mL) for 18 hours. Supernatants were collected for cytokine detection by ELISA and cells were collected for analysis of target gene expression by RT-qPCR.
ELISA
The concentrations of the indicated cytokines in the culture supernatants were measured using ELISA kits according to the manufacturer’s instructions. The kit for CXCL13 was from Telenbiotech, the kits for IFN-γ, IL-2, IL-4, IL-17A, IL-10, IL-21, IL-1β, IL-6, tumor necrosis factor alpha (TNF-α) and IL-12p70 were from eBioscience, and the kit for transforming growth factor beta 1 (TGF-β1) was from BD Pharmingen.
In vitro T-cell culture system
Cell differentiation experiments were performed as described previously.21 Human naïve CD4+ T cells were isolated using the naive CD4+ T Cell Isolation Kit II, human (Miltenyi Biotec) according to the manufacturer’s instructions. Purified cells (2.5×10⁵) were cultured at 37°C in a humidified atmosphere comprising 5% CO2. Differentiation was induced for 8 days using iscove's modified dulbecco's medium (IMDM) containing 10% FBS supplemented with 100 units/mL penicillin and streptomycin (Thermo Fisher) under stimulation with anti-CD3/CD28 beads (beads to cells=1:1, eBioscience) in the presence of 2 ng/mL of the indicated cytokines (all from PeproTech) with or without neutralizing antibody against IL-2 (R&D). Alternatively, the cells were exposed to medium supplemented with 2 ng/mL of the indicated cytokines alone and/or in combination. Alternatively, purified CD4+ T cells, naïve CD4+ T cells or memory CD4+ T cells from PBMCs or TILs were incubated for 8 days, stained with 5,6- carboxyfluorescein diacetate, succinimidyl ester (CFSE; CST), and cultured with autologous APCs treated or untreated with LPS (5 µg/mL, Sigma), or with tumor-derived MOs (5:1). Where indicated, autologous T cells were exposed to the indicated cells (5:1) and then treated with neutralizing Abs against 10 µg/mL of the indicated cytokines or a control IgG (R&D). Alternatively, autologous T cells were exposed to the indicated cells (5:1) and then treated with neutralizing Abs against TGF-β1 (10 µg/mL) and IL-2 alone and/or combination. Additionally, 2.5×10⁵ purified naïve CD4+ T cells or CD4+ TILs were stained with CFSE and cultured with anti-CD3/CD28 beads (beads to cells=1:1) in the presence of 2 ng/mL TGF-β1 with or without siRNA against Sox4 (RIBBIO, online supplemental table 2) according to the manufacturer’s instructions.
Cell sorting, cytokine and chemokine analysis
The CD4+PD-1+CXCR5− T cells (Th-CXCL13) were sorted from TILs using a MoFlo Astrios (Beckman) system under sterile operation and rested for 12 hours in RPMI1640 medium with 10% FBS. Then, 5×10⁴ CD4+PD-1+CXCR5− TILs were stimulated with anti-CD3/CD28 beads (beads to cells=1:1) or left untreated for 12 hours, and supernatants were collected for cytokine and chemokine analysis using the LEGENDplex HU Th cytokine panel (12-plex) w/VbP V02 (BioLegend, no. 741028) in which the threshold is 2.4–2500 pg/mL; LEGENDplex HU Proinflam chemokine panel 1 (13-plex) w/FP (BioLegend, no. 740984) in which the threshold is 2.4–2500 pg/mL, and BLC (CXCL13) Human ProcartaPlex Simplex Kit Invitrogen (Invitrogen, no. EPX01A-12 147–901) in which the threshold is 6.3–25,800 pg/mL according to the manufacturer’s instructions.
Cell sorting and chemotaxis assay
Six cell subsets, including CXCR5+CD19+ B, CXCR5+CD4+ T, CXCR5+CD8+ T, CXCR5−CD4+ T, CXCR5−CD8+ T and CXCR5−CD19+ B cells were sorted from NPC-derived PBMCs using a MoFlo Astrios (Beckman) instrument under sterile operation. The chemotaxis assay was done according to the manufacturer’s instructions of the chemotaxis kit (Corning) and published literature.26 27 The cells were rested for 12 hours in RPMI1640 medium with 10% FBS supplemented with 2 mM L-glutamine and 100 ng/mL penicillin/streptomycin. Chemotaxis assays were carried out using 48-well transwell plates with 5 µm pores (Corning), according to the manufacturer’s instructions. Each upper well was seeded with 5×10⁴ cells in 100 µL medium. The bottom wells contained 235 µL PBS with or without 5 µg/mL recombinant human CXCL13 (R&D). After 3 hours, 50 µL Precision Count Beads (BioLegend) were added and transmigrated cells were counted by flow cytometry. Cell numbers were calculated using the following formula: absolute cell count=cell count/bead count×total bead concentration. The chemotactic index was calculated as the ratio of transmigrated CXCR5+ cells to transmigrated CXCR5− control cells. The chemotaxis index of CXCR5− subsets was set as ‘1’.
Western blot analysis
Western blot analysis was performed as described previously.21 Briefly, the treated cells were collected, lysed in RIPA buffer and incubated on a rocker at 4°C for 15 min. The protein concentration of the lysates was measured using a bicinchoninic acid (BCA) protein assay kit (Pierce) and normalized to equal amounts of protein. The protein bands were separated by 12% polyacrylamide SDS-PAGE, transferred to a PVDF membrane, and probed with the indicated primary antibodies. Then, the blots were incubated with species-specific HRP-conjugated secondary antibodies. The immunoreactive bands were visualized by enhanced chemiluminescence (ECL, Pierce). The same membranes were then stripped and reprobed with mouse monoclonal antibodies against β-actin to confirm equal loading of the samples. The specific primary antibodies and HRP-conjugated secondary antibodies are listed in online supplemental table 2.
Ex vivo T-cell expansion and tumor reactivity assays
T-cell expansion and tumor reactivity assays were performed as described previously.28 Half of the cell suspension from each tumor was used to obtain Epcam+ tumor cells and CD19+ B cells. Tumor suspensions were thawed and incubated in RPMI1640 medium with 10% FBS containing 100 ng/mL penicillin/streptomycin, and 250 U/mL benzonase for 45–60 min. The other half of these cells was expanded by culturing with tumor suspensions in RPMI1640 medium with 10% FBS containing 100 ng/mL penicillin/streptomycin and 1000 IU/mL IL-2 for 2 weeks. Subsequently, TILs were further expanded in RPMI1640 medium with 10% FBS containing 100 ng/mL penicillin/streptomycin, 1000 IU/mL IL-2 and 2 ng/mL anti-CD3 for an additional 2 weeks. Fresh medium with IL-2 was added every 3 days. Purified CD4+ T cells were isolated from these expanded TILs using CD4+ microbeads (Miltenyi Biotec), thawed and rested in RPMI1640 medium with 10% FBS containing 100 ng/mL penicillin/streptomycin and 60 IU/mL IL-2. CD4+ T cells were cocultured with LPS (5 µg/mL)-activated autologous B cells at a ratio of 1:1 and tumor suspensions in 100 µL of RPMI1640 medium with 10% FBS containing 5 µg/mL BFA (BD Biosciences), followed by 24 hours of incubation. Tumor-specific TCRVβs were assessed as described previously.21 Cells were then stained with antibodies for FACS analysis and supernatants were collected for cytokine detection. The incubated cells were collected, washed with PBS, fixed with 4% paraformaldehyde and permeabilized with 0.1% saponin overnight at 4°C. The cells were stained with the indicated mAbs and the IOTest Beta Mark TCR Vβ repertoire kit (Beckman Coulter, Brea, California, USA) at 4°C for 30 min. After washing, the prepared cell samples were analyzed using a CytoFLEX S instrument (Beckman), and the data were analyzed using FlowJo software (TreeStar).
T-B cell cocultures
CD27+ memory B cells and four CD4+ T-cell subpopulations (PD-1+CXCR5+, PD-1+CXCR5−, PD-1-CXCR5+ and PD-1−CXCR5−) were sorted using FACS instrument (Beckman). The sorted cells (5×10⁴/well) were coincubated with LPS (5 µg/mL)-activated B cells (2×10⁵/well) and tumor suspensions for 30 min at 37°C in 96-well U-bottom plates, with or without neutralizing anti-CD150, anti-CD84 or anti-CD352 antibodies (10 µg/mL; BioLegend). Conjugate frequencies were enumerated by FACS after the cell mixtures were stained with the indicated mAbs for 30 min at 4°C. The four sorted CD4+ T cell populations were co-cultured with LPS (5 µg/mL)-activated autologous memory B cells at a ratio of 1:1 and tumor suspensions in 100 µL of RPMI1640 medium with 10% FBS for 10 days. For blocking experiments, 10 µg/mL of anti-CXCL13 or anti-IL-21 antibodies (R&D Systems), as well as 10 µg/mL anti-CD84 or anti-352 antibodies (BioLegend), were used. Supernatants were collected for detection of total IgG, IgA and IgM by ELISA (eBioscience), and cells were harvested and analyzed by FACS.
Statistical analyses
All statistical tests were performed using GraphPad Prism V.8 (GraphPad Software, San Diego, California, USA). The statistical significance of differences was assessed using unpaired Student’s t-test when comparing two groups, one-way analysis of variance (ANOVA) for more than two groups, or two-way ANOVA for two variables. Data are presented as means±SD (****p<0.0001, ***p<0.001, **p<0.01, *p<0.05; NS, not significant; p>0.05).
Results
PD-1+CXCR5−CD4+ Th-CXCL13 cell subpopulation in the TLSs of NPC
To study the differences between NPC tumors and normal tissues to identify new CD4+ Th cell subsets, we reanalyzed our recently published scRNA-seq data (10× Genomics) from NPC tumors and normal tissues.22 Interestingly, tumor-derived CD4+ T cells showed higher levels of CXCL13, IFN-γ and other immune regulators, which indicated greater activation and stronger immune responses in the TME compared with normal tissue (figure 1A). IHC confirmed the significantly higher CXCL13 expression in the TLS-like ectopic lymphoid tissues of tumors (figure 1B), which indicated that this CXCL13-expressing cell subsets surrounded the B-cell area in the TLSs. Furthermore, there were CD20+ B-cell clusters in the tumor-associated samples, and such clusters consisted of both Ki67+ and Ki67– B cells, which suggested activation and proliferation. Notably, architectural analysis showed that these CD20+ B-cell clusters were localized in the local TME and were mainly colocalized with CD4+ T cells, which indicated the formation of mature TLSs (figure 1C). We conducted 3′ droplet-based scRNA-seq (10× Genomics) on 102,525 cells from 17 EBV+ NPC and seven non-cancerous nasopharyngeal samples (normal tissues). Crucially, clustering analysis identified a CD4+ Th-CXCL13 cell subset different from other lymphocyte subsets in the tumor, and this subset was not present in normal tissue (figure 1D). Transcriptome analysis revealed that the CXCL13 was one of the most highly upregulated genes in CD4+ T cells with PDCD1high and CXCR5low gene expression (figure 1E). Thus, we defined the phenotype of such CD4+ Th-CXCL13 cells as PD-1+CXCR5−CD4+ T cells. CXCL13 exclusively binds to the chemokine receptor CXCR5, which is expressed on T, B and other cells. Notably, compared with normal tissues, CXCL13+CXCR5−CD4+ T cells in tumor tissues interact closely with other cell subsets, which may result in the formation of tumor-associated TLSs in TME (figure 1F). Indeed, we identified a Th-CXCL13 cell subpopulation in the TLSs of NPC.

A PD-1+CXCR5−CD4+ Th-CXCL13 cell subpopulation in the TLSs of NPC tumors. (A) Volcano plot showing degS in tumor-derived CD4+ T cells in comparison with CD4+ T cells from normal tissue. Representative genes are labeled. (B) IHC staining of representative tumor and normal tissue sections showing CXCL13+ expression in the TLS-like structures. (C) MIHC staining of a representative tumor section showing the coexpression of CD4+ (green), CD20+ (magenta), CXCL13+ (red) and Ki67+ (yellow) in the TLS, with nuclei counterstained with DAPI (blue). (D) t-SNE plot showing different cell clusters of all single cells from 10× Genomics analysis of scRNA sequences. (E) Identification of the cell markers of the CD4+ Th-CXCL13 cell subpopulation in the tumor. (F) Cell-Talker was used to identify putative interactions between the CD4+ Th-CXCL13 cell subpopulation and other cell subsets in the tumors and normal tissue. (G) Representative dot plots showing CXCL13, IFN-γ, IL-21 and IL-10 expressions in CD4+ TILs from tumors and eight identified cell subsets, including Th0 (IFN-γ−IL-21−CXCL13−), Th1 (IFN-γ+IL-21−CXCL13−), Tfh (IFN-γ−IL-21+CXCL13−), Th-CXCL13 (IFN-γ−IL-21−CXCL13+), Th1/Tfh (IFN-γ+IL-21+CXCL13−), Th1/Th-CXCL13 (IFN-γ+IL-21−CXCL13+), Tfh/Th-CXCL13 (IFN-γ−IL-21+CXCL13+) and Th1/Tfh/Th-CXCL13 (IFN-γ+IL-21+CXCL13+). (H) Statistical analysis showing the coexpression of IFN-γ, IL-21 and/or IL-10 in CD4+CXCL13+ T cells from TILs and PBMCs (n=12). (I) Representative dot plots and statistical analysis showing the expression of IFN-γ and IL-21 in IL-10−CD4+CXCL13+ T cells from TILs and PBMCs (n=12). Data were expressed as the means±SD, and paired two-tailed Student t-test. (J) IHC staining of a representative tumor section showing the coexpression of IFN-γ, CXCL13 and IL-21 in the TLS. (K) FACS analysis and heat map showing the phenotypical characteristics of the identified Th0, Th1, Tfh, Th-CXCL13, Th1/Tfh, Th1/Th-CXCL13, Tfh/Th-CXCL13, and Th1/Tfh/Th-CXCL13 subsets of TILs and PBMCs (n=5). Data were expressed as the means. ***P<0.0001. FACS, fluorescence-activated cell sorting; IFN-γ, interferon gamma; IHC, immunohistochemistry; IL, interleukin; MIHC, multiplex immunohistochemical; N, normal tissue; NPC, nasopharyngeal carcinoma; PBMC, peripheral blood mononuclear cell; T, tumor; TIL, tumor-infiltrating lymphocyte; TLS, tertiary lymphoid structure; t-SNE, T-distribution neighborhood embedding algorithm; DEGs, differentially expressed genes.
To verify the presence of Th-CXCL13 cells in tumors by single-cell analysis, we performed flow analysis of CXCL13 and found that CXCL13 protein expression was enriched in CD3+ T but not in non-T cells (online supplemental figure 2A,B). The percentage of CXCL13+ T cells among TILs was significantly higher than among PBMCs (online supplemental figure 2C), and the vast majority of CXCL13+ TILs were CD4+ T cells, with very few CD8+ T cells (online supplemental figure 2D–F). MIHC further corroborated that CXCL13+ cells were principally CD4+ TILs in the follicle-like TLSs (online supplemental figure 2G). Following in vitro stimulation of TILs with or without anti-CD3/CD28 beads or SEB, both CD4+, as well as CXCL13-secreting CD4+ T cells acquired an activated (CD69 and HLA-DR), effector memory (CD45RO) and tissue resident memory phenotype (CD69 and CD103). Additionally, CXCL13+CD4+ TILs partly coexpressed cytokines and related molecules specific for Th1 (IFN-γ) and Tfh cells (IL-21, PD-1 and ICOS). However, the expression of regulatory T cells (Treg) cytokines and related molecules (IL-10 and CD25) was seldom detected in CXCL13+CD4+ TILs (online supplemental figure 2H–J). These data suggested that there was a PD-1+CXCR5−CD4+ Th-CXCL13 cell subset arising in the TLSs of NPC.
The Th-CXCL13 subset composition in TILs was combined with PBMCs based on their ability to secrete CXCL13, IFN-γ, IL-21, and/or IL-10 alone and in combination. As expected, the four IL-10-producing Th-CXCL13 subsets represented only a very small proportion of the total Th-CXCL13 cells (0.05%–0.23%), whereas four other IL-10− Th-CXCL13 subsets represented the vast majority and constituted nearly the entire Th-CXCL13 population. There were increased proportions of Th-CXCL13/Th1, Th-CXCL13/Tfh and Th-CXCL13/Tfh/Th1 from CD4+ T cells among TILs compared with PBMCs, suggesting the formation of multifunctional Th-CXCL13 cell subsets in the TME (figure 1G–I). MIHC confirmed that there were large numbers of cells expressed CXCL13, IFN-γ and IL-21 around the follicular TLSs (figure 1J). By contrast, there were incomplete and immature structures in normal tissue, with very low expression of PD-1, CXCL13, IFN-γ and IL-21, indicating low immune responses (online supplemental figure 3A). The phenotypical features of Th0, Th1, Tfh, Th-CXCL13, Th1/Tfh, Th1/Th-CXCL13, Tfh/Th-CXCL13 and Th1/Tfh/Th-CXCL13 cells isolated from TILs paired with PBMCs (n=5) showed that the Th-CXCL13, together with Th1, Tfh, and Th1/Tfh cells, had an effector memory phenotype. Both Th-CXCL13/Tfh/Th1 and Th-CXCL13/Tfh cells expressed higher levels of activation markers, as well as regulatory molecules, than did their subset counterparts. Furthermore, T-bet and Bcl-6 were widely expressed by Th1 and Tfh cells, respectively. The Th-CXCL13/Th1 cells expressed T-bet, while the Th-CXCL13/Tfh and Th-CXCL13/Tfh/Th1 subsets expressed Bcl-6 at a detectable level comparable to that exhibited by other subsets. However, none of the analyzed Th cell subsets expressed Foxp3 (figure 1K). These results suggested that the Th-CXCL13 cell type might be regulated by unknown differentiation conditions and transcription factors different from those regulating Th1 and Tfh cells.
PD-1+CXCR5−CD4+ Th-CXCL13 cells might be involved in the formation of TLSs in NPC
The sorted CD4+PD-1+CXCR5− TILs that have been cultivated for 12 hours in vitro not only expressed but also constitutively secreted detectable amounts of CXCL13, as well as IFN-γ, IL-21, and other cytokines and chemokines (figure 2A). The statistical analysis of the FACS results showed that the percentage of Th-CXCL13 cells was clearly correlated with PD-1+CXCR5−CD4+ TILs in the TME (figure 2B). IHC staining confirmed these results, showing that CXCL13+ cells were principally CD4+PD-1+ TILs in the follicle-like TLSs (figure 2C). Additionally, there was high expression of the CXCR5 chemokine receptor on CD4+ T and CD19+ B cells (figure 2D). Clearly, all CXCR5+ cell subsets showed increased chemotaxis toward CXCL13 compared with CXCR5− cells, with migration of CXCR5+CD4+ T cells and CXCR5+CD19+ B cells being the most pronounced (figure 2E). In the TME, Th-CXCL13 cells surrounded the central B cell area, and these cell subsets colocalized within the follicular TLSs (figure 2F), suggesting that the main function of Th-CXCL13 cells is the chemotactic attraction of B cells, which might be involved in the formation and maturation of follicle-like TLSs. Accordingly, large numbers of traditional Tfh cells (CD4+PD-1+ICOS+) were also detected in these follicle-like TLSs (online supplemental figure 4A,B), and these PD-1+ TILs partly coexpressed Bcl-6 (figure 2G). While, CD4+ Th-CXCL13 cells hardly expressed the Foxp3 in these TLS and non-TLS areas (online supplemental figure 4C,D). By contrast, there were incomplete and immature structures in normal tissue, with very low expression of PD-1, CXCL13 and CXCR5, indicating less infiltration of immune cells (online supplemental figure 3B).

PD-1+CXCR5−CD4+ Th-CXCL13 might be involved in the formation of TLSs associated with NPC tumors. (A) Expression of the indicated Th cytokines and chemokines in sorted PD-1+CXCR5−CD4+ Th-CXCL13 in tumor of NPC (n=4) after 12 hours of resting, measured using a bead-based immunoarray. (B) Statistical analysis showing the correlation between the percentages of PD-1+CXCR5−CD4+ TILs and Th-CXCL13 cells analyzed by FACS analysis in tumor of NPC (n=50). (C) MIHC staining of a representative tumor section showing the coexpression of CD4+ (orange), CXCL13+ (magenta) and PD-1+ (green), with nuclei counterstained with DAPI (blue). (D) The expression of CXCR5 on CD3+ T, CD4+ T, CD8+ T and CD19+ B cells among PBMCs of patients with NPC. The same experiment was repeated five times. (E) Migration of CXCR5+CD19+ B, CXCR5+CD4+ T, CXCR5+CD8+ T, CXCR5−CD19+ B, CXCR5−CD8+ T and CXCR5−CD4+ T cells from PBMCs (n=5) in response to recombinant human CXCL13. Chemotaxis abilities of CXCR5+ subset, compared with CXCR5− subset, were demonstrated, in which the chemotaxis index of CXCR5− subsets was set as ‘1’. (F) MIHC staining of a representative tumor section showing CD4+ (green), CXCL13+ (magenta), CD20+ (cyan), CXCR5+ (red), PD-1+ (yellow) and DAPI (blue). (G) MIHC staining of a representative tumor section showing PD-1+ (Red), Bcl-6+ (Green) and CD21+ (Orange), with nuclei counterstained with DAPI (blue). (H) Survival analysis of the cohort stratified by CD4+ cells, PD-1+ cells, CXCR5+ cells and CXCL13+ cells identified by IHC staining, which the threshold used to define high and low is 8, 3, 6, and 4, respectively. (I) Survival analysis of the cohort stratified by CD4+PD-1+CXCR5+, CD4+PD-1+CXCR5−, CD4+PD-1-CXCR5+ and CD4+PD-1−CXCR5− cells subsets among CD4+ TILs identified by MIHC staining and Halo analysis software, which the threshold used to define high and low is 0.997, 4.50, 32.1, and 42.5, respectively. FACS, fluorescence-activated cell sorting; IHC, immunohistochemistry; MIHC, multiplex immunohistochemical; NPC, nasopharyngeal carcinoma; PBMC, peripheral blood mononuclear cell; TIL, tumor-infiltrating lymphocyte; TLS, tertiary lymphoid structure.
IHC staining for PD-1 and CXCR5 was conducted in CD4+ TILs, and four cell subsets (PD-1+CXCR5+ Tfh, PD-1+CXCR5− Th-CXCL13, PD-1−CXCR5+ and PD-1−CXCR5−) were identified in the TLSs using Halo analysis software (figure 2H and online supplemental figure 5). Survival analysis revealed that CD4, PD-1, CXCR5 and CXCL13 were associated with improved survival outcomes (figure 2H). Tfh, Th-CXCL13 and PD-1−CXCR5+ cells were associated with improved patient outcomes, while PD-1−CXCR5− cells showed no statistical association with survival (figure 2I). This result suggested that the Th-CXCL13 cells had a chemotactic effect on T and B cells and might be involved in the formation of TLSs, possibly contributing to improved patient outcomes.
Activated APCS induced the differentiation and expansion of the PD-1+CXCR5−CD4+ Th-CXCL13 cell subset through TGF-β1 signaling
To investigate the association between the Th-CXCL13 cells and the inflammatory or proinflammatory environment, we differentiated naïve CD4+ T cells under induction with different cytokines in vitro. We found that TGF-β1 significantly induced the differentiation of CXCL13-producing CD4+ T cells (Th-CXCL13) that were highly positive for PD-1, and negative for CXCR5 and CXCR3. However, the other tested conditions did not induce the emergence of this subpopulation (figure 3A). There is limited expression of IL-2 in local tumor sites because of low IL-2 production by resident or infiltrating cells and IL-2 consumption by Treg or tumor cells. We added an IL-2-neutralizing antibody into the differentiation mixtures in vitro, which resulted in a significant upregulation of Th-CXCL13 cells (figure 3A). At the same time, CXCL13 was also detected in the culture supernatant (online supplemental figure 6A). TGF-β1 induction with or without other proinflammatory cytokines (IL-12, TNF-α, IL-6 and IL-1β) could also significantly enhance CXCL13 expression (figure 3B). However, only Th1-, Th2-, Th9-, Th17-, Tfh-, Th22- and Treg-polarizing conditions did not induce CXCL13 expression, either alone or in combination. Notably, CXCL13 was significantly expressed and was positively correlated with TGF-β1 expression in both the tumor tissue homogenates and sera of patients with NPC (online supplemental figure 7A,B). Survival analysis revealed that high CXCL13 expression in the serum was associated with better survival outcomes (online supplemental figure 7C). CXCL13 secretion was induced in sorted PD-1+CXCR5−CD4+ TILs by TCR stimulation in the presence of TGF-β1 in a dose-dependent manner (online supplemental figure 7D) and was inhibited by coincubation with the TGF-β1 inhibitor SB431542 (figure 3C), proving that autocrine TGF-β1 signaling is required for the induction of Th-CXCL13 cells. These results suggested that TGF-β1 might be a necessary factor in the local inflamed tumor sites to initiate the differentiation of Th-CXCL13 cells.

Activated APCS induced the differentiation and expansion of the PD-1+CXCR5−CD4+ Th-CXCL13 cell subset through TGF-β1. (A) Representative dot plots showing PD-1+CXCR5−CD4+ Th-CXCL13 cells in vitro (n=5). (B) Representative dot plots showing that TGF-β1 with or without other indicated cytokines gave rise to CXCL13-producing PD-1+CD4+ Th cells in vitro (n=5). (C) Secretion of CXCL13 by sorted PD-1+CXCR5−D4+ TILs (n=4) after stimulation for 8 days using anti-CD3/CD28, TGF-β1 (10 ng/mL) and/or TGF-β1 receptor inhibitor SB431542 (10 µM/mL). (D,E) The mRNA expression of the indicated cytokines was determined by RT-qPCR and the cytokine protein in supernatants was determined by ELISA (n=5). (F,G) MOs, DCs and Mφ were left untreated or stimulated with LPS for 5 hours and then cultured for 8 days with autologous T cells, naïve T cells and memory T cells from healthy donors (n=3). Proliferation (CFSE−) and expression of CXCL13+ cells were detected by FACS. (H) Representative dot plots showing that blocking of TGF-β1, IL-1β, IL-6, TNF-α and IL-12 changed the subset composition of Th-CXCL13 cells expanded by LPS-stimulated mos from healthy donors (n=3). (I) Representative dot plots and statistical analysis showing of the expression of the indicated markers on MOs from tumors and blood (n=5). (J) Representative dot plots showing that the addition of anti-TGF-β1 and/or IL-2 or TGF-β1 and/or anti-IL-2 changed the subset composition of Th-CXCL13 cells expanded by LPS-stimulated tumor-derived MOs (n=3). Data were expressed as the means±SD, and paired two-tailed Student t-test. *P<0.05, **P<0.001, ***P<0.0001. APC, antigen-presenting cell; DC, dendritic cell; FACS, fluorescence-activated cell sorting; IFN-γ, interferon gamma; Mφ, macrophage; MO, monocyte; RT-qPCR, quantitative reverse transcription PCR; TGF-β1, transforming growth factor beta 1; TIL, tumor-infiltrating lymphocyte; TLS, tertiary lymphoid structure; TNF-α, tumor necrosis factor alpha; MFI, mean fluorescence intensity.
Next, we wanted to elucidate the nature of the APCs and innate stimuli that trigger the expansion and differentiation of the Th-CXCL13 subsets, we first used freshly isolated MOs from the blood of healthy controls and cultured LPS-activated MO-derived DCs and Mφ, as assessed by determining the upregulation of MHC-II, CD80, CD86, B7-H1, B7-H4 and HLA-DR. DCs were identified by FACS analysis of CD1a, CD14 and CD11c expression, and Mφ were identified by FACS analysis of CD68, CD11b, CD163, CD206, CD115 and CD14 expression, with high expression of MHC-II and CD86, and showing strong antigen presentation (online supplemental figure 1C,D). The RNA and protein expression of proinflammatory cytokines (TGF-β1, IL-12, TNF-α, IL-6 and IL-1β) in response to LPS stimulation was confirmed (figure 3D,E). In general, all APCs could effectively induce the proliferation of naïve CD4+ T cells and CXCL13 production in vitro (figure 3F). Furthermore, the activated MOs more effectively promoted the expansion of Th-CXCL13 cells from memory CD4+ T cells than from naïve CD4+ T cells (figure 3G). We suspected that the classical Th-CXCL13 cells may have been polarized from naïve T cells, and the plasticity of multifunctional Th-CXCL13 cells was derived from memory T cells inside the tumor environment. To validate the mechanisms involved in the induction of Th-CXCL13 cells by APCs, particularly activated MOs, we used neutralizing Abs against TGF-β1, IL-12, TNF-α, IL-6 and IL-1β, which effectively abolished the individual roles of these cytokines in our expanded-MO/Th-CXCL13 system (figure 3H). The expression of CXCL13+CFSE+ by CD4+ T cells was inhibited by about 60%–70% by blocking TGF-β1, but was slightly reduced by blocking IL-1β, IL-6, TNF-α and IL-12. This was verified via the quantification of CXCL13 in the supernatant (online supplemental figure 6B). After finding that many multifunctional Th-CXCL13 cells selectively differentiated and accumulated in the tumor-associated TLSs, we evaluated the influence of tumor-derived MOs on the development of Th-CXCL13 subsets. The tumor-derived MOs exhibited an MHC-IIhiCD80hiCD86hiHLA-DRhiB7-H1hi phenotype (figure 3I), suggesting that the tumor-derived MOs were better APCs than those in the blood. In the TME, the MOs markedly expanded Th-CXCL13 cells, whereby TGF-β1-positive and IL-2-limiting conditions led to an increase of CD4+ Th-CXCL13 cells. The expression of CXCL13+CFSE+ by CD4+ T cells was mainly inhibited by about 55%–68% after blocking TGF-β1. The change of CXCL13 in the supernatant was consistent with that of CXCL13+CFSE+CD4+ T cells (figure 3J and online supplemental figure 6C). This suggested that activated APCs produced the proinflammatory cytokine TGF-β1 to induce the differentiation and expansion of the PD-1+CXCR5−CD4+ Th-CXCL13 cell subset.
Transcriptome analysis identified SOX4 as a transcriptional factor related to CD4+ Th-CXCL13 cells in the TLSs
To investigate the transcription factors related to Th-CXCL13 cells at inflammatory sites, we enriched CXCL13-producing CD4+ T cells from in vitro-differentiated naïve CD4+ T cells and conducted a transcriptome analysis. The addition of TGF-β1, as well as TGF-β-positive and IL-2-limiting or proinflammatory conditions, significantly enhanced cell proliferation and CXCL13 induction, which showed that CXCL13-producing CD4+ T cells were enriched. In these three groups, the highest expression of PDCD1 and Sox4 was identified, and Sox4 was the only transcription factor that fulfilled the screening criteria (figure 4A). Only the combination of TCR stimulation with TGF-β1 addition could induce the mRNA and protein expression of Sox4, PDCD1 and CXCL13 (figure 4B,C). Accordingly, the addition of siSox4 into the differentiating culture of naive CD4+ T cells significantly downregulated CXCL13 induction, without an effect on cell proliferation (figure 4D,E). These results were also validated in the CD4+ TILs from NPC tumors (figure 4F,G). These findings indicated that the regulation of Sox4 in Th-CXCL13 cells under inflammatory conditions is different from Th1 and Tfh. MIHC staining showed that these Th-CXCL13 cells (CD4+CXCL13+) also expressed Sox4 (figure 4H), which indicated that induction of Th-CXCL13 cells in the TLSs may be regulated by this transcription factor. Survival analysis revealed that Sox4 was associated with better survival outcomes (figure 4I). These findings indicated that TGF-β1 stimulation promoted Sox4 expression and the subsequent proliferation and differentiation of Th-CXCL13 cells in the TLSs.

Transcriptome analysis identified SOX4 as a transcription factor related to Th-CXCL13 cells in the TLSs. (A) Human naïve CD4+ T cells from healthy donors (n=3) were differentiated in the presence of the indicated chemokines for 8 days. Outline for the screening of candidate transcription factors. (B,C) Human naïve CD4+ T cells from healthy donors (n=4) were stimulated with or without anti-CD3/CD28 and/or TGF-β1 for 24 hours, and after which the expression of Sox4, PDCD1 and CXCL13 was assessed by RT-qPCR and immunoblotting. (D–G) Representative dot plots and statistical analysis showing the proliferation (CFSE−) and expression of CXCL13+ cells among naïve CD4+ T cells from healthy donors (n=4) and CD4+ TILs (n=4) with or without anti-CD3/CD28 beads and TGF-β1 stimulation in the presence or absence of siRNA against SOX4. (H) MIHC staining of a representative tumor section showing CD4+ (orange), CXCL13+ (red), Sox4+ (cyan) and CD20+ (green), with nuclei counterstained with DAPI (blue). (I) Survival analysis of the cohort stratified by Sox4+ cells identified by IHC staining, which the threshold used to define high and low is 2. Data were expressed as the means±SD, and paired two-tailed Student t-test. *P<0.05, **P<0.001, ***P<0.0001. IHC, immunohistochemistry; IL, interleukin; MIHC, multiplex immunohistochemical; TGF-β1, transforming growth factor beta 1; TIL, tumor-infiltrating lymphocyte; TLS, tertiary lymphoid structure; TNF-α, tumor necrosis factor alpha.
Migration and infiltration of tumor-associated B cells (TABs) in the TLSs
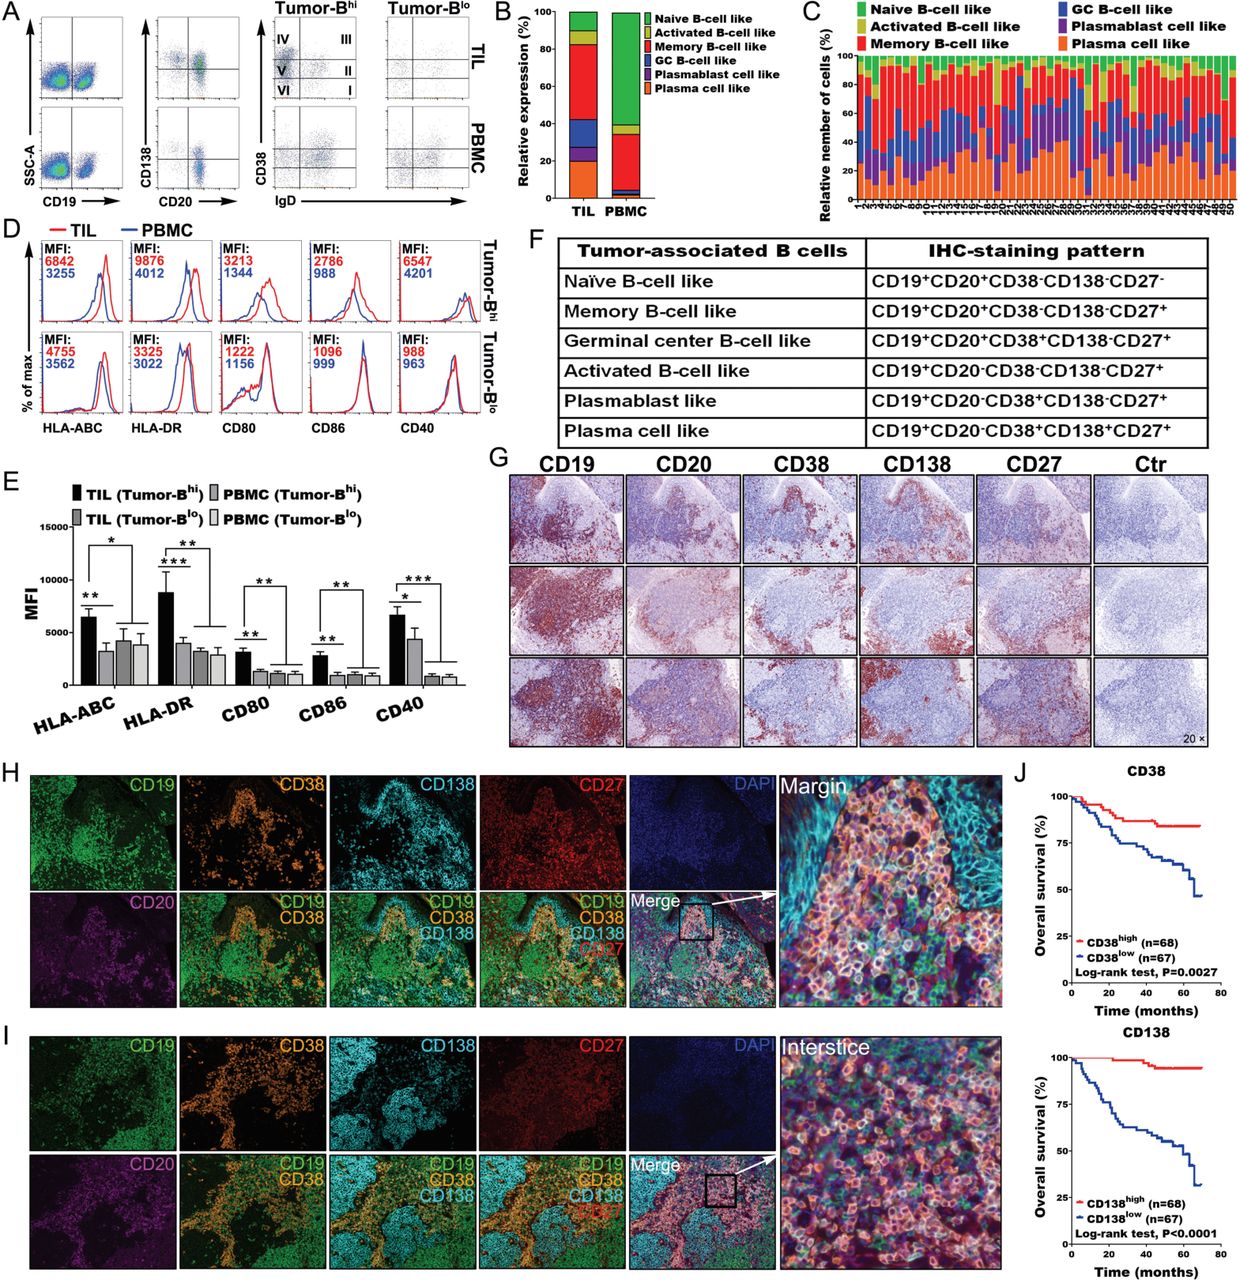
Understanding and analyzing the phenotypes of TABs is important for interpreting the local immune response. We found that TABs exhibited different characteristic phenotypes compared with those of PBMCs (online supplemental figure 8A,B). Indeed, TILs exhibited higher levels of CD19+ B cells and plasma cells than PBMCs. Memory B cells (CD19+CD20+IgD−CD38−CD138−), germinal center (GC) -B cells (CD19+CD20+IgD-CD38+ CD138-), plasmablast like cells (CD19+CD20−IgD−CD38+CD138−) and plasma cells (CD19+CD20−IgD−CD38+CD138+) accounted for vast majority of TILs. By contrast, naïve and memory B cells comprised the vast majority in PBMCs, except for a few tumors with less B-cell infiltration (figure 5A–C). B cells from tumors with high B-cell infiltration exhibited an HLA-ABChiCD80hiCD86hiHLA-DRhiCD40hi phenotype, suggesting that the tumor-derived B cells were also much better APCs than those in the blood or those in tumors with less B-cell infiltration (figure 5D,E). To understand the links between the Th-CXCL13 cell phenotype as characterized previously and the tumor reactivity of the intratumoral T-cell and B-cell pool, TILs were expanded ex vivo, and the reactivity of expanded CD4+ TILs towards autologous B cells was tested in the presence of a tumor suspension (online supplemental figure 9A). Tumor reactivity was assessed by measuring the expression of CXCL13, IFN-γ and IL-21 in CD4+ TILs and supernatants, respectively (online supplemental figure 9B,C). In line with the increased tumor reactivity of CD4+ TILs marked by expression of multifunctional Th-CXCL13 (CXCL13, IFN-γ and IL-21) (online supplemental figure 9D,E), tumor-specific multifunctional Th-CXCL13 had different TCRVβ expression levels in different cases, suggesting variations in the efficacy of tumor recognition and magnitude of the immune responses. There was great variation of TCRVβs among Th-CXCL13 cells, including the types, numbers and frequencies of each TCRVβ in each patient. Among the tested TCRVβs, seven TCRVβs (TCRVβ3, TCRVβ7.2, TCRVβ9, TCRVβ12, TCRVβ13.2, TCRVβ13.6 and TCRVβ16) were frequently expressed by Th-CXCL13 cells. These variations might be due to the differences in HLA haplotypes of patients and their Th-CXCL13 clonality (online supplemental figure 10A,B). These data suggested that TABs were good APCs for promoting the differentiation and proliferation of tumor antigen-specific Th-CXCL13 cells in the TLSs of NPC.

Migration and infiltration of tumor-associated B cells in the TLSs. (A,B) Representative dot plots and statistical analysis showing the indicated markers and phenotypic characteristics of CD19+ B cells, including the percentage of naïve B cells (CD19+CD20+-IgD+CD38−CD138−), activated B cells (CD19+CD20−IgD−CD38−CD138−), memory B cells (CD19+CD20+IgD−CD38−CD138−), GC-B cells (CD19+CD20+IgD−CD38+ CD138−), plasmablast-like cells (CD19+CD20−IgD-CD38+CD138−) and plasma cells (CD19+CD20−IgD−CD38+CD138+) in TILs and PBMCs (n = 50). (C) Relative frequency of different B-cell subsets among all CD19+ B cells (n=50). (D,E) Representative dot plots and statistical analysis showing the expression of the indicated markers by tumor-derived Bhigh and blow cells (n=6), respectively. (F) Marker combinations used to identify tumor-associated B-cell subpopulations by six-color IHC staining. (G) IHC staining of three representative tumor sections from different patients showing the indicated markers at different levels. (H,I) Full composite image together with DAPI counterstaining and images for each of the individual markers and different combinations from the composite image at the interstice or margin. (J) Survival analysis of the cohort stratified by CD38+ plasmablasts and CD138+ plasma cells identified by IHC staining, which the threshold used to define high and low is 6 and 9, respectively. Data were expressed as means±SD, and paired two-tailed Student t test. *P<0.05, **P<0.001, ***P<0.0001. IHC, immunohistochemistry; PBMC, peripheral blood mononuclear cell; TIL, tumor-infiltrating lymphocyte.
Next, we used six-color MIHC staining (CD19, CD20, CD38, CD138, CD27 and DAPI) to approximate six different TABs in whole tissue sections of NPC tumors (figure 5F). These molecules were expressed to varying degrees in all paraffin sections (figure 5G). The IHC results indicated that CD38+ plasmablasts and CD138+ plasma cells were primarily located at the tumor interstices or margins (figure 5H,I). Indeed, survival analysis revealed that the presence of CD38+ plasmablasts and CD138+ plasma cells was associated with better survival outcomes (figure 5J). By contrast, there were incomplete and immature structures in normal tissue, with very low expression of different B cell markers, indicating low immune responses (online supplemental figure 3C). Taken together, these results indicated that Th-CXCL13 cells recruited and guided the migration and infiltration of TABs into the TLSs, shaping the cellular composition of the NPC TME.
PD-1+CXCR5−CD4+ Th-CXCL13 cells promoted plasma cell differentiation and immunoglobulin production via IL-21 and CD84
The PD-1+CD4+ TILs included a large proportion of PD-1+CXCR5− cells which were the source of Th-CXCL13 cells. Additionally, a proportion of PD-1+CXCR5+ Tfh cells was also found in the TME. The proportions of these two cell subsets were much higher than among PBMCs. In particular, the high proportion of Th-CXCL13 cells was the most striking (figure 6A,B). Both Th-CXCL13 and Tfh cells showed significantly higher proportions of effector memory and activated phenotypes than their counterparts, suggesting a certain degree of migration capability. Analysis of a curated list of Tfh-associated markers (SLAM, SAP, Blimp-1, BATF and BTLA) demonstrated similar upregulation of multiple effector proteins in both pooled cell types (figure 6C), which highlighted a shared program associated with B cell-helper function. Accordingly, Th-CXCL13 and Tfh cells induced the differentiation of cocultured autologous memory B cells into plasma cells, inducing the production of IgG, IgA and IgM, while PD-1−CXCR5+ and PD-1−CXCR5− cells did not (figure 6D,E). Sterile paraformaldehyde-fixed Th-CXCL13 and Tfh cells also did not induce the differentiation of cocultured autologous memory B cells into plasma cells or Ig production (figure 6F). Neutralization of IL-21 but not CXCL13 significantly inhibited plasma cell differentiation and Ig production by both cell subsets (figure 6G). Long-term antibody-mediated immunity depends, in part, on the generation of GCs, which require T:B-cell cooperation for their effective formation and maintenance. SLAM family receptors contribute to the effective formation of GCs, leading to the generation of high-affinity antibody-secreting plasma cells and memory B cells, thereby facilitating long-term humoral immune responses. SLAM family receptors were highly expressed by the B-cell subsets (figure 6H). Additionally, Th-CXCL13 and Tfh cells expressed high levels of CD150, CD84 and CD352 compared with their counterparts (figure 6I). Among these receptors, only CD84 and CD352 were adhesive receptors and factors important for long-lived stable T:B-cell conjugates (figure 6J). When Th-CXCL13 and Tfh cells were cocultured with memory B cells, blocking of CD84 completely abrogated plasma cell differentiation and Ig production, which was not true for CD352 blockage (figure 6K). These results indicated that Th-CXCL13 cells promoted plasma cell differentiation and Ig production via IL-21 and CD84.

PD-1+CXCR5−CD4+ Th-CXCL13 cells promoted plasma cell differentiation and immunoglobulin production via IL-21 and CD84 interactions. (A,B) Representative dot plots and statistical analysis showing the PD-1+CXCR5+, PD-1+CXCR5−, PD-1-CXCR5+ and PD-1−CXCR5− subsets of CD4+ T cells among TILs and PBMCs of patients with NPC (n=8). (C) FACS analysis and heat map showing the phenotypical characteristics of the indicated four cell subsets of CD4+ TILs from NPC tumors (n=5). (D–F) Representative dot plots and statistical analysis showing the frequency of plasma cells, and the production of IgG, IgA and IgM in T-B cell cocultures with or without sterile subset cells fixed with paraformaldehyde, cocultured with autologous memory B cells from TILs of NPC tumors (n=4). (G) Statistical analysis showing the plasma cell frequency and the production of IgG, IgA and IgM in T-B cell cocultures using sorted cell subsets cocultured with autologous memory B cells from TILs of NPC tumors (n=4) with neutralizing antibodies against CXCL13 or IL-21, respectively. (H–I) Representative dot plots and statistical analysis showing the expression of indicated SLAM family members by B-cell subsets and four cell subsets of patients with NPC (n=4), respectively. (J) FACS analysis of the conjugation efficiency of blasted PD-1+CXCR5+ and PD-1+CXCR5− TILs (n=5), preincubated with or without neutralizing antibodies against CD150, CD84 or CD352, with LPS-activated B cells pulsed with a tumor suspension. (K) Statistical analysis showing the frequency of plasma cells, and the production of IgG, IgA and IgM in T-B cell cocultures using sorted PD-1+CXCR5+ and PD-1+CXCR5− cocultured with autologous memory B cells from TILs of NPC tumors (n=4) with or without neutralizing antibodies against CD352 or CD84, respectively. (L) MIHC staining of a representative tumor section showing CD4+ T (red), CXCL13+ (green) and CD20+ B (cyan), with nuclei counterstained with DAPI (blue). (M) MIHC staining of a representative tumor section showing CD4+ T (magenta), CD20+ B (cyan), CXCL13+ (red), Ki67+ (green) and IgG+ (orange), with nuclei counterstained with DAPI (blue). (N) MIHC staining of a representative tumor section showing CD20+ B (cyan), CXCL13+ (red), IgA+ (green), IgM+ (magenta) and IgG+ (orange), with nuclei counterstained with DAPI (blue). data are expressed as the means±SD, and paired two-tailed Student t-test. *P<0.05, **P<0.001, ***P<0.0001. FACS, fluorescence-activated cell sorting; MIHC, multiplex immunohistochemical; NPC, nasopharyngeal carcinoma; PBMC, peripheral blood mononuclear cell; TIL, tumor-infiltrating lymphocyte.
To better visualize the immune responses in the TLSs, we used IHC to examine the tumor tissue for interactions between Th-CXCL13 and B-TILs. Numerous Th-CXCL13+ TILs were detectable both within the TLSs and infiltrating the tumor, closely bound to the CD20+ B-TILs (figure 6L), suggested that Th-CXCL13-CD20+ B cells interacted with each other. Th-CXCL13 cells were also detectable in the TLSs that contained CD20+Ki67+ B-TILs, located at the tumor bed border in proximity to CD20−IgG+ plasma cells (figure 6M). There were significant increases in IgG, IgA and IgM, which were detected in and outside the TLSs, parallel to the extent of immune infiltration of Th-CXCL13 (figure 6N). These data suggested that Th-CXCL13 cells promoted plasma cell differentiation and Ig production via IL-21 and CD84 interactions in the TLSs of NPC.
Discussion
NPC is the most common cancer originating from epithelial cells in the nasopharynx, with a particularly high incidence throughout southern China and Southeast Asia. TLSs are ectopic lymphoid organs that develop in non-lymphoid tissues at sites of chronic inflammation, including tumors.15 29 Tumor-associated TLSs exhibit different maturation states, culminating in germinal center formation. Due to limited power in dissecting subpopulations or heterogeneous events, previous studies failed to understand (1) the diverse cellular types in the TME as well as their roles in tumor progression and host cell responses; (2) how to exploit TLSs to promote lymphocyte infiltration, activation by tumor antigens and differentiation to increase the antitumor immune response; and (3) the mechanisms that underlie the role of TLSs formation in the adaptive antitumor immune response.2 20
ScRNA-seq identified a CD4+ Th-CXCL13 subpopulation in the TLSs of tumors but not in normal tissues. Despite recent successes in demonstrating the chemoattraction of B cells by CXCL13, little is known about the mechanisms underlying the regulation of different CXCL13+ cell subsets in humans. The current study delineated the phenotype, distribution, generation, and functional relevance of the Th-CXCL13 cell subsets in NPC. In the TME, these CXCL13-producing CD4+ T cells were concentrated around the center of the TLSs, and exhibited Th1 and Tfh phenotypes, including the expression of PD-1, IFN-γ, and IL-21. There were significantly higher numbers of CXCL13-producing CD4+ TILs inside the tumor than among PBMCs, suggesting some important biological features. CXCL13 has been identified as one of the most robust predictors of improved survival in human cancers.30 31 Production of CXCL13 by T cells that infiltrate an inflamed tissue might be a key step in the initiation of TLSs formation.32 33 The detailed characterization of Th-CXCL13 cells presented here indicates that their presence is tightly linked with the recruitment of CXCR5+ cells to tumor sites. CXCL13 acts specifically to recruit and position CXCR5+ cells within lymphoid follicles, primarily CXCR5+ B cells and CXCR5+ Tfh cells.34 Overexpression of CXCL13 in an inflamed tissue induces the formation of B cell aggregates that eventually mature into TLSs.35 Conversely, neutralization of CXCL13 in murine models reduced the formation of lymphoid aggregates and the severity of tissue inflammation in several chronic inflammation and tumor models.33 Tumor-infiltrating CXCL13-producing PD-1+CXCR5− TILs appear to promote the formation of functional TLSs, in addition to activating humoral antitumor responses.36 Recently, CXCR5− Tfh-like cells with a similar function were also reported. PD-1+CXCR5− Tfh-like cells augment B cell responses via CXCL13 and IL-21, which might be associated with the antitumor immune response. The production of IL-21 by Tfh cells is important for B cell proliferation and differentiation into plasma cells.34 37 Here, we found that tumor-infiltrating CD4+PD-1+CXCR5− TILs produced Tfh factors associated with B cell-helper function, including the B-cell chemoattractants CXCL13 and IL-21. However, they varied dramatically in their resemblance of Tfh cells. PD-1+CXCR5− Tfh-like cells interact with CXCR5+ B cells by producing CXCL13 to help recruit B cells, as well as producing IL-21 to help drive B-cell activation and differentiation. Our data showed that both CD84 and CD352 were highly expressed by both B cells and CD4+ TILs, including PD-1+CXCR5+ and PD-1+CXCR5− cells. Tfh or Tfh-like cells are recognized as a specialized subclass of effector CD4+ T cells that reside within GCs and are critical for their formation and maintenance. Our in vitro data supported a direct role for CD84 in promoting and/or stabilizing prolonged T:B cell contacts, suggesting that this is a major SLAM family member involved in T:B cell interactions required for the delivery of T cell help, antibody production and productive GC formation. These cells frequently express PD-1 and co-produce IFN-γ. The overlap between Tfh and Th1 features in T cells early after activation appears to fit well with the theme that IL-21-producing T cells often also assist B cells in producing antibodies in inflamed tumor tissues, playing a role in the humoral immune response. B cells can protect against tumors under certain conditions, mainly through the production of tumor-specific antibodies and presentation of tumor-derived antigens.10 38 TGF-β signaling and the transcription factor Sox4 were identified as two crucial factors for the regulation of CXCL13 expression in CD4+ T cells. TGF-β is involved in the differentiation of Th-CXCL13 cell subsets through transcription factor Sox4. The developmental transcription factor Sox4 is a transcriptional target of TGF-β. Furthermore, the presence of IL-2 was also found to be essential for the survival and proliferation of Tregs and tumor cells, while limiting IL-2 was also important for promoting Th-CXCL13 cell development.39 Based on our data, we hypothesized that CXCL13 expression by CD4+ TILs can be influenced by the consumption of IL-2 by Tregs, which controls its availability. IL-2 secreted by antigen-activated TILs facilitates the proliferation and accumulation of Tregs at the tumor site, which in turn limits the availability of IL-2 for effector TILs.40 In the face of IL-2 deprivation, some activated CD4+ TILs increase CXCL13 production, resulting in their differentiation into Th-CXCL13 cells.
The role of B cells in cancer progression is still poorly understood, despite the abundant presence of infiltrating B cells in many human cancers, including NPC.11 17 18 Tumor-infiltrating B lymphocytes showed clonal amplification, rearrangement of immunoglobulin genes, somatic hypermutation and isotype switching, supporting the concept of a local antigen-driven B cell response.41 The correlations between the percentage of plasma cells and the density of follicular B cells in the tumor sections observed in our study strongly suggest that these immunoglobulin-secreting plasma cells did not migrate from the periphery. Instead, they were most likely generated inside the TLSs, following antigen-driven B-cell activation in situ.38 Theoretically, antibodies derived from plasma cells can mediate direct antitumor effects by binding to and disrupting the function of their cognate antigens, activating the complement pathway, and/or triggering antibody-dependent cell-mediated cytotoxicity (ADCC).42 Indeed, the presence of plasma cells surrounding the follicle and in dense cellular aggregates was highly suggestive of antibody production in situ. Furthermore, plasma cells were present, with deposits of IgG, IgM and IgA detectable on tumor cells, but scarcely found in normal tissues. These antibodies, likely produced by GC-derived plasma cells inside the TLSs, thus clearly bound to the tumor cells.
It is now well established that immune responses can take place outside of primary and secondary lymphoid organs (SLOs).6 12 It was traditionally believed that the generation of an efficient adaptive immune response against cancers occurs in SLOs.43 However, chronically inflamed tissues commonly accrue lymphocyte aggregates that facilitate local T:B cell interactions. These aggregates can range from small, loosely arranged lymphocyte clusters to large, organized ectopic lymphoid structures.44 TLSs are ectopic lymphoid organs that develop in non-lymphoid tissues at sites of chronic inflammation, including tumors and microbe-infected sites.45 46 In the present study, the TLSs of NPC tumors were found to resemble SLOs. These follicles showed the presence of bona fide GC-B cells positive for the proliferation marker Ki67, and high TLSs density was correlated with longer survival in patients with NPC.
It has become evident that TLSs are a major player in antitumor immune responses. It is therefore tempting to consider the development of strategies aimed at inducing TLSs neogenesis in tumors to enable the education of intratumoral T and B cells into effector and memory cells capable of recognizing the tumor. Located in the vicinity of tumor nests, and sustained by tumor-associated inflammation, TLSs represent privileged sites for the presentation of tumor antigens by DCs and education of subsequent T-cell and B-cell responses, resulting in the generation of T effector memory cells, memory B cells and antibodies.47 Several approaches are being developed using chemokines, cytokines, antibodies, APCs or synthetic scaffolds to induce TLSs formation.8 A current major challenge is to exploit TLSs to promote lymphocyte infiltration, their activation by tumor antigens and differentiation, with the aim of increasing the antitumor immune response48. The presence of TLSs adjacent to the tumor site facilitates antigen capture as well as the interactions between various immune cells that lead to immune activation, which can overcome tumor-mediated immune suppression.
Data availability statement
All data relevant to the study are included in the article or uploaded as supplementary information.
Ethics statements
Ethics approval
This study was approved by the institutional review board of the Sun Yat-Sen University Cancer Center (approval number 2018–0806). All patients provided written informed consent preoperatively and had no treatments before biopsy.
Acknowledgments
We thank Dr Jingyi Wang and Zhiwen Xiao from Sun Yat-Sen Memorial Hospital for providing the normal tissue samples, and Dr Liyin Shi from the Sun Yat-Sen University Cancer Center for reviewing the immunohistochemical films.
The key raw data was deposited onto the Research Data Deposit public platform (www.researchdata.org.cn) with the approval number RDDB2021001068.
References
Supplementary materials
Supplementary Data
This web only file has been produced by the BMJ Publishing Group from an electronic file supplied by the author(s) and has not been edited for content.
Footnotes
Collaborators Qian Zhong.
Contributors Conception and design: J-PL, M-SZ and QZ; development of methodology: J-PL, QZ, S-XL and Y-FK; Acquisition, analysis and interpretation of data: C-YW, M-YC, S-MY and CS; writing, review and/or revision of the manuscript: J-PL, M-SZ and QZ; administrative, technical or material support: J-PL, M-SZ, QZ and JRG; study supervision: M-SZ and QZ.
Funding This study was financially supported by project grants from National Key Research and Development Program (2017YFA0505604 and 2016YFA0502101), the China Postdoctoral Science Foundation (2018M643314 and 2019T120780), National Natural Science Foundation of China (81902050, 81830090, 82072982, 81772883 and 81621004), Natural Science Foundation of Guangdong Province (2017A030312003) and the Key Research and Development Program of Guangdong Province (2019B020226002).
Competing interests No, there are no competing interests.
Provenance and peer review Not commissioned; externally peer reviewed.
Supplemental material This content has been supplied by the author(s). It has not been vetted by BMJ Publishing Group Limited (BMJ) and may not have been peer-reviewed. Any opinions or recommendations discussed are solely those of the author(s) and are not endorsed by BMJ. BMJ disclaims all liability and responsibility arising from any reliance placed on the content. Where the content includes any translated material, BMJ does not warrant the accuracy and reliability of the translations (including but not limited to local regulations, clinical guidelines, terminology, drug names and drug dosages), and is not responsible for any error and/or omissions arising from translation and adaptation or otherwise.