Article Text

Abstract
Background Dendritic cells (DCs) play a critical role in antitumor immunity, but the therapeutic efficacy of DC-mediated cancer vaccine remains low, partly due to unsustainable DC function in tumor antigen presentation. Thus, identifying drugs that could enhance DC-based antitumor immunity and uncovering the underlying mechanism may provide new therapeutic options for cancer immunotherapy.
Methods In vitro antigen presentation assay was used for DC-modulating drug screening. The function of DC and T cells was measured by flow cytometry, ELISA, or qPCR. B16, MC38, CT26 tumor models and C57BL/6, Balb/c, nude, and Batf3−/− mice were used to analyze the in vivo therapy efficacy and impact on tumor immune microenvironment by clotrimazole treatment.
Results By screening a group of small molecule inhibitors and the US Food and Drug Administration (FDA)-approved drugs, we identified that clotrimazole, an antifungal drug, could promote DC-mediated antigen presentation and enhance T cell response. Mechanistically, clotrimazole acted on hexokinase 2 to regulate lactate metabolic production and enhanced the lysosome pathway and Chop expression in DCs subsequently induced DC maturation and T cell activation. Importantly, in vivo clotrimazole administration induced intratumor immune infiltration and inhibited tumor growth depending on both DCs and CD8+ T cells and potentiated the antitumor efficacy of anti-PD1 antibody.
Conclusions Our findings showed that clotrimazole could trigger DC activation via the lactate-lysosome axis to promote antigen cross-presentation and could be used as a potential combination therapy approach to improving the therapeutic efficacy of anti-PD1 immunotherapy.
- dendritic cells
- immunotherapy
Data availability statement
Data are available upon reasonable request.
This is an open access article distributed in accordance with the Creative Commons Attribution Non Commercial (CC BY-NC 4.0) license, which permits others to distribute, remix, adapt, build upon this work non-commercially, and license their derivative works on different terms, provided the original work is properly cited, appropriate credit is given, any changes made indicated, and the use is non-commercial. See http://creativecommons.org/licenses/by-nc/4.0/.
Statistics from Altmetric.com
Introduction
Dendritic cells (DCs) bridge the innate immunity and adaptive immunity and play an essential role in initiating and maintaining a protective immune response against tumors.1 2 In anticancer immunity, the preferential ability of DCs to activate T cells is the foundation of the cancer-immunity cycle. This includes the uptake of dead tumor cells by DCs followed by processing and presentation of cancer-associated antigens to T cells in draining lymph node or inside the tumor microenvironment.2 3 Thus, targeting DCs for their antigen-presenting function is a popular approach to boosting antitumor immunotherapy.
Currently, all cancer vaccines target DCs to promote antigen presentation and immune recognition of cancer cells, mainly by vaccination with tumor-associated antigen(s) with innate immune-stimulating adjuvants.4 In some cases, the dead “immunogenic” tumor cells induced by chemotherapy or radiation therapy could act as “in situ” vaccination and initiate DC activation, which was marked by increased surface expression of the Major Histocompatibility Complex Class II (MHC-II) and costimulatory molecules such as CD40, CD80, CD86, along with the release of inflammatory cytokines such as IL-1β, IL6, IL12, and Tumor necrosis factor α (TNFα), which together drive T cell activation and differentiation.2 5 On the other hand, innate immune receptor agonists such as 2’3’-cyclic GMP-AMP (cGAMP) or Cytidine-phosphate-Guanosine (CpG) DNA can also promote DC maturation and activation in vitro.6 7 Therefore, immunogenic cell death-inducing drugs and innate immune receptor ligands are being currently evaluated in several clinical trials for cancer immunotherapy. However, as the clinical approval of new drugs often takes years, the repurposing of currently Food and Drug Administration (FDA)-approved drugs to enhance DC-based antitumor immunity may provide new therapeutic options for cancer immunotherapy while bypassing the costs and time needed for new drug discovery.
Besides innate immune receptor agonist-induced inflammatory signaling, metabolic pathway reprogramming also plays a critical role in regulating the activation and function of DCs.8 For instance, during their early activation, both DCs and T cells can quickly switch from oxidative phosphorylation to glycolysis for energy support and increase fatty acid synthesis for cellular interaction.8 9 The PI3K/Akt/mTOR signaling has been shown to be critical for metabolic adaption of DCs to inflammatory stimulation.8 Interestingly, small molecule inhibitors targeting oncogenic signaling pathways such as the PI3K/Akt and MAPK pathway in cancer cells may also have an impact on immune cells. So far, most small molecule inhibitors exhibit immune suppressive effects on immune cells, and there have been only a few clinically approved drugs that have been reported directly regulate DC activation, but their effects on DC-mediated antitumor immunity have not been extensively explored.10–12
To tackle this issue, we adapted an in vitro antigen presentation assay system to screen drugs for DC activation.13 In this assay, DCs were pretreated with different drugs and transfected with a model antigen ovalbumin (OVA) and then cocultured with OVA-specific CD8+ T cells. T cell activation was measured by detecting IL-2 expression levels. Based on this assay, we identified that clotrimazole, a clinically approved antifungal drug, was capable of inducing DC activation and subsequent T cell activation. Further investigations revealed that clotrimazole could upregulate the lysosome pathway in DCs. Clotrimazole inhibited the expression of hexokinase 2 (HK2), an essential kinase for glycolysis, and decreased the production of lactate and subsequently downregulated the lysosome biogenesis pathway. Moreover, clotrimazole-induced DC activation was dependent on the expression of Chop gene, which was regulated by lysosome. In vivo clotrimazole administration increased intratumor immune infiltration and inhibited tumor growth in an immune cell-dependent manner and boosted the antitumor efficacy of anti-PD1 therapy. These observations demonstrated that clotrimazole could directly regulate DC activation to boost antitumor immunity and suggest the combinational use of clotrimazole with an anti-PD1 antibody for cancer treatment.
Materials and methods
Mice and reagents
Six to 8-week-old female C57BL/6J (B6), Balb/c, and nude mice were purchased from the Vital River Laboratory (Beijing, China). OT-I mice and Batf3−/− mice were obtained from The Jackson Laboratory.
B16 (C57BL/6 mouse melanoma), CT26 (Balb/c mouse colon adenocarcinoma) and HEK293 cell lines were obtained from American Type Culture Collection. Pancreatic ductal adenocarcinoma (PDAC) murine pancreatic cancer cells were derived from spontaneous pancreatic cancer tissues of a K-rasG12D; p53R172H; Pdx1-Cre mouse. MC38 (C57BL/6 mouse colon adenocarcinoma) cell line was kindly gifted by Dr Yang Xuanming (Shanghai Jiaotong University, Shanghai, China). DC2.4, a murine DC line, was kindly provided by Dr Kenneth Rock (University of Massachusetts Medical School, Worcester, Massachusetts, USA). B3Z hybridoma cells were kindly gifted by Dr Nilabh Shastri (University of California, Berkeley, California, USA). All cell lines were tested as being mycoplasma free. The cells were maintained either with Dulbecco's modified eaglemedium (DMEM) (Invitrogen) supplemented with 10% fetal bovine serum (FBS) and 1% penicillin-streptomycin or Roswell Park Memorial Institute (RPMI) 1640 (Invitrogen) supplemented with 1% penicillin-streptomycin and 10% FBS in a humidified atmosphere at 37℃ and 5% CO2.
For bone marrow-derived DCs (BMDC) isolation, femur and tibia from mice hinder legs were collected and bone marrow cells were flushed out using 1% FBS-containing phosphate buffer saline (PBS) by a syringe. Cells were treated briefly with ammonium–chloride–potassium lysis buffer (Lonza) to removed red blood cells and then resuspended into RPMI1640 medium with 10% FBS, antibiotics, 55 µM β-mercaptoethanol, and with supplement of recombinant murine Granulocyte-macrophage colony-stimulating factor (GM-CSF) and IL-4 (20 ng/mL, peprotech, 315–03, 214–14). The culture media were refreshed every 2 days.
Clotrimazole (A8401) and bafilomycin A1 (A8627) were purchased from Apexbio. Dimethyl sulfoxide (DMSO) (D2650), OVA (A5503) and lactate (L7022) were purchased from Sigma. Anti-mouse PD1 antibody (BE0146) and anti-CD8 antibody (BE0004-1) were from BioXcell.
LacZ activity measurement
The procedures for LacZ activity measurement was performed as previously described.14 Briefly, after activation, B3Z cells in the wells of a cell culture plate were lysed and freeze-thawed, to which 50 µL/well of PBS containing 0.5% bovine serum albumin and 100 µL/well of substrate solution (1 mg/mL chlorophenolred β-d-galactopyranoside) dissolved in β-galactosidase buffer were added. The plate was incubated at 37°C for 12 hours to 18 hours till color development reached a proper level, followed by color intensity reading at 580 nm using a microtiter plate reader.
T cell activation, proliferation, and DC activation assay
DC2.4 or BMDCs were pretreated with clotrimazole or DMSO, then transfected with OVA (100 µg/mL) by Lipofectamine 2000 (Lipo2000) for 20 hours, followed by coculture with B3Z or OT-I cells for additional time points, after which the LacZ activity in B3Z cells was determined. Supernatant levels of IL-2 and interferon γ (IFNγ) were measured by ELISA kits (eBioscience, 88-7024-88, 88-7314-22). T cells were stained with fluorescence-labeled antibodies against CD8 (eBioscience, 25-0081-82), CD69 (Biolegend, 104514), IFNγ (eBioscience, 25-7311-82), Granzyme B (Gzm B) (eBioscience, 48-8898-82). For the T cell proliferation assay, OT-I cells were labeled by carboxyfluorescein succinimidyl amino ester (CFSE), (eBioscience, 65-0850-84) before coculture with DCs, and the proliferation of OT-I cells was measured by flow cytometry after 48 hours of coculture.
For DC activation assay, DC2.4 or BMDCs were treated with clotrimazole for 24 hours, then stained with fluorescence-labeled antibodies against CD11c (eBioscience, 48-0114-82), MHC-II (eBioscience, 11-5321-82), CD40 (eBioscience, 12-0401-82), CD86 (eBioscience, 12-0862-82), CD80 (eBioscience, 46-0801-82), MHC-I (eBioscience, 48-5999-82). After antibody staining, the cells were then analyzed using flow cytometry.
For antigen presentation assay, DC2.4 cells were pretreated with clotrimazole and then transfected with OVA (100 µg/mL) by liposome 2000 for 24 hours, after which the cells were stained with an antibody recognizing SIINFEKL-H2Kb complex (25-D1.16, eBioscience, 17-5743-80) and analyzed by flow cytometry. For cross-presentation of B16-OVA by DCs, DCs were pretreated with clotrimazole (10 µM) for 16 hours, then the live B16-OVA tumor cells were added and processed for 24 hours. Following extensive wash, B3Z cells were added and cocultured for an additional 24 hours, followed by LacZ and IL-2 measurement.
Lysosome detection
DCs were treated with either clotrimazole only, or clotrimazole plus bafilomycin, or clotrimazole plus lactate for 24 hours, then stained with Phycoerythrin (PE)-labeled lysosome tracker (Invitrogen, L7528) for about 30 min. The fluorescent signal of PE was detected by flow cytometry or fluorescent microscope.
Lactate measurement
DCs were treated with clotrimazole for 24 hours, then the supernatants were collected for lactate measurement. DC2.4 cells expressing scramble shRNA (shscr), shRNA targeting Hk2 (shHk2-1,shHk2-2) were seeded in 24-well plates with 3×10⁵ cells per well. The culture supernatants were collected 24 hours after seeding, and the lactate concentration in the supernatant was measured by YSI 2950D-1 Biochemistry Analyzer.
Real-time PCR and ELISA analysis
Total RNA was isolated using Trizol (Invitrogen, 15596018) according to the manufacturer’s instructions. RNA was reversely transcribed using Primer Script Reverse Transcriptase Reagent Kit with gDNA Eraser (Takara, RR036A). Real-time PCR was performed using the SYBR Premix kit (Genstar, A301) and analyzed using the Bio-Rad CFX96 thermal cycler. The primer sequences used for the investigated mouse genes are listed in online supplemental table 1.
Supplemental material
CRISPR/Cas9 knockout and shRNA /siRNA knockdown
Specific gene knockout cells were constructed through the clustered regularly interspaced short palindromic repeats (CRISPR)/Cas9 system.15 The single-guide RNA (sgRNA) sequences were designed using the Optimized CRISPR Design (http://chopchop.cbu.uib.no/). The guide sequences used were:
Tfe3-sgRNA1: 5′- GACAACGTTCCATGTATCGGG-3′
Tfe3-sgRNA2: 5′-GAGCGTGTAGGGTTCTCGAGG-3′;
Tfeb-sgRNA1 : 5′-GCATATTCACACCCGACGGCG-3′
Tfeb-sgRNA2: 5′-GCAGCCCGATGCGTGACGCCA-3′;
Chop-sgRNA1: 5′-GTCGATCAGAGCCCGCCGTG-3′;
Chop-sgRNA2: 5′-GAATCGAGCGCCTGACCAGGG-3′.
The sgRNA was inserted into the LentiCRISPR V.2 vector that also contains the Streptococcus pyogenes Cas9 nuclease gene. sgRNA vectors were cotransfected with pspax2 and pMD2.G packaging plasmids in 293 T cells. The supernatants were harvested 48 hours post-transfection and used for infection with DC2.4 cells, followed by puromycin selection for 2 days. The knockout effect was assessed by Western blot analysis of whole cell protein extracts.
Expression of Tfe3, Tfeb, Hk2 and Chop was knocked down by indicated shRNA in DC2.4 cells. Briefly, lentiviral vectors expressing specific shRNA were cotransfected with pspax2 and pMD2.G packaging plasmids in 293 T cells. The supernatants were harvested 48 hours post-transfection and used for infection with DC2.4 cells, followed by puromycin selection for 2 days. Chop expression was knocked down in BMDCs by siRNAs with sequence 5’-UCCAGAUUCCAGUCAGAGU-3’ or 5’- CUGGGAAGCAACGCAUGAA-3’. The knockdown effect was assessed by Western blot analysis of whole cell protein extracts.
Western blot
The procedures for protein sample preparation from cell cultures, protein quantification, Western blot, and data analysis were performed as previously described.16 The following antibodies were used for Western blot analyses: anti-TFE3 (Cell Signaling Technology (CST), catlog number 14779), anti-β-actin (Sigma, A3854), anti-HK2 (CST, catlog number 2867), anti-CHOP (CST, catlog number 2895). Protein bands were visualized by chemiluminescence using an Enhanced chemiluminescence detection kit (Thermo Scientific, 32106). The band density was quantified by densitometry using Image J software, and individual protein band density was normalized with respect to β-actin levels.
Immunofluorescence staining of tumor tissue
The tissue sections were deparaffinized in xylene, rehydrated by incubation in serial ethanol baths (100%–70%, 3 min per bath). Epitope retrieval was performed through incubating the slides in 1 mM EDTA buffer (pH=8.0), heated to boil by microwave, and then maintained at a sub-boiling temperature for 30 min to 40 min. The tissue slides were blocked by normal goat serum and incubated overnight at 4°C with anti-CD31 (dilution: 1:100, Abcam, catalog number ab28364). After washes using PBS-T, the slides were incubated for 1 hour at room temperature (RT) with a secondary fluorescein isothiocyanate (FITC)-conjugated antibody (dilution: 1:500, CST, number 4412) and 1 µg/mL of 4',6-diamidino-2-phenylindole (DAPI) in PBS for 5 min at RT. After that, the slides were washed three times with PBS-T, sealed with cover slips, and examined using a fluorescent microscope (Olympus, BX53).
Fluorescent tagging of anti-PD1 and in vivo biodistribution analysis
Anti-PD1 antibody was fluorescently tagged with Alexa Fluor 647 using the Readilink Rapid iFluor 647 labeling kit according to the manufacturer’s instructions (AAT Bioquest, 1235). Briefly, 600 µg of the antibody at a concentration of 1 mg/mL was incubated with the Alexa 647 dye for 1 hour at RT, after that the conjugation reaction was stopped by adding the TQ-Dyed Quench Buffer at RT for 10 min. B6 mice were subcutaneously injected with MC38 tumor cells, followed by clotrimazole treatment on days 3–7 (40 mg/kg, intraperitoneally). The AF647-conjugated anti-PD1 was injected on day 9 (5 mg/kg). The mice were sacrificed 24 hours later, and the tumors were harvested and imaged using an IVIS Lumina III imaging system (Perkin-Elmer).
Tumor growth and tumor microenvironment analysis
For in vivo study, MC38 tumor cells (1×10⁶ cells/mouse) were subcutaneously injected into the right flank of B6 mice, nude mice or Batf3−/− mice. The mice were then treated with clotrimazole (dissolved in 10% DMSO, 40% PEG300, 5% Tween 80, and 45% PBS) or vehicle by intraperitoneal injection (40 mg/kg) on days 3–7. The tumor volume was calculated using the formula 0.5×tumor length×(tumor width),2 where the longer dimension was considered as the tumor length.
For immunophenotyping analysis of the tumor microenvironment, MC38 (1×10⁶ cells/mouse) or PDAC (1×10⁶ cells/mouse) tumor cells were subcutaneously injected into the right flank of B6 mice. Then the mice were treated with clotrimazole (dissolved in 10% DMSO, 40% PEG300, 5% Tween 80% and 45% PBS) or vehicle by intraperitoneal injection (40 mg/kg) on days 3–7. Tumor tissues were collected and analyzed on day 13. For analysis of immune cell populations, mouse tumors were dissociated by gentleMACS (Miltenyi Biotec) and filtered through 70 µm cell strainers to generate single-cell suspensions, then stained with fluorescence-labeled antibodies against CD45 (eBioscience, 11-0451-82), CD3 (eBioscience, 48-0031-82), CD4 (eBioscience, 47-0041-82), CD8 (eBioscience, 25-0081-82) and CD11c (eBioscience, 61-0114-82). Fluorescence data were acquired using a BD LSR Fortessa cytometer and analyzed using the FlowJo software, V.7.6.5.
For combination therapy, CT26 (5×10⁵ cells/mouse), MC38 (1×10⁶ cells/mouse) or B16 (5×10⁵ cells/mouse) tumor cells were subcutaneously injected into the right flank of Balb/c or B6 mice. Then the mice were randomly divided into four groups; clotrimazole or vehicle was administered by intraperitoneal injection on day 3–7, followed by three times of intraperitoneal injection of anti-PD1 (5 mg/kg, on day 9, 12, 15 for CT26 and MC38 tumor models) or two times of intraperitoneal injection of anti-PD1 (7.5 mg/kg, on day 9 and 12 for B16 tumor model), and the tumor volume was recorded. The mice with complete MC38 tumor regression or naïve mice were rechallenged by subcutaneous injection of MC38 (1×10⁶ cells/mouse), and the tumor volume was recorded.
For in vivo CD8+ T cell depletion, an anti-CD8 depletion antibody (5 mg/kg) was intraperitoneally injected on days 3, 6, and 9 after tumor inoculation, and the depletion effect was confirmed by flow cytometry.
Statistics
Data were analyzed using the GraphPad Prism software, V.5. Comparisons between two groups were analyzed using a two-tailed unpaired Student’s t test. Comparisons between multiple groups were analyzed using one-way analysis of variance (ANOVA) with Bonferroni’s post-test or two-way ANOVA with Bonferroni’s post-test for tumor growth study. Statistical significance was defined as a p value less than 0.05.
Study approval
All mice were maintained under specific pathogen-free conditions and in accordance with the animal experimental guidelines of Sun Yat-sen University (Guangzhou, China). All animal procedures were approved by the Institutional Animal Care and Use Committee of Sun Yat-sen University (Guangzhou, China). The data authenticity of this article has been validated by uploading the key raw data onto the Research Data Deposit platform (www.researchdata.org.cn) and inspected/approved by the Sun Yat-sen University Cancer Center Data Access/Ethics Committee with the approval number RDDB2021001066.
Results
Clotrimazole-enhanced DC-induced T cell activation
We set up an in vitro DC-T cell coculture assay to measure the antigen presentation function of DCs. In this assay, DC2.4 or BMDCs were incubated with soluble OVA or liposomal OVA (complexed with Lipofectamine 2000) for 20 hours and cocultured with B3Z (a CD8 T cell hybridoma specifically recognize OVA epitope) for 24 hours, then the IL-2 promoter-driven LacZ activity in T cells was measured to quantify IL-2 expression. Consistent with the previous report,17 liposomal OVA-primed, but not soluble OVA-primed DCs, significantly increased IL-2 reporter activity in T cells (online supplemental figure 1A). We next pretreated DC2.4 cells in 96 wells with a panel of small molecule inhibitors and FDA-approved drugs targeting different proteins with known or potential immune-modulating functions, and then tested their impacts on antigen presentation ability of DCs (online supplemental table 2). Consistent with the previous findings,10 18 cyclosporine and simvastatin inhibited and enhanced the antigen presentation of DCs, respectively. Interestingly, pretreatment of DCs by clotrimazole, an antifungal drug with documented antitumor activity,19 induced the highest LacZ activity in T cells (online supplemental figure 1B).
We then validated the ability of clotrimazole in enhancing DC-induced T cell activation. DC2.4 cells pretreated with increasing doses of clotrimazole stimulated LacZ activity and IL-2 secretion level in T cells in a dose-dependent fashion (figure 1A), with concurrent elevated T cell surface expression of activation marker CD69 (figure 1B). Similar results were obtained when primary BMDCs were used instead of DC2.4 cells for T cell activation (figure 1C,D). Consistently, when primary OT-I cells were used to coculture with DC2.4 cells or BMDCs primed with liposomal OVA, the supernatant levels of T cell-derived cytokines IL-2 and IFNγ also significantly increased by DCs with clotrimazole pretreatment (figure 1E and online supplemental figure 1C). Meanwhile, the expression levels of CD69 and effector molecules IFNγ and Gzm B on T cells were also markedly increased (figure 1F–G and online supplemental figure 1D–F). Moreover, a higher level of T cell proliferation was observed after coculture with liposomal OVA-primed DCs with pretreatment of clotrimazole (figure 1H). These results showed that clotrimazole could enhance DC-induced T cell activation.

Clotrimazole enhanced DC-induced T cell activation. (A and B) DC2.4 cells were treated with clotrimazole or DMSO, then transfected with OVA (100 µg/mL) for 20 hours, followed by co-culture with B3Z cells for additional 24 hours, after which B3Z activation was measured by LacZ activity, IL-2 production (A), and CD69 expression (B). (C and D) BMDCs were treated as described in A), after which B3Z activation was measured by LacZ activity, IL-2 production (C), and CD69 expression (D). (E–G.) BMDCs were treated with clotrimazole or DMSO, then transfected with OVA (100 µg/mL) for 20 hours, and co-culture with OT-I cells for an additional 24 hours, after which OT-I cells activation were measured by IL-2 production, IFNγ production (E), and intracellular expression of IFNγ (F) and GZMB (G). (H) BMDCs were treated as in (E), then co-cultured with OT-I (labeled by CFSE) for 3 days. The proliferation of OT-I cells was detected by microscopy and flow cytometry. Data in A–H are the representative result of three repeated experiments. *p<0.05, **p<0.01, ***p<0.001, by one-way analysis of variance with Bonferroni’s post-test. BMDC, bonemarrow-derived dendritic cell; CLT, clotrimazole; DMSO, dimethyl sulfoxide; CFSE, carboxyfluoresceinsuccinimidyl amino ester; IFNγ, interferon gamma; GZMB, Granzyme B.
Clotrimazole inhibited tumor growth via inducing antitumor immunity
Next, we investigated whether clotrimazole could enhance DC-mediated presentation of cell-associated antigen, specifically, antigen from tumor cells. Live mouse melanoma B16-OVA cells expressing OVA were coincubated with BMDCs and followed by coincubation with B3Z cells. The results showed that the clotrimazole pretreatment on B16-OVA-primed DCs also significantly enhanced T cell activation (figure 2A). Direct supplement of clotrimazole in the medium of coculture of BMDCs and B16-OVA cells also induced T cell activation (online supplemental figure 2A). Importantly, clotrimazole treatment did not enhance the uptake of B16-OVA cells by DCs (online supplemental figure 2B), but the surface expression level of MHC-I-SIINFEKL (OVA epitope peptide) complex on B16-OVA-primed DCs was significantly increased by clotrimazole pretreatment (online supplemental figure 2C), indicating enhanced antigen processing. These results prompted us to examine the impact of clotrimazole treatment on the immune control of tumor growth in vivo. Consistent with a previous report, which showed that clotrimazole possessed in vivo antitumor activity on melanoma cancer model,20 our experiments showed that treatment with clotrimazole caused significant tumor growth inhibition in MC38 mouse colon tumor and PDAC pancreatic tumor models on C57BL/6 (B6) mice (figure 2B,C and online supplemental figure 2D,E). Immunotyping of single cells isolated from tumor tissues revealed that clotrimazole treatment markedly increased the number of tumor-infiltrating CD8+ T cells, CD4+ T cells, and CD11c+ DCs (figure 2D–2F and online supplemental figure 2F–H), suggesting immune activation in the tumor microenvironment. Based on a previous study that reported the angiogenesis-inhibiting effect of clotrimazole,21 we checked the impact of clotrimazole on the tumor vasculature by staining tumors with endothelial cell marker CD31. The results showed that clotrimazole neither significantly affect the tumor vasculature reflected by CD31 staining pattern nor the intratumor lactate concentration (online supplemental figure 2I–K). The frequency of intratumor regulatory T cells was not significantly changed (online supplemental figure 2L). Consistent with the in vitro findings, intratumor DCs also showed upregulated CD40 and CD86 expression after clotrimazole treatment (online supplemental figure 2M). Furthermore, the intratumor frequency of CD69+ CD8+ and PD1+ CD8+ T cells were both increased after clotrimazole treatment (figure 2G,H), indicating T cell activation and exhaustion.

Clotrimazole inhibited tumor growth by promoting antitumor immunity. (A) BMDCs were treated with clotrimazole (10 µM) or DMSO for 20 hours, then incubated with live B16-OVA cells for 24 hours, followed by co-culture with B3Z cells for an additional 24 hours. The LacZ activity and IL-2 production were measured. (B) B6 mice bearing MC38 tumors were treated with clotrimazole or vehicle on day 3–7 (40 mg/kg, i.p.), and tumor growth was monitored. n=5 per group. (C–F) B6 mice bearing MC38 tumors were treated with clotrimazole or vehicle on days 3–7 (40 mg/kg, i.p.), Tumors were isolated on day 13, and tumor-infiltrating immune cells were analyzed by flow cytometry. Shown are tumor weight (C), numbers of tumor-infiltrating CD4+ T cells (D), CD8+ T cells (E), CD11c+ dendritic cells (F), CD69 and PD1 expression on CD8+ T cells (G–H). (n=5 for C–F, n=4 for G–H). (I.) Balb/c nude mice bearing MC38 tumors were treated with clotrimazole or vehicle on days 3–7 (40 mg/kg, i.p.), and tumor growth was monitored. n=5 per group. (J) B6 mice were injected with anti-CD8 depletion antibody on days 3, 6, and 9 after MC38 tumor inoculation, followed by clotrimazole treatment on day 3–7 (40 mg/kg, i.p.), and tumor growth was monitored. n=5 per group. (K) B6 background WT or Batf3−/− mice bearing MC38 tumors were treated with clotrimazole or vehicle on day 3–7 (40 mg/kg, i.p.), and tumor growth was monitored. n=5 per group. Tumor volume is shown as mean±SD, *p<0.05, **p<0.01, ns=not significant, by two-way analysis of variance with Bonferroni’s post-test (B, I–J) or unpaired Student’s t test (A, C–H). BMDC, bonemarrow-derived dendritic cell; CLT, clotrimazole; DMSO, dimethyl sulfoxide.
Interestingly, clotrimazole had no inhibitory effect on the tumor growth of MC38 tumors established on T cell-deficient nude mice (figure 2I), suggesting a critical role of T cells in the clotrimazole-induced antitumor effect. In line with the results on nude mice, pretreatment with an anti-CD8 depletion antibody abolished clotrimazole-induced MC38 tumor inhibition on B6 mice (figure 2J).
To further determine the role of DCs in clotrimazole treatment-induced antitumor effect, we inoculated MC38 tumors on Batf3−/− mice that were deficient in type I conventional DCs, the presumably major antigen-presenting cell population in vivo. We found that clotrimazole could not inhibit tumor growth on Batf3−/− mice (figure 2K), indicating that antigen presentation was essential for clotrimazole-induced antitumor activity. Taking together, these results showed that clotrimazole could inhibit tumor growth through an immune-dependent manner.
Clotrimazole promoted the gene expression of costimulatory molecules and antigen presentation of DCs
Next, we investigated whether the enhanced T cell activation was dependent on the presence of antigen. Clotrimazole-treated DC2.4 cells were transfected with or without OVA, then cocultured with B3Z for 24 hours. The LacZ activity and supernatant levels of T cell-derived cytokine IL-2 were found to be enhanced only in the OVA transfected condition (figure 3A), indicating that clotrimazole potentiated the antigen presentation function of DC. Clotrimazole treatment increased the surface expression levels of costimulatory molecules CD40 and CD86 on both DC2.4 and BMDCs (figure 3B). Specifically, antigen presentation machinery genes including mouse β2m (B2m), an essential component of MHC-I, and the genes directing peptide cleavage (Erap1), peptide transporters (Tap1 and Tap2) were all upregulated in clotrimazole-treated DCs (figure 3C). Moreover, clotrimazole treatment increased the surface expression of the MHC-I-SIINFEKL complex on liposomal OVA-treated DCs, further indicating an enhanced antigen presentation activity (figure 3D). Altogether, our data showed that clotrimazole induced costimulatory molecule expression and promoted antigen presentation of DCs.

Clotrimazole activated dendritic cells. (A) DC2.4 cells were treated with clotrimazole (20 µM) or DMSO, then transfected with OVA (100 µg/mL) for 20 hours, and co-culture with B3Z cells for an additional 24 hours, after which LacZ activity and IL-2 production in B3Z cells were measured. (B and C) DCs were treated as described in (A), the expression of CD40 and CD86 was measured by flow cytometry (B), the expression levels of antigen processed genes were measured by qPCR (C). (D) DCs were treated with clotrimazole (20 µM) or DMSO for 20 hours, then transfected with OVA (100 µg/mL) for another 24 hours. The expression level of the MHC-I SIINFEKL complex was measured by flow cytometry. Data in A, B, D are the representative results of three repeated experiments. Data in (C) are shown as mean±SD of three replicates from one representative experiment. *p<0.05, **p<0.01, ***p<0.001 and ns=not significant, by one-way analysis of variance with Bonferroni’s post-test. OVA, antigen ovalbumin; CLT, clotrimazole; DMSO, dimethyl sulfoxide; DC, dendritic cell.
Clotrimazole-induced DC activation through the lysosome pathway
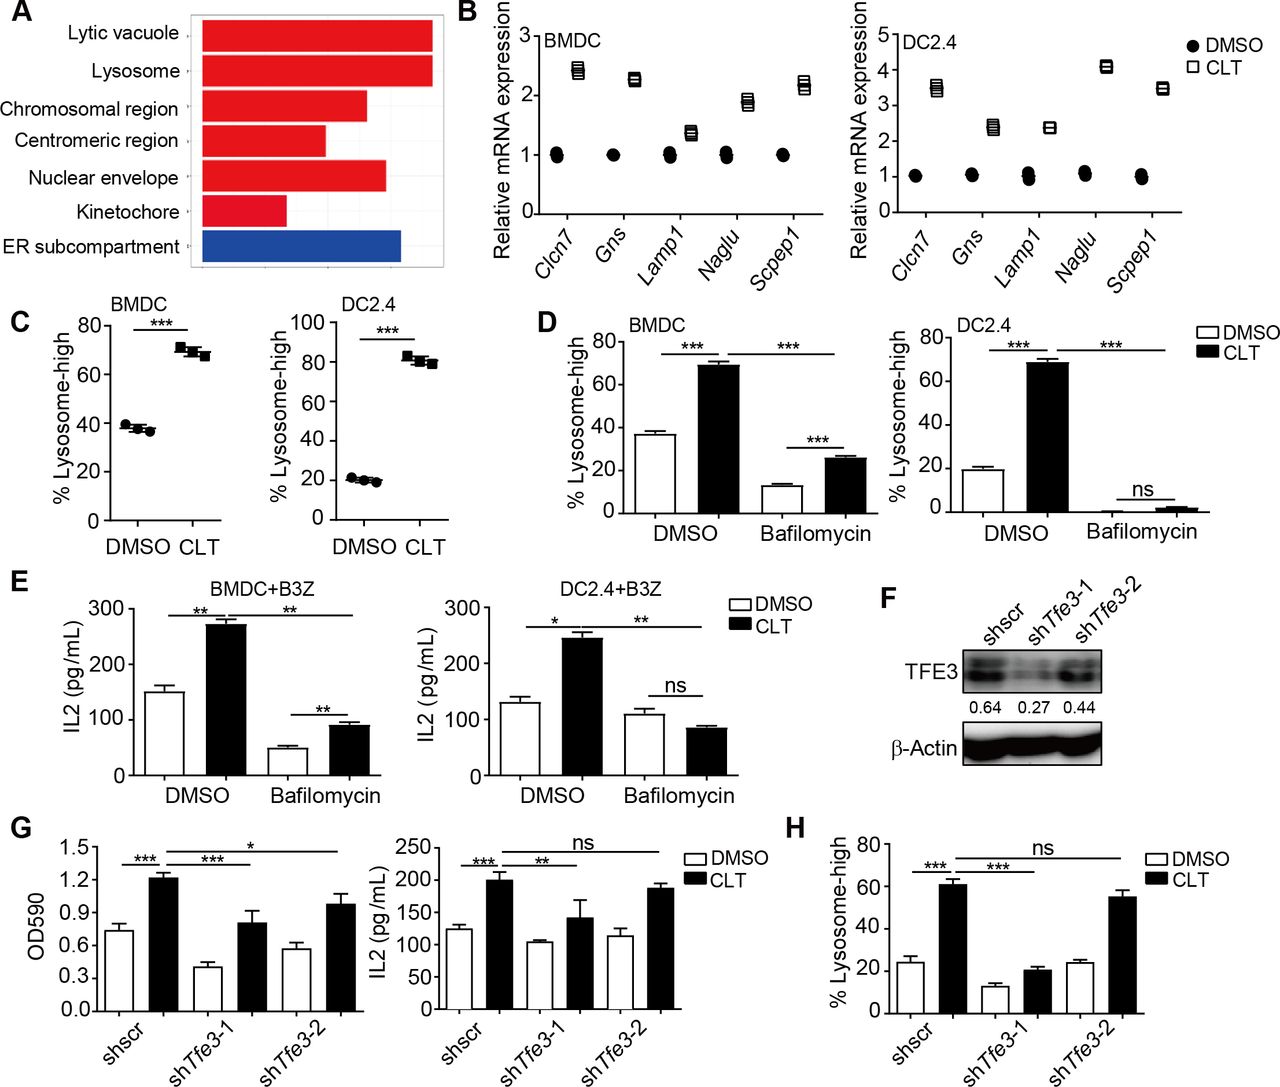
To investigate how clotrimazole induced DC activation, we performed RNA-seq analysis to identify different gene expression patterns in BMDCs after clotrimazole treatment. Lysosome pathway-associated genes were found to be significantly enriched by clotrimazole treatment (figure 4A), and the upregulation of lysosome pathway genes was validated by qPCR (figure 4B). Furthermore, increased fluorescence signal of lysosomes, which were marked by PE-labeled lysosome tracker, was observed in BMDCs or DC2.4 after clotrimazole treatment (figure 4C and online supplemental figure 3A).

Clotrimazole induced dendritic cell activation through a lysosome pathway. (A.) Gene set pathway enrichment analysis by RNAseq using BMDCs treated with clotrimazole (20 µM) or DMSO for 24 hours. (B) DCs were treated with clotrimazole (20 µM) or DMSO for 24 hours. The expression of lysosome-associated genes was measured by qPCR. (C) DCs were treated as in (B), the PE-labeled lysosome tracker was added into the medium for an additional 30 mins. The fluorescence signal was detected by flow cytometry. (D) DCs were treated with clotrimazole (20 µM) or combined with bafilomycin (100 nM) for 20 hours, the PE-labeled lysosome tracker was added into the medium for an additional 30 min. The fluorescence signal was detected by flow cytometry. (E) DCs were treated as in D), then transfected with OVA (100 µg/mL) for 20 hours, and co-cultured with B3Z for an additional 24 hours, after which B3Z cell activation was measured by IL-2 production. (F and G) DC2.4 cells were treated with clotrimazole or DMSO, then transfected with OVA (100 µg/mL) for 20 hours, and co-culture with B3Z for an additional 24 hours, after which B3Z cell activation was measured by LacZ activity and IL-2 production (G). Western blot was used to detect the knockdown efficiency of TFE3 expression (F). (H) DC2.4 cells were treated as in G), the PE-labeled lysosome tracker was added into the medium for an additional 30 min. The fluorescence signal was detected by flow cytometry. Data in (B) are shown as mean±SD of three replicates from one representative experiment. Data in (C–H) are the representative result of three repeated experiments. *p<0.05, **p<0.01, ***p<0.001 and ns=not significant, by one-way analysis of variance with Bonferroni’s post-test. BMDC, bone marrow-derived dendritic cell; CLT, clotrimazole; DMSO, dimethyl sulfoxide; DC, dendritic cell.
The lysosome pathway has been known as a major route for antigen processing and presentation in DCs.22 To determine the role of lysosome pathway upregulation in clotrimazole-treated DCs, we used bafilomycin, a lysosome inhibitor, to block lysosome acidification. Bafilomycin pretreatment not only abolished clotrimazole-induced lysosome upregulation but also inhibited the upregulation of costimulatory molecules on DCs, and IL-2 production by T cells activated by DCs (figure 4D–F and online supplemental figure 3B,C). Microphthalmia family transcript factors, such as transcription factor EB (TFEB) and transcription factor binding to Immunoglobulin HeavyConstant Mu enhancer (TFE3), are the master regulators for the expression of the “coordinated lysosomal expression and regulation” gene network.23 We next knocked down or knocked out Tfe3 and Tfeb by shRNA or sgRNA in DCs, and found that inhibition of TFE3, but not TFEB, significantly impaired clotrimazole-induced lysosome in DCs and DC-induced T cell activation (figure 4F and online supplemental figure 3D–E).
Together, these results suggested that clotrimazole could regulate the TFE3-regulated lysosome pathway to induce antigen presentation in DCs.
Clotrimazole inhibited lactate production by targeting HK2
Recent studies have shown that lysosomes could be regulated by lactate, and a high concentration of lactate in the tumor environment inhibited DC’s antigen presentation function.24–26 Meanwhile, it was shown that clotrimazole could down-regulate HK2 activity, an essential kinase for glycolysis and lactate production.27 We, thus, investigated whether clotrimazole-induced lysosome biogenesis was dependent on HK2 and HK2-regulated glycolysis. Consistent with previous reports,28 we observed a down regulation of HK2 protein expression in DC2.4 or BMDCs after treatment with clotrimazole (figure 5A and online supplemental figure 4A). As a consequence of HK2 inhibition, lactate production levels were also decreased after clotrimazole treatment (figure 5B). Knockdown of Hk2 expression by shRNAs in DCs also decreased lactate production (figure 5C,D). Moreover, knockdown of Hk2 enhanced DC-induced T cell activation (figure 5E and online supplemental figure 4B), accompanied by increased expression levels of lysosome-associated genes and costimulatory molecules on DCs (figure 5F–H and online supplemental figure 4C). Importantly, lactate supplementation suppressed the effect of clotrimazole on DC-induced T cell activation (figure 5H and online supplemental figure 4D) and clotrimazole-induced expression of lysosome genes or costimulatory molecules in DCs (figure 5I–J and online supplemental figure 4E). These results suggested that clotrimazole could inhibit lactate production by targeting HK2, which in turn induced lysosome formation and antigen presentation of DC.

Clotrimazole inhibited lactate production by targeting HK2 in DCs. (A) DC2.4 cells were treated with clotrimazole or DMSO for 24 hours, then the expression of HK2 was determined by WB. (B) DC2.4 cells were treated with clotrimazole or DMSO for 24 hours, the lactate concentration in the supernatant was measured. (C and D) DC2.4 cells were cultured for 24 hours, then the lactate concentration in the supernatant was measured (D); WB was used to detect the knockdown efficiency of HK2 expression in DC2.4 cells by shRNA (C). (E) DC2.4 cells were transfected with OVA (100 µg/mL) for 20 hours, then co-cultured with B3Z for an additional 24 hours, after which B3Z cell activation was measured by LacZ activity and IL-2 production. (F) DC2.4 cells were cultured for 24 hours, the PE-labeled lysosome tracker was added into the medium for an additional 30 min. The fluorescence signal was detected by flow cytometry. (G) The expression of lysosome-associated genes in DC2.4 cells was measured by qPCR. (H) DC2.4 cells were treated with DMSO, clotrimazole, lactate (20 mM) or clotrimazole +lactate, then transfected with OVA (100 µg/mL) for 20 hours, and co-culture with B3Z for an additional 24 hours, B3Z cell activation was measured by LacZ activity and IL-2 production. (I and J) DC2.4 cells were treated as in (H) for 24 hours. The expression of lysosome-associated genes was measured by qPCR (I), and the expression level of CD40 and CD86 was detected by flow cytometry (J). Data in (A–F, H, and J) are the representative result of three repeated experiments. Data in (G) and (I) are shown as mean±SD of three replicates from one representative experiment. *p<0.05, **p<0.01, ***p<0.001, by one-way analysis of variance with Bonferroni’s post-test. OVA, antigen ovalbumin; CLT, clotrimazole; DMSO, dimethyl sulfoxide; PE, Phycoerythrin.
Chop expression is required for clotrimazole-induced DC activation
We next tried to pinpoint the key factors downstream of glycolysis that mediated clotrimazole-induced DC activation. One recent study showed that the expression of Chop, an endoplasmic reticulum stress pathway-related transcription factor, was increased in activated DCs.29 We also observed elevated Chop expression in both mRNA and protein levels after clotrimazole treatment in DC2.4 and BMDCs (figure 6A and online supplemental figure 5A,B). To determine the functional contribution of Chop expression in clotrimazole-induced DC activation, we blocked Chop gene expression in DCs using sgRNA or siRNA. Strikingly, clotrimazole-treated DCs enhanced T cell activation was attenuated when the expression of chop was knocked out by sgRNA or knocked down by shRNA or siRNA in DCs (figure 6C,D and online supplemental figure 5C–E). Clotrimazole-induced expression of CD86 and CD40 on DCs was also abolished in chop-knockout cells (figure 6E and online supplemental figure 5C). Interestingly, the increased CHOP expression triggered by clotrimazole could be abolished by bafilomycin treatment (figure 6F and online supplemental figure 5F). In addition, this phenomenon could also be observed in the TFE3 knockdown cells (figure 6G). Lactate supplement also abolished the increased expression of CHOP triggered by clotrimazole (figure 6H and online supplemental figure 5G). These results suggested that clotrimazole could promote DC-induced T cell activation by upregulating Chop expression, which was regulated by lysosome and lactate.

Clotrimazole induced dendritic cell activation by regulating Chop expression. (A and B) DC2.4 cells were treated with clotrimazole or DMSO for 24 hours, and the expression of Chop was detected by WB (A) or qPCR (B). (C and D) DC2.4 cells were treated with clotrimazole or DMSO, then transfected with OVA (100 µg/mL) for 20 hours, then co-culture with B3Z for an additional 24 hours, after which B3Z cell activation was measured by LacZ activity and IL-2 production (C), the expression of Chop was detected by WB and qPCR (D). (E) DC2.4 cells were treated with clotrimazole or DMSO for 24 hours, after which the expression of CD86 was detected by flow cytometry and qPCR. (F) DC2.4 cells were treated with DMSO, clotrimazole, bafilomycin or clotriamzole +bafilomycin for 24 hours, after which the protein level of CHOP was detected by WB. (G) DC2.4 cells were treated with DMSO or clotrimazole for 24 hours, after which the protein level of CHOP was detected by WB. (H) DC2.4 cells were treated with DMSO, clotrimazole, lactate or clotriamzole +lactate for 24 hours, after which the protein level of CHOP was detected by WB. Data in A, C, E–H are the representative result of three repeated experiments. Data in (B, D and E) are shown as mean±SD of three replicates from one representative experiment. *p<0.05, **p<0.01, ***p<0.001, by one-way analysis with Bonferroni’s post-test. OVA, antigen ovalbumin; CLT, clotrimazole; DMSO, dimethyl sulfoxide; WB, Western blot; SCR, scramble; CHOP, C/EBP homologous protein; NT, no lactate treatment.
Clotrimazole sensitizes tumor response to anti-PD1 immunotherapy
Clotrimazole inhibited tumor growth by promoting DC-mediated antigen presentation, the early step of tumor recognition; while anti-PD1 therapy targeted T cells in exhaustion, the late stage of T cell dysfunction. We reasoned that the two may work better together to promote antitumor immunity. We, thus, investigated the therapeutic efficacy of combining clotrimazole with anti-PD1 treatment on the mouse colon cancer CT26 tumor model, which contains K-RasG12D mutation and is known to be insensitive to anti-PD1 therapy.
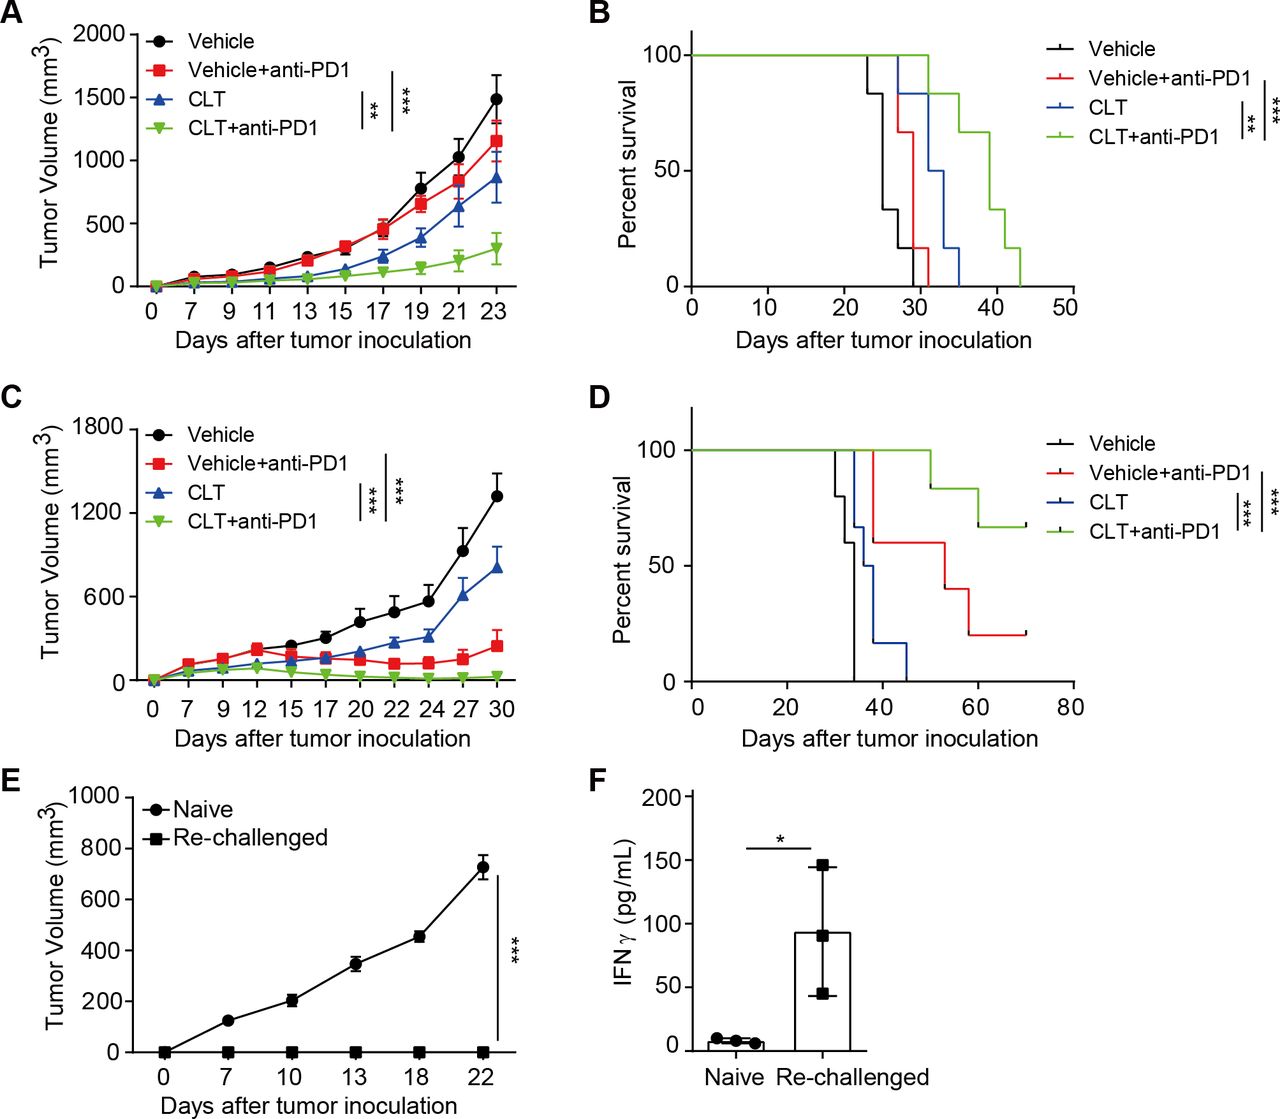
Mice with established subcutaneous CT26 tumors were treated with clotrimazole and anti-PD1 antibody alone or in combination. As expected, anti-PD1 alone did not have significant therapeutic effect on CT26 tumor growth, and clotrimazole treatment partially inhibited tumor growth. Importantly, mice treated with clotrimazole in combination with anti-PD1 achieved the best tumor growth inhibition and longest survival (figure 7A,B and online supplemental figure 6A). Similar improved efficacy by combination therapy was observed in MC38 colon cancer and B16 melanoma models (figure 7C,D and online supplemental figure 6B,D). Strikingly, the administration of clotrimazole and anti-PD1 in established MC38 tumors lead to significant tumor regression (figure 7D). Mice with complete tumor regression rejected tumor growth when rechallenged with parental MC38 tumor cells (figure 7E). Consistently, CD8 T cells from these mice showed much higher expression of effector molecules including IFNγ and GZMB compared with that of CD8 T cells from naïve mice when cocultured with MC38 tumor cells (figure 7F and online supplemental figure 6E). Notably, the intratumor anti-PD1 distribution was not affected by clotrimazole treatment (online supplemental figure 6F), suggesting that clotrimazole potentiates the efficacy of anti-PD1 by stimulating tumor immune microenvironment but not anti-PD1 tumor biodistribution. Collectively, these results showed that clotrimazole could promote antitumor immunity and enhance the therapeutic efficacy on multiple tumor types when combined with anti-PD1.
Clotrimazole potentiated the efficacy of anti-PD1 therapy in multiple mouse tumor models. (A) Balb/c mice were subcutaneously injected with CT26 tumor cells and divided into four groups, then treated with vehicle, clotrimazole (40 mg/kg, day 3–7), anti-PD1 (5 mg/kg, day 9, 12, 15), or clotrimazole in combination with anti-PD1 at indicated time points, and tumor growth was monitored. n=6 per group. (B) The survival curves for indicated groups as described in (A). (C) B6 mice were subcutaneously injected with MC38 tumor cells and divided into four groups, then treated with vehicle, clotrimazole (40 mg/kg, day 3–7), anti-PD1 (5 mg/kg, day 9, 12, 15), or clotrimazole in combination with anti-PD1 at indicated time points, and tumor growth was monitored. n=5 for vehicle and anti-PD1 group, n=6 for clotrimazole and clotrimazole combined with anti-PD1 group. (D) The survival curve for indicated groups as described in (C). (E) MC38 tumor cell lines were inoculated subcutaneously into mice that previously rejected MC38 tumors on clotrimazole and anti-PD1 therapy or into naïve B6 mice as control, and tumor growth was monitored. n=4 for each group. (F) CD8+ T cells were isolated from the lymph nodes of mice that previously rejected MC38 tumors on combination therapy, and co-cultured with MC38 tumor cells for 24 hours, then the IFNγ production was measured by ELISA. Tumor volume is presented as mean±SD, *p<0.05, **p<0.01, ***p<0.001, by two-way analysis of variance with Bonferroni’s post-test (A, C, E), log-rank (Mantel-Cox) test (B, D), or unpaired Student’s t test (F). CLT, clotrimazole.
Discussion
DCs play a critical role in antitumor immunity response as the most professional antigen-presenting cells in vivo.2 Moreover, the intratumor DC infiltration frequency and activation status correlate with better therapeutic response and prognosis. Therefore, therapeutic approaches that potentiate DC activation may allow more cancer patients to benefit from these therapies. Actually, there are several ways to induce DC activation.30 DAMPs (ATP and HMGB1, etc) released from tumor cells undergoing ICD can bind with the corresponding receptors on the DCs, which can, in turn, induce DC activation and maturation.5 Furthermore, agonists for these pattern pathogens receptors such as cGAMP or CpG can also trigger DC activation.31–33 However, most of these agonists are still under clinical trials for cancer treatment, and the innate immune signaling pathways are often mutated or dysregulated in tumor cells. In the present study, based on in vitro antigen presentation assay, we showed that clotrimazole, an FDA-approved antifungal drug, could directly induce DC activation and promote antigen presentation and subsequently enhance T cell proliferation and activation.
Interestingly, clotrimazole was clinically used as an antifungal drug as it could disrupt the biosynthesis of sterols which were required for fungal cell membrane production.34 Clotrimazole also exhibited growth inhibitory effects on several human cancer cells, including human melanoma, glioblastoma and breast cancer cells, and inhibited tumor growth in a xenograft rat model of intracranial glioma.19 35 Previous studies have reported that clotrimazole could disrupt calmodulin metabolism and influence glycolytic enzyme HK2 in tumor cells, which led to a reduction of their proliferation and viability.20 36 37 Our findings demonstrated that clotrimazole could target HK2 in DCs, a major type of immune cells, decreasing lactate production and in turn regulating antigen presentation in DCs. HK2 was often found to be highly expressed in tumor cells, and HK2 inhibition in tumor cells was associated with slow tumor growth.38 Moreover, the concentration of lactate, a product of HK2-controlled metabolic pathway, was found to be consistently high in tumor tissues.39 Our results showed that the tumor-inhibiting effect by clotrimazole was dependent on the immune cells including DCs and CD8+ T cells but not by reducing tumor-derived lactate production. Mounting evidence showed that an early elevation of glycolysis is a metabolic hallmark of DCs and T cell activation. HK2 is a key enzyme in the glycolytic pathway and HK2 inhibition in theory would impair T cell activation. However, T cell-specific knockout of HK2 did not impair T cell development or activation in vivo.40 Such phenotype suggests that other kinases/pathways may compensate for the HK2 function in glycolysis. On the other hand, there is also evidence that glycolysis may be detrimental for T cell stemness and long-term activity, although early glycolysis is required for immediate activation of T cells.41 Similarly, there are also studies reporting that glucose represses DC-mediated T cell response,42 and DCs treated with rapamycin or galactose showed a prolonged life span together with extended costimulatory molecule expression and strong induction of CD8+ T cell activation.42 43 Thus, the need for energy support from glycolysis or mitochondrial OXPHOS for immune cell activation may be a highly dynamic process depending on the timing and environment. Clotrimazole may target HK2 in DCs for a sustained activation status; alternatively, HK2 inhibition may affect lysosome acidification, which is known to be important for antigen processing.44 The detailed mechanism merits future studies.
It is well established that the lysosome pathway plays a critical role in regulating antigen presentation and DC activation.22 Consistent with these findings, clotrimazole-induced DC activation was found dependent on the lysosome pathway, as lysosome inhibition by bafilomycin or knockdown of the lysosome gene expression regulator TFE3 both blocked DC activation by clotrimazole. Intriguingly, a recent study showed that TFEB induced lysosome biogenesis could attenuate MHC-I but enhance MHC-II antigen presentation.45 In the present study, we observed that clotrimazole inducing the DC enhancing class I antigen-induced CD8+ T cell activation. One explanation could be that we used cell-associated OVA antigen rather than soluble antigen, which differs in antigen uptake and processing routes.44 46 Another possible reason could be that TFE3, but not TFEB, participates in the clotrimazole regulation depending on the lactate metabolic system, and TFE3 may be more sensitive than TFEB in response to increased concentration of lactate.47 Moreover, TEF3 other than TFEB may induce more genes’ expression such as DC activation-related genes.23 48 49
Furthermore, we found that clotrimazole induced Chop expression at RNA and protein levels in DCs. Chop was required for optimal expression induction of the inflammatory cytokine IL23 in DCs, which contributes to DC activation.29 In this study, we found that clotrimazole-induced Chop was dependent on the lysosome pathway as bafilomycin could abolish Chop induction. Lactate supplement also blocked increased Chop expression. We observed that costimulatory molecular expression on DCs was correlated with Chop expression, as knockout of Chop attenuated these genes’ expression in both mRNA and protein levels. Therefore, clotrimazole could induce Chop expression depending on lysosome and lactate, and Chop participated in regulating the expression of costimulatory molecules.
Anti-PD1 treatment has demonstrated superior therapy efficacy on multiple tumor types, but the response rate has been much lower than desired.50 Therapies that can boost immune cell infiltration inside tumors may have the potential to convert an immune cold tumor to a hot tumor, thereby increasing the tumor response to PD-L1/PD1 blockade and expanding the benefits of anti-PD1 therapy. The activation status of DCs in the tumor microenvironment was found to be associated with therapeutic efficacy.30 We found that the clotrimazole could induce DC activation in vitro. In vivo experiments showed that clotrimazole treatment could induce intratumor immune cell infiltration. Here, we demonstrated that clotrimazole could promote DCs in vivo and enhanced anti-tumor efficacy in combination with anti-PD1 in several mouse tumor models.
Overall, our findings suggest that clotrimazole could target HK2 to regulate lactate metabolism and induce lysosome pathway in DCs for enhanced antigen presentation, which could enhance T cell activation and sensitize tumor response to anti-PD1 treatment. As several clinical trials testing the efficacy of targeted therapy inhibiting tumor signaling plus checkpoint blockade antibodies are ongoing, our findings provide a potential combinational approach for cancer treatment by using clotrimazole targeting DCs in combination with anti-PD1 antibody.
Data availability statement
Data are available upon reasonable request.
Acknowledgments
We thank Dr Seeruttun Sharvesh Raj of Sun Yat-sen University Cancer Center for language editing.
References
Supplementary materials
Supplementary Data
This web only file has been produced by the BMJ Publishing Group from an electronic file supplied by the author(s) and has not been edited for content.
Footnotes
ZW and FX contributed equally.
Contributors ZW and XX conceived and designed the study. ZW conducted most experiments and wrote the manuscript. FX performed some key experiments. JH, HZ, LC, WL, WH, XW, ML, HZ, WX, CX, and YL performed parts of the involved experiments. PZ, JL, PH, and XFQ provided reagents and analyzed data. XX supervised the project and wrote the manuscript.
Funding This work was supported by the grants from the National Key R&D Program of China (2018YFC1313300/2018YFC1313304), the National Natural Science Foundation of China (81972692, 81773051, 81803005, 82073140, 81902905, 81902491), the Guangdong Innovative and Entrepreneurial Research Team Program (2016ZT06S638), and Fundamental Research Funds for the Central Universities (20ykzd22, 19ykpy191, 20ykpy176, 20ykpy180).
Competing interests No, there are no competing interests.
Provenance and peer review Not commissioned; externally peer reviewed.
Supplemental material This content has been supplied by the author(s). It has not been vetted by BMJ Publishing Group Limited (BMJ) and may not have been peer-reviewed. Any opinions or recommendations discussed are solely those of the author(s) and are not endorsed by BMJ. BMJ disclaims all liability and responsibility arising from any reliance placed on the content. Where the content includes any translated material, BMJ does not warrant the accuracy and reliability of the translations (including but not limited to local regulations, clinical guidelines, terminology, drug names and drug dosages), and is not responsible for any error and/or omissions arising from translation and adaptation or otherwise.