Article Text

Abstract
Background Neutrophils play a controversial role in tumor development. The function of programmed cell death-1 ligand (PD-L1+) neutrophils, however, may inhibit the cytotoxicity of anti-tumor immunity. In this study, we elucidate the stimulators of PD-L1+ neutrophils in tumor microenvironment (TME) and explore the optimal combination to enhance the effect of lenvatinib by inhibiting PD-L1+ neutrophils in hepatocellular carcinoma.
Methods Neutrophil infiltration after lenvatinib treatment was examined with RNA sequencing and multicolor flow cytometry analysis in patient samples, subcutaneous and orthotopic mouse models. Neutrophils and T cells were isolated from peripheral blood and tumor tissues and purified with magnetic beads for cytotoxicity assay. Metabolites and cytokines were detected by a biochemical analyzer manufactured by Yellow Springs Instrument (YSI) and proteome profiler cytokines array. In vitro screening of pathway inhibitors was used to identify possible candidates that could reduce PD-L1+ neutrophil infiltration. Further in vivo assays were used for verification.
Results Lenvatinib increased neutrophil recruitment by inducing CXCL2 and CXCL5 secretion in TME. After entering TME, neutrophils polarized toward N2 phenotype. PD-L1 expression was simultaneously upregulated. Thus, lenvatinib efficacy on tumor cells hindered. The increasing PD-L1+ neutrophils positively corelated with a suppressive T cell phenotype. Further investigation indicated that JAK/STAT1 pathway activated by immune-cell-derived interferon γ and MCT1/NF-kB/COX-2 pathway activated by high concentrations of tumor-derived lactate could induce PD-L1+ neutrophils. The latter could be significantly inhibited by COX-2 inhibitor celecoxib. Further in vivo assays verified that Celecoxib decreased the survival of lactate-stimulated PD-L1+ neutrophil and promoted the antitumor effect of lenvatinib.
Conclusions PD-L1+ neutrophils decrease T cell cytotoxicity. Tumor-derived lactate induces PD-L1 expression on neutrophils via MCT1/NF-κB/COX-2 pathway. Thus, COX-2 inhibitor could reduce PD-L1+ neutrophil and restore T cell cytotoxicity. This may provide a potent addition to lenvatinib.
- drug therapy
- combination
- metabolic networks and pathways
- neutrophil infiltration
- programmed cell death 1 receptor
- tumor microenvironment
Data availability statement
The datasets supporting the conclusions of this article are available in the Research Data Deposit repository, http://www.researchdata.org.cn/. The RDDN of the dataset for this study is RDDB2021001079. All data are available on reasonable request.
This is an open access article distributed in accordance with the Creative Commons Attribution Non Commercial (CC BY-NC 4.0) license, which permits others to distribute, remix, adapt, build upon this work non-commercially, and license their derivative works on different terms, provided the original work is properly cited, appropriate credit is given, any changes made indicated, and the use is non-commercial. See http://creativecommons.org/licenses/by-nc/4.0/.
Statistics from Altmetric.com
- drug therapy
- combination
- metabolic networks and pathways
- neutrophil infiltration
- programmed cell death 1 receptor
- tumor microenvironment
Introduction
Lenvatinib is a first-line therapy for advanced hepatocellular carcinoma (HCC). Lenvatinib monotherapy, however, has limited long-term survival benefits for HCC patients.1–5 It is, therefore, a major unmet need to identify an optimal combination therapy to address the limitations of lenvatinib.
Lenvatinib is known to inhibit tumor angiogenesis and enhance T cell cytotoxicity. The tumor microenvironment (TME), however, is a complex network of interactions between resident and migratory cell populations. These interactions encompass a variety of mechanisms that may limit the cytotoxicity of T cells and thus reduce the effect of lenvatinib. Targeting immune checkpoints such as programmed cell death-1 (PD-1)/L1 in the immunosuppressive TME, therefore, have been proven a success in several clinical trials. For example, pembrolizumab enhanced lenvatinib’s efficacy by alienating the immunosuppressive TME.1 6 7 Further clinical trials (NCT03006926 and NCT03418922) in advanced gastric cancer demonstrated that lenvatinib combined with anti-PD-1 antibodies was effective with good tolerability and safety profile in patients.8–10 These unambiguous clinical evidences supported antivascular therapy combined with immunomodulators as a potential treatment for solid tumors.11 The underlying mechanism is nonetheless unclear. Moreover, pembrolizumab is costly and requires regular intravenous injection. In conjunction, the exploration of a more affordable and less invasive alternative is inevitable.
Neutrophils are the most abundant cells in human peripheral blood.12 13 Once recruited by damage-associated molecule patterns or chemokines, neutrophils will rapidly migrate into TME.12 13 Neutrophils work as a double-edged blade,14 on one side they release reactive oxygen species (ROS), hydrogen peroxide and tumor necrosis factor (TNF)-related apoptosis-inducing ligand to attack tumor cells. On the other side, neutrophils release inflammatory factors, stimulate angiogenesis and regulate tumor immunity to promote tumor development and invasion. With the help of neutrophil extracellular trap formation (NETosis), tumor cells can even escape immune surveillance.15–18 Previous researches suggested that neutrophils may have heterogenous immunophenotypes with dynamic functional plasticity. For instance, once stimulated by transforming growth factor-β (TGF-β), resident tumor-associated neutrophils could polarize into N2 phenotype.19 Neutrophil can also impair the function of adaptive immunity by releasing ROS, activating complement C3 and hypoxia-related factors.20 Programmed cell death-1 ligand (PD-L1+) neutrophils are corelated with a poor outcome in HCC patients, however, the mechanism needs further exploration. We, therefore, aim to search for an optimal combination treatment with lenvatinib by investigating neutrophils depletion factors.
In this study, we discussed lenvatinib’s effect on TME by investigating the activated factors that affect neutrophils ability after treated with lenvatinib. We also identified possible tumor-derived factors that regulate neutrophils biologic behavior. Potential combinations with lenvatinib were established by exploring compounds that intervene the regulation of tumor-derived factors. The most exciting finding, is without doubt elucidating a possible resistance mechanism of lenvatinib and combatting the resistance by pertinent compounds. This combination may significantly enhance lenvatinib’s efficacy and expand HCC therapeutic options to benefit more patients.
Methods
Patients and specimens
Written informed consent was obtained from each patient as per the study protocol.The peripheral blood of patients with HCC at SYSUCC was collected for peripheral blood mononuclear cell (PBMC) analysis and the tissue samples of HCC patients with surgery at SYSUCC were collected for neutrophils infiltration and PD-L1 expression analysis.
Cell lines, isolation and culture
Cell lines (HepG2, MHCC97H, Huh7, Hep3B, ATCC, Manassas, Virginia, USA) derived from human HCC were authenticated by short tandem repeat typing technology. The murine HCC cell line H22 was used for animal models of HCC. Neutrophils, T cells and PBMCs were isolated from the blood of HCC patients at the SYSUCC.
Culturing conditions of cell lines were as previous report.2 Briefly, human HCC cells and Mouse Hepa 1–6 cells were cultured in Dulbecco’s Modified Eagle’s Medium (Gibco, China). T cells, PBMCs and H22 cells were cultured in RPMI-1640 (Gibco, China). HUVEC were cultured in Endothelial Cell Medium (ScienCell, USA). Both mediums were supplemented with 10% fetal bovine serum (Hyclone, New Zealand) and 1% penicillin–streptomycin (Gibco, China). All cells were cultured at 37°C and 5% CO2.
Tumor models and assessment
Albino, laboratory-bred strain of house mouse (BALB/c mice), aged 5–6 weeks, were purchased from Guangdong Medical Animal Center (Guangdong, China). All animal procedures were approved and performed in accordance with Institutional Animal Care and Use Committee guidelines.
For H22 allografts, 2×10⁶ cells were injected subcutaneously in the left side of the abdomen of female BALB/c mice. For orthotopic implantation, 2×10⁶ H22 cells were injected into the left lobes of female BALB/c livers. The maximal tumor diameters were measured in two dimensions to calculate tumor volume using the formula (1/2a×b× b). ‘a’ represents long diameter and ‘b’ represent short diameter. Details were described as previous.2
Treatments and delivery
Lenvatinib (S5240), celecoxib (S1261), nifuroxazide (S4182) and baricitinib (S5754) were purchased from Selleck, and anti-PD-1 antibodies were kindly provided by the Zhou lab (Sun Yat-Sen University, China) or purchased from BioXcell (BE0146). Ultra-LEAF purified anti-mouse Ly-6G antibodies were purchased from Biolegend (127632).
Treatment of mice included: daily gavage with 0.5% methylcellulose (control group), lenvatinib (S5240) diluted in 0.5% methylcellulose by daily oral administration at 10 mg/kg for 10 days; murine anti-PD-1 antibodies diluted in phosphate buffered saline (PBS) 100 µg interperitoneal (i.p.) every 3 days, for a total of 3 doses; murine anti-Ly-6G antibodies diluted in PBS, 100 µg i.p. every 2 days, for a total of four doses; and combined therapies, lenvatinib +murine anti-PD-1 antibodies, and lenvatinib +murine anti-Ly-6G antibodies. Daily doses of the following were orally administrated: baricitinib (S5754) at 10 mg/kg, celecoxib (S1261) at 50 mg/kg, nifuroxazide (S4182) at 50 mg/kg for 10 days and lenvatinib combined with baricitinib, celecoxib or nifuroxazide; SB225002 (S7651) diluted in 2% dimethyl sulfoxide (DMSO), 30% PEG300 and ddH2O was injected intraperitonelly at 10 mg/kg every 2 days; anti-CXCL2 antibodies (Leinco, USA) diluted in PBS, 2 µg i.p. every 2 days, for a total of 6 doses; anti-CXCL5 antibodies (Leinco, USA) diluted in PBS, 1 µg i.p. every 2 days, for a total of six doses.
Tumor isolation and flow cytometry
Tumors were harvested 21 days and 14 days after initiation of therapy and 60% of the tumors were digested into single cell suspensions while 40% of the tumors were prepared for histopathological assessment. Flow cytometry and cell sorting were carried out with the procedure detailed in our previous report.2 The fluorescent-labeled antibodies used are summarized in Table S1(online supplemental file 8). Data were analyzed using FlowJo software (BD Biosciences, USA).
RNA isolation, sequencing and data analysis
Tumor samples for RNA sequencing (RNA-seq) were immediately snap-frozen in liquid nitrogen after harvesting. The samples were prepared and RNA-seq was conducted by Novogene (Novogene, China). Gene ontology enrichment analysis was implemented by the cluster Profiler R package. Gene ontology terms with corrected p values less than 0.05 were considered significantly enriched by differentially expressed genes.
Trans-well assay
Neutrophils were isolated from peripheral blood of HCC patients at the SYSUCC. 5×10⁵ freshly isolated neutrophils were cultured in RPMI1640 and added to the upper chamber (Corning, USA). 2×10⁵ tumor cells (Hep3B, HepG2) were cultured in Dulbecco’s Modified Eagle’s Medium and respectively added to the lower chamber. The tumor cells were treated with blank or 1 uM lenvatinib and the migrated cells in the lower chamber were stained with crystal violet after 24 hours.
Cytotoxicity lactate dehydrogenase assay
The cytotoxicity of T cells was evaluated through measurement of lactate dehydrogenase (LDH) levels, detected using the Viability/Cytotoxicity Multiplex Assay Kit (CK17, Dojindo, Japan). The supernatant of T cells from HCC patients cocultured with neutrophils and HepG2 cells, treated with or without lenvatinib (100 nM) was collected. The LDH levels measured from tumor cells alone or incubated with different proportions of T cells was used as a control curve. A 50 µL of Reaction Mix was added into each well and mixed, then incubated at 37°C protected from light and the output was measured immediately at OD 450 nm (T1) on a microplate reader.
Proteome profiler mouse XL cytokine array/human inflammatory cytokine array
A membrane-based antibody array (ARY020) and Human Cytokine Array C3 (AAH-CYT-3) were used to determine the relative levels of selected mouse and human cytokines in serum and tumor cell line culture supernatants, respectively. Approximately 50 µL peripheral plasma collected from mice by eyeball extirpating and 2 mL supernatant was tested according to the manufacturer’s protocol. The levels of a panel of 111 different mice cytokines and 42 human cytokines were analyzed by ImageJ.
Statistical analysis
Flow and imaging data were analyzed using FlowJo V.10.4. All statistical analyses and pictures were processed using Prism V.7 (GraphPad, USA). A two-tailed Student’s t-test and two-way ANOVA were used for comparisons of normally distributed datasets. For survival analysis, p values were computed using the log rank test. Values of p<0.05 were considered significant.
Results
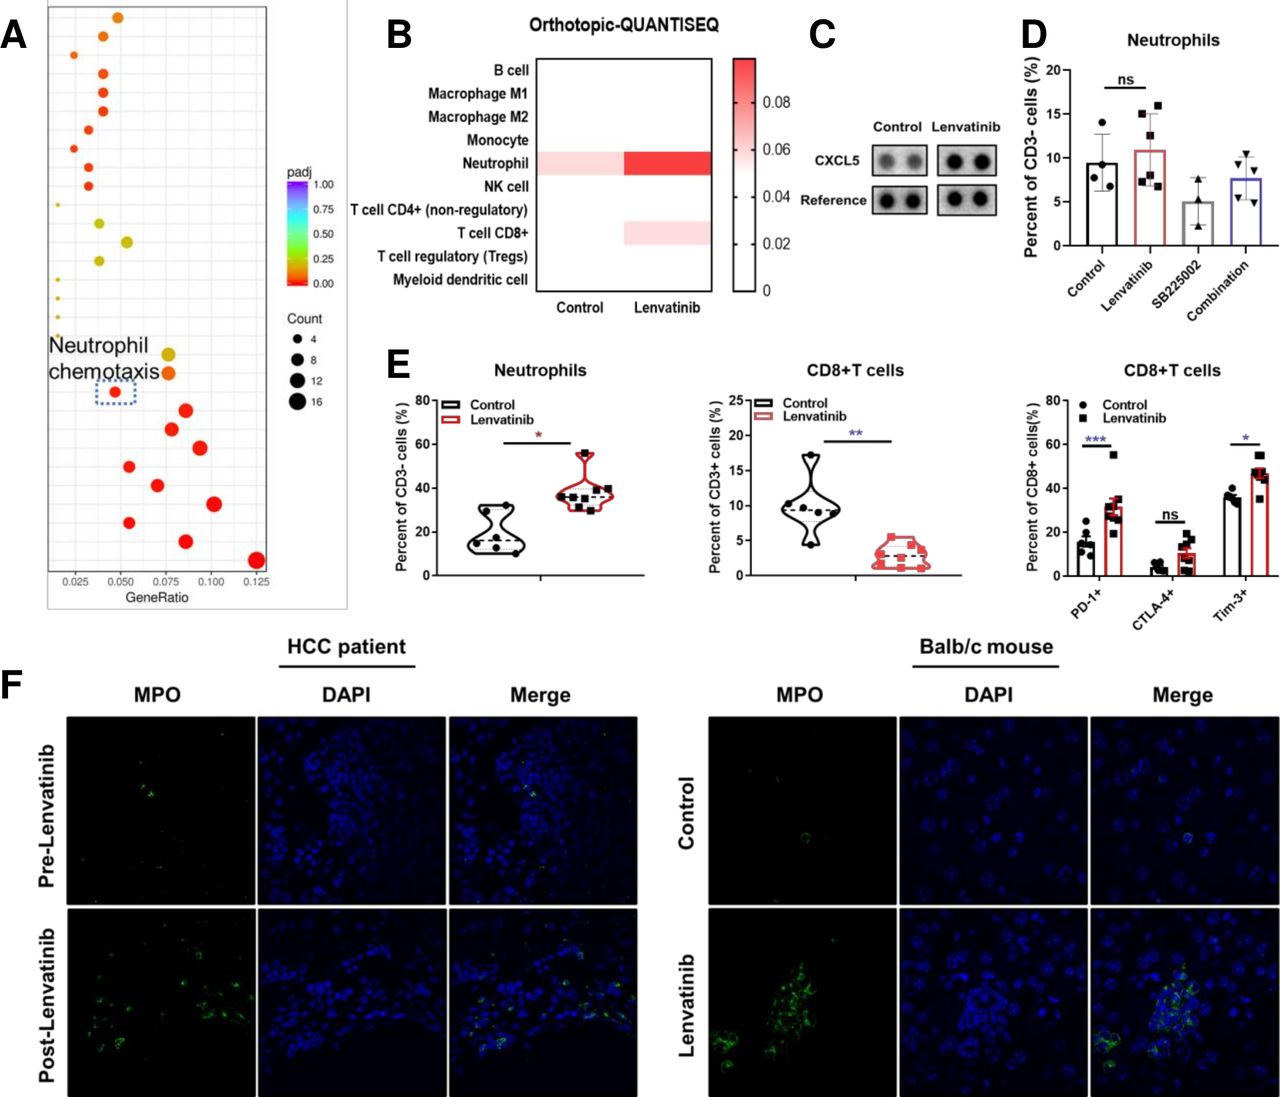
Lenvatinib promotes neutrophil infiltration by stimulating TME CXCL2 and CXCL5 secretion: this is accompanied by immunosuppressive CD8+ T cell
RNA-seq was used to identify TME regulating genes on BALB/c mice harvest tumors after 14 days of lenvatinib treatment. Pathway enrichment analysis indicated the upregulation of neutrophil chemotaxis pathway compared with control group (figure 1A). This result was supported by mice orthotopic tumor tissue QUANTISEQ analysis of RNA-seq data estimated by TIMER (figure 1B, online supplemental figure S1A).21–23 Specifically, genes encoding neutrophil chemokines CCL5, CXCL5 and CXCL2 were increased following lenvatinib treatment (online supplemental figure S1B). CXCL5 also increased in peripheral blood examined with proteome profiler cytokine array (figure 1C). Furthermore, trans-well assay suggested that lenvatinib-treated tumor cells had an increased capacity to actively recruit neutrophils (online supplemental figure S1C).
Supplemental material

The effect of lenvatinib on chemokines and recruitment of neutrophils. Gene ontology analysis for pathways regulated following treatment with lenvatinib versus control in subcutaneous BALB/c mice models assessed by RNA-seq (A). Immune infiltration estimations by timer for expression profiles tested by RNA-Seq data of orthotopic Hepa1-6 models (B). Proteome profiler mice XL cytokine array analysis for peripheral blood following treatment with lenvatinib versus control in BALB/c mice models (C). Histogram showing the effect of lenvatinib monotherapy, SB225002 and lenvatinib in combination with SB225002 on neutrophil recruitment (D). Scatter plots showing the infiltration of neutrophils, CD8+T cells and expression of PD-1, CTLA-4 and Tim-3 on CD8 +T cells in orthotopic BALB/c mice models (E). Representative immunofluorescence staining images showing infiltration of MPO+ cells in biopsy samples of HCC patients before and after lenvatinib treatment (left, 60×) and in tissue samples of orthotopic BALB/c mice models following treatment with lenvatinib versus control (right. 100×) (F). *P<0.05, **p<0.01, ***p<0.001. HCC, hepatocellular carcinoma; ns, not significant; PD-1, programmed cell death-1; RNA-Seq, RNA sequencing.
In order to further identify the neutrophil recruitment effect of CXCL2 and CXCL5, we applied CXCR2 inhibitor SB225002 and anti-CXCL2 and anti-CXCL5 neutralization antibodies for functional experiments. The results indicated that SB225002 could reduce neutrophil infiltration and promote CD8+ T cells recruitment (figure 1D, online supplemental figure S1D,G). Simultaneously, SB225002 could improve the antitumor effect of lenvatinib. However, mice that response poorly to lenvatinib would have a larger number of neutrophil infiltrations compared with mice that response well in lenvatinib group (online supplemental figure S1E,F). Besides, both anti-CXCL2 and anti-CXCL5 monoclonal antibodies significantly reduced neutrophil infiltration, and the antitumor effect improved after combined with lenvatinib, respectively (online supplemental figure S1H,I). We also discovered that lenvatinib combined with anti-CXCL5 antibodies (LEN+anti-CXCL5 Ab) significantly decreased the percentage of PD-L1+ neutrophils, and while combined with anti-CXCL2 antibodies (LEN+anti-CXCL2 Ab), lenvatinib significantly decrease PD-1+ CD8+ T cells (online supplemental figure S2A,B). However, no difference was observed on the percentage of CD69+ CD8+ T cells in either group (online supplemental figure S2A). As a result, in LEN+anti-CXCL5 Ab group, tumor burden was significantly larger in mice that failed to reduce neutrophils compared with that of successfully neutralized mice. This suggested that lenvatinib treatment increased the level of CXCL5 and promoted neutrophil infiltration, which in turn inhibited the efficacy of lenvatinib (online supplemental figure S2C). Taken together, our results show that after blocking the CXCL2/CXCL5-CXCR2 axis, neutrophil infiltration was reduced and promoted the antitumor effect of lenvatinib.
Supplemental material
The increased infiltration of neutrophils was confirmed with subcutaneous H22 tumor mouse model. Flow cytometric analysis showed an increase of CD11b+ Ly6G+ F4-80− cells following lenvatinib treatment. This result was reversed by PD-1 blockade (online supplemental figure S2D). This was further explored with orthotopic models in BALB/c mice. The results verified that after lenvatinib treatment, neutrophils significantly increased in TME. Moreover, this lenvatinib-induced neutrophilia was accompanied by decreased CD8+ cytotoxic T cells and increased expression of suppressive co-receptors PD-1, cytotoxic T-lymphocyte–associated antigen 4 (CTLA-4) and Tim-3 on the T cell surface (figure 1E, online supplemental figure S2F). PD-L1 expression on neutrophils, however, was not increased by lenvatinib (online supplemental figure S2E). In accordance to previous reports, the macrophage infiltration did not decrease, either (online supplemental figure S2G). We used immunofluorescence staining on HCC patient’s tumor samples to visualize the increased recruitment of MPO+ neutrophils in TME after lenvatinib treatment. This result was verified in orthotopic H22 mouse models relative to control groups following lenvatinib treatment after 14 days (figure 1F). To sum up, our results suggest that lenvatinib could promote neutrophil recruitment by inducing CXCL2 and CXCL5 secretion in TME. Neutrophilia was associated with a pronounced immunosuppressive CD8+ T cell which may, in turn, augment lenvatinib treatment resistance that is often seen in patients.
Neutrophils polarize to an immunosuppressive N2 type after entering TME
We used flow cytometry to analyze PD-L1 expression on TME infiltrating neutrophils. Results indicated that PD-L1+ neutrophils proportion was significantly higher in TME (upper panel) compared with the spleen (lower panel) (figure 2A,B). We isolated PD-L1+ neutrophils from TME and cocultured with splenic T cells. The results indicated that these neutrophils could modulate T cell phenotype and function by increasing the expression of inhibitory coreceptors PD-1, Tim-3 and CTLA-4 on T cells (upper panel—blue) compared with splenic T cells (lower panel—gray), as was shown in the T cells isolated from tumors (middle panel—red) (figure 2B, gating strategy outlined in online supplemental figure S3).
Supplemental material
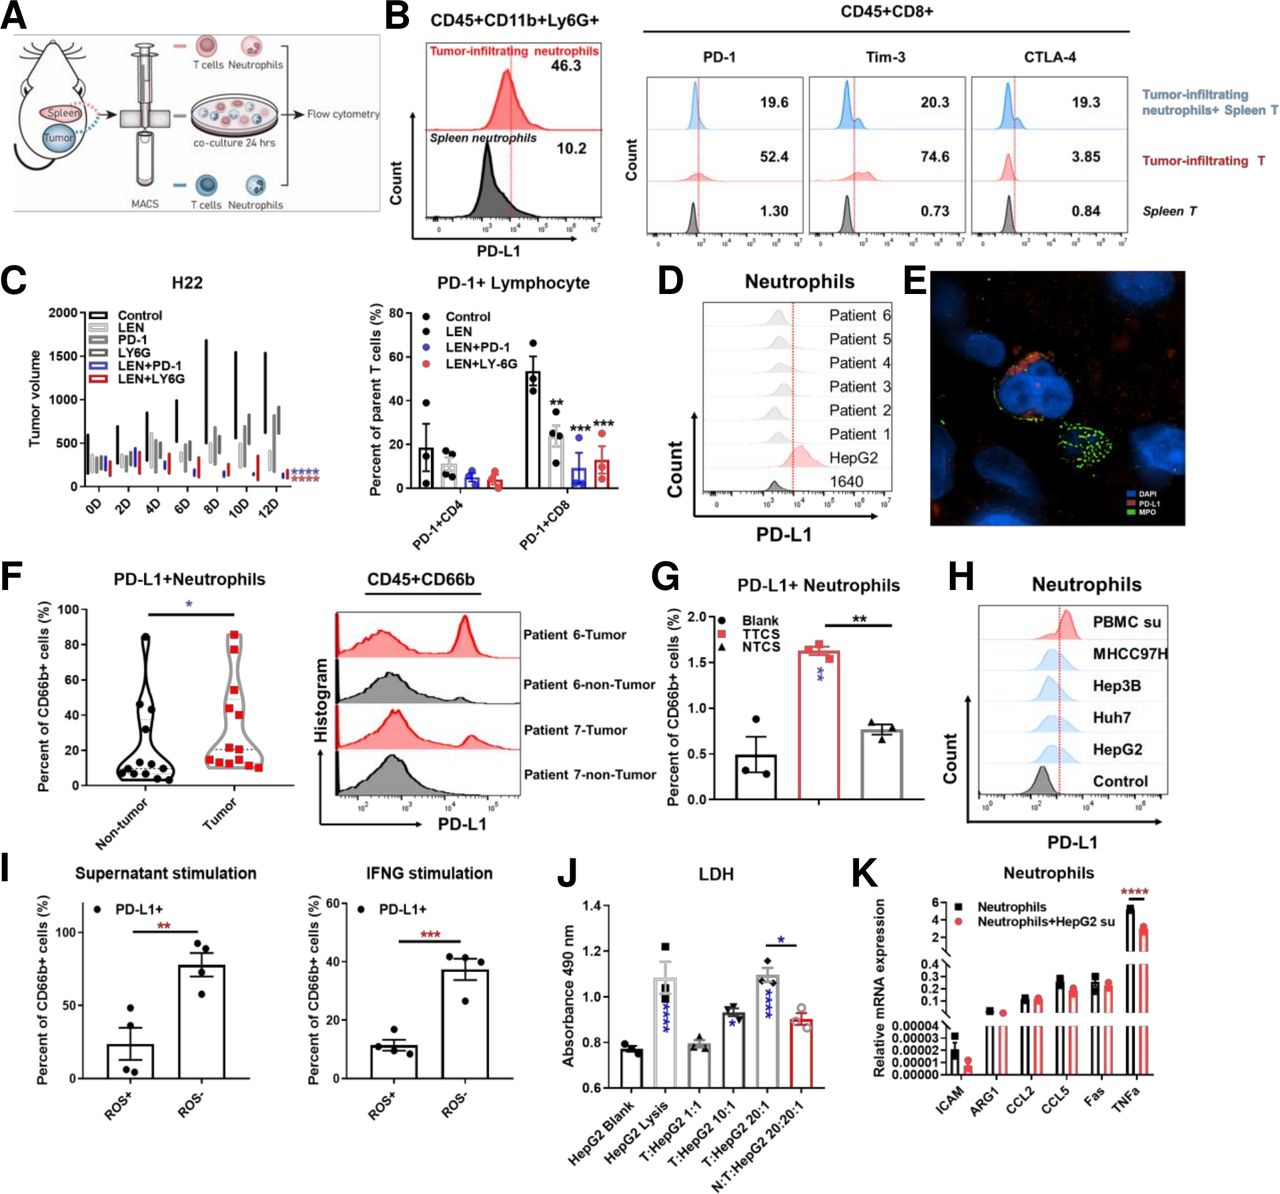
The effect of tumor-associated neutrophils on lenvatinib treatment in H22 BALB/c mice models and cytotoxicity of T cells in ex vivo the diagram and representative flow cytometry images showing the expression of PD-L1 on tumor infiltrating neutrophils and spleen neutrophils isolated from BALB/c mice models subcutaneously implanted with H22 cells (A, B). Representative flow cytometry images showing the expression of PD-1, Tim-3 and CTLA-4 on spleen T cells, tumor infiltrating T cells and spleen T cells cocultured with tumor infiltrating neutrophils isolated from BALB/c mice models subcutaneously implanted with H22 cells (B). Mean tumor volume for different treatments (control, lenvatinib, anti-PD1 antibody, anti-Ly-6G antibody, lenvatinib combining anti-PD1 antibody and lenvatinib combining anti-Ly-6G antibody) in BALB/c mice models subcutaneously implanted with H22 cells over 10 days of treatment (n=3 per group) and histogram showing the proportion of PD-1 +CD4 and CD8 cells in each treatment group (C). The expression of PD-L1 on neutrophils in peripheral blood isolated from HCC patients (D). Representative N-SIM image showing PD-L1 expression and MPO positive cells infiltration in HCC patients tissue samples (red: PD-L1; green: MPO; blue: DAPI) (E). Histogram (left) and representative flow cytometry images (right) showing the expression of PD-L1 on neutrophils infiltrating in tumor and non-tumor tissues isolated from HCC patients (F). Representative flow cytometry images (left) and histogram (right) showing the expression of PD-L1 on neutrophils stimulated by tumor tissue culture supernatant compared with non-tumor tissue culture supernatant (G). Representative flow cytometry images showing PD-L1 expression levels on neutrophils stimulated by supernatant derived from PBMC, MHCC97H, Hep3B, HUH seven and HepG2 for 24 hours (H). The correlation of PD-L1 expression and ROS production in neutrophils stimulated by HepG2 supernatant and IFNG assessed by flow cytometry (I). LDH assay for the effect of neutrophils on T cell cytotoxicity with different effector (T cells) and target (HepG2 cells) ratio in coculture system (J). Histogram showing the relative mRNA expression in neutrophils stimulated by HepG2 supernatant versus control (K). *P<0.05, **p<0.01, ***p<0.001, ****p<0.0001. HCC, hepatocellular carcinoma; IFNG, interferon gamma; LDH, PBMC, peripheral blood mononuclear cell; PD-1, programmed cell death-1; PD-L1, programmed cell death-1 ligand; ROS, reactive oxygen species.
We used anti-Ly-6G antibodies to induce experimental neutrophil depletion in the subcutaneous H22 tumor model. Neutrophil depletion enhanced local neutrophil infiltration and inhibited the antitumor effect of lenvatinib. The effect of neutrophil depletion on tumor growth was then assessed. Results showed that lenvatinib treatment unquestionably reduced tumor volume. On the other hand, anti-Ly-6G antibodies alone did not have a significant anti-tumor effect, however, when combined with lenvatinib a significant inhibition of tumor growth was observed (figure 2C). The synergistic effect of lenvatinib combined with neutrophil depletion was significant, even comparable to that of lenvatinib combined with PD-1 antibody treatment. In addition, we found that both lenvatinib combined with PD-1 monoclonal antibody and anti-Ly-6G antibody can reduce the proportion of PD-1+ T cells, thereby reversing the suppressive T cells phenotype in the subcutaneous models (figure 2C). This highlights a need for deeper understanding of neutrophils in the development of lenvatinib drug resistance.
Analysis of neutrophil isolated from HCC patient peripheral blood and tissue samples suggested that, compared with the peripheral blood, a significant upregulation of PD-L1 expression occurred as the neutrophils entered the TME (figure 2D–F, (Table S2)(online supplemental file 9). Simultaneously, we found that there were PD-L1+ and PD-L1- neutrophils in the microenvironment by observing the tumor infiltrating neutrophils with N-SIM microscope (figure 2E). PD-L1 expression was significantly induced by tumor tissue culture supernatant compared with non-tumor tissue culture supernatant extracted from HCC patients’ samples (figure 2G). Besides, we found that interferon (IFN)-B3; appears to be able to upregulate PD-L1 expression on neutrophils, and the expression can be further promoted by combining IFN-B3; and tumor cell culture supernatant (online supplemental figure S4A,B). In vitro stimulation of neutrophils with supernatants from HCC cell lines and IFN-B3; result in high PD-L1 expression and low ROS secretion levels in neutrophils (figure 2H,I).
Supplemental material
CD3+ T cells were purified and cocultured with neutrophils and HepG2 tumor cells in vitro to observe the crosstalk within the TME. The effect of tumor modulation of neutrophils on cytotoxic T cell function were also determined. Coculturing tumor cells with T cells led to tumor cell lysis, determined via LDH and CCK8 release in supernatant, in a T cell ratio dependent manner. The introduction of tumor-related neutrophils into the system significantly suppressed the tumor lytic function of T cells (figure 2J), demonstrating an ability of tumor resident neutrophils to regulate T cell function. To understand the effect of PD-L1 on neutrophil, we assessed ROS levels of N1 neutrophils following PD-L1 knockdown by si-PD-L1 (Si-01, 02 and 03). It was observed that ROS production increased when PD-L1 was reduced (online supplemental figure S4C). Furthermore, significant downregulation of the N1 marker TNFα occurred after neutrophils were coculture with tumor cells (figure 2K, Table S3)(online supplemental file 10). These results suggest that neutrophil migration from peripheral blood to localized tumor tissue led to PD-L1 upregulation. This in turn may modify local T cells to a more suppressive phenotype. Apart from IFN-B3, this is a process regulated by soluble factors released from tumor cells and results in the suppression of antitumor immunity. Fortunately, depletion of neutrophils by anti-Ly-6G antibodies synergized with lenvatinib treatment could reverse the suppressive pathway and led to enhance tumor volume reduction.
Lactate enters neutrophil via MCT1 and induce PD-L1 expression
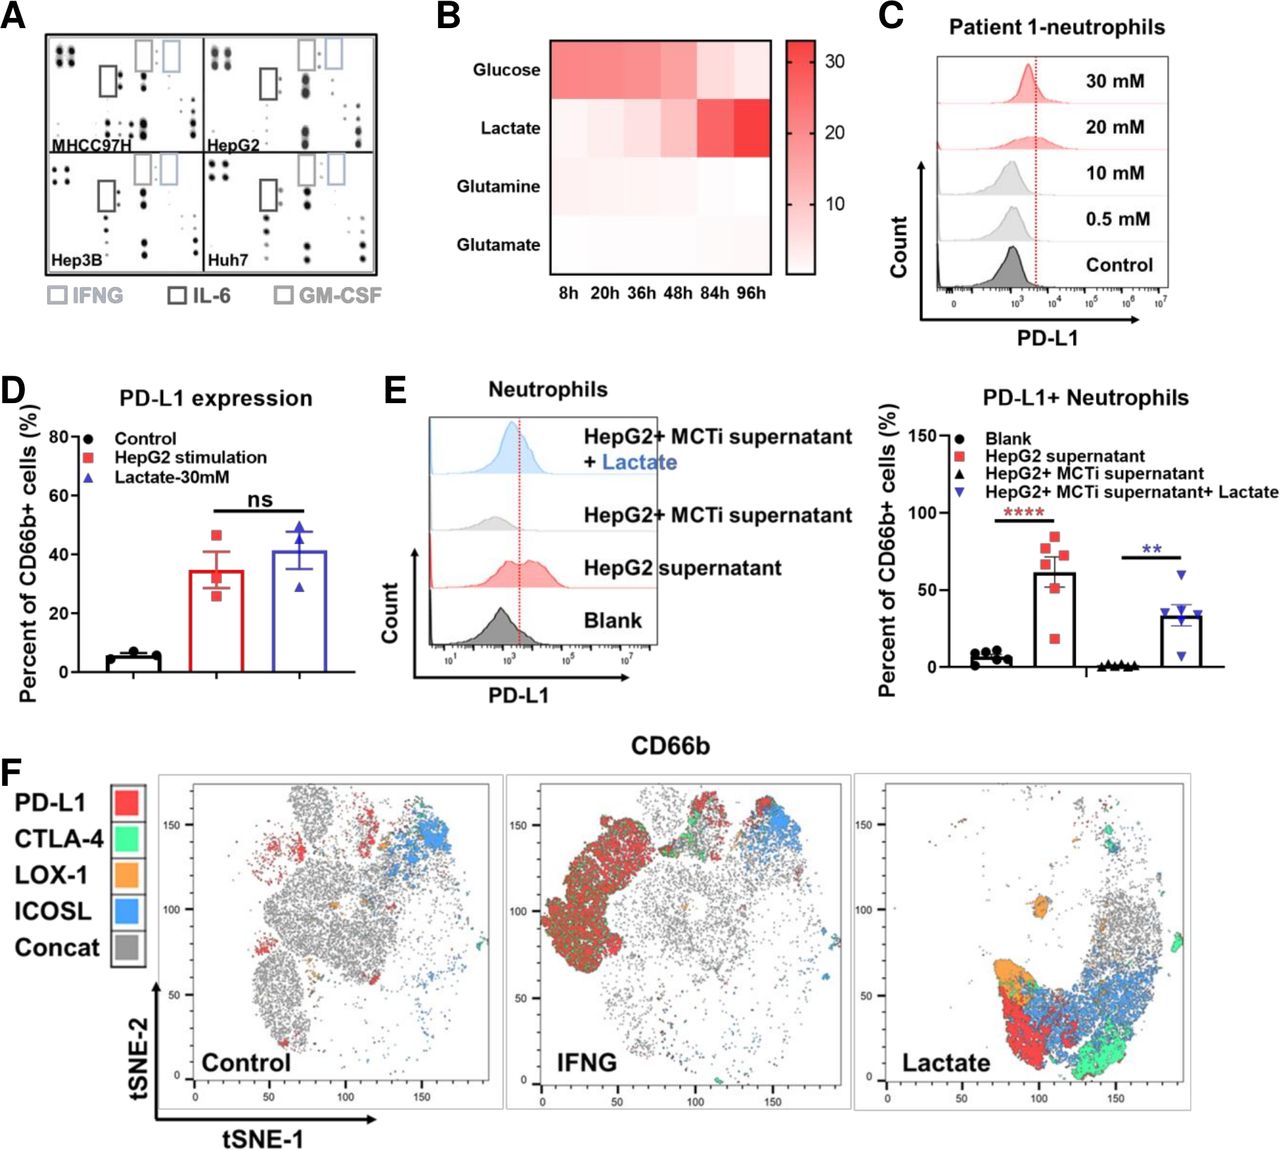
Previous studies have reported that tumor cells activate neutrophil STAT3 by secreting granulocyte-macrophage colony-stimulating factor (GM-CSF), inducing expression of PD-L1 on neutrophils to promote tumor progression.24 Utilizing an in vitro human model of HCC neutrophil modulation, we assessed the expression of PD-L1 on neutrophils stimulated by supernatant derived from several HCC cell lines. Conclusively, we found that the supernatants could induced PD-L1 expression. Unfortunately, experiment with proteome array indicated low level of cytokines in the supernatant (figure 3A, online supplemental figure S4D). In addition, IFN-B3, concentration was significantly higher in activated T cells compared with tumor cells (online supplemental figure S4E). However, in consistent to previous observations, recombinant GM-CSF indeed induced neutrophil PD-L1 expression in vitro (online supplemental figure S4F). Whereas neither TGFβ, the cytokine reported to polarize N1 to N2 type, nor prostaglandin E2 (PGE2), the cytokine reported to induce PD-L1 expression in tumor cells, could induce PD-L1 expression on neutrophils (online supplemental figure S4G).

The effect of lactate on PD-L1 expression on tumor-associated neutrophils. Human inflammation array analysis for supernatant derived from MHCC97H, Hep3B, HUH seven and HepG2 (A). YSI analysis for metabolites in the supernatant of HepG2 cultured at different time points (B). Representative flow cytometry images showing PD-L1 expression levels on neutrophils stimulated by lactate with different concentration (C). Histogram showing PD-L1 expression levels on neutrophils stimulated by supernatant derived from HepG2 and supplementary lactate (D). Representative flow cytometry images and histogram showing the PD-L1 expression on neutrophils isolated form HCC patients’ peripheral blood after stimulated by HepG2 supernatant, MCT inhibitor and lactate (E). t-SNE analysis by Flowjo for the expression of PD-L1, CTLA-4, LOX-1 and ICOSL on neutrophils stimulated by control, IFNG and lactate, respectively (F). **p<0.01, ****p<0.0001. HCC, hepatocellular carcinoma; IFNG, interferon gamma; IL-6, interleukin 6; ns, not significant; PD-L1, programmed cell death-1 ligand.
The function of lactate has drawn attention in the development of various cancers. It has been reported that lactate can induce PD-L1 expression on monocytes.25 26 We therefore measured the concentration of lactate in HepG2 cell culture supernatants and found that it exhibited a time-dependent increase (figure 3B). Besides, we respectively examined the tumor tissues, peritumor tissues and peripheral blood of HCC patients and found that lactate level in tumor and peritumor tissues were significantly higher than that of peripheral blood (online supplemental figure S5A). The lactate level was significantly higher in the tumors than that of the adjacent normal livers in the orthotopic mice models (online supplemental figure S5B). Notably, lenvatinib treatment could significantly increase lactate secretion of HepG2 and LM3 in vitro (online supplemental figure S5C). This phenomenon was consistent with the metabolic pathway enrichment in vivo (online supplemental figure S5D). RNA-seq analysis indicated an upregulation of glycolysis regulating genes in orthotopic Hepa1-6 tumor tissues after lenvatinib treatment (online supplemental figure S5E). Gene set enrichment analysis (GSEA) showed an enrichment on PI3K/AKT pathway (online supplemental figure S5F).
Supplemental material
Titration of the lactate applied to neutrophils demonstrated a threshold concentration of 10 mM for modulation of neutrophil PD-L1 expression. This was consistent with the concentration present in TME models (figure 3C). In order to understand how lactate alters PD-L1 expression on neutrophils, we used flow cytometry to compare neutrophils from HCC patients cultured with lactate alone or HepG2 supernatant. Results showed that the amount of PD-L1+ neutrophil was comparable in both groups (figure 3D). Moreover, it is known that monocarboxylate transporter (MCT) MCT1 and MCT4 are lactate receptors on neutrophils, and not GPR81.27 We therefore applied MCT1 inhibitor, α-cyano-4-hydroxycinnamic acid to verify lactate’s effect on PD-L1. As we expected, MCT1 inhibitor was proven to suppress the PD-L1 expression on neutrophils induced by HepG2 supernatant. This process could be rescued by adding lactate (figure 3E). Our further approach was to find the differences between IFN-B3; and lactate stimulated neutrophils. Results of tSNE analysis showed that IFN- γ could induce a larger number of PD-L1+ neutrophils, while lactate induced neutrophils had stronger CTLA-4, LOX-1 and ICOSL expressions (figure 3F).
Tumor-derived lactate activate NF-κB/Cox-2 pathway to induce PD-L1+ neutrophils
In order to investigate potential approaches to reverse the effect through targeting the increased expression of PD-1/L1 on neutrophils, we screened the ability of a range of pathway inhibitors to regulate phenotypic changes imparted on neutrophils. We assessed the PD-1/L1 expression axis on neutrophils isolated from HCC patients, and cultured with MHCC97H supernatants and treatment with: MEK inhibitor- U0126; ERK/RET inhibitor-lenvatinib; AKT inhibitor-ipatasertib; STAT1 inhibitor-fludarabine; WNT inhibitor- FH535; STAT3 inhibitor-C188-9 andnuclear factor kappa-light-chain-enhancer of activated B cells (NF-κB) inhibitor- BAY 11–7082. Among the compounds screened, we found that BAY 11–7082 demonstrated a certain ability to down-regulate the expression of PD-L1 stimulated by both supernatant and lactate (figure 4A, online supplemental figure S6A). GSEA analysis of the Hepa1-6 mouse orthotopic tumor tissue sequencing data suggested that NF-κB pathway were significantly up-regulated after lenvatinib treatment (figure 4B). Previous studies and bioinformatic analysis showed that RELA was tightly correlated with PTGS2. We used western blot and found that indeed, supernatants from tumor cells, HepG2 and MHCC97H, significantly upregulated expression of COX-2, while IFNG increased expression of the cytokine regulating factor p-STAT1 (figure 4C).
Supplemental material
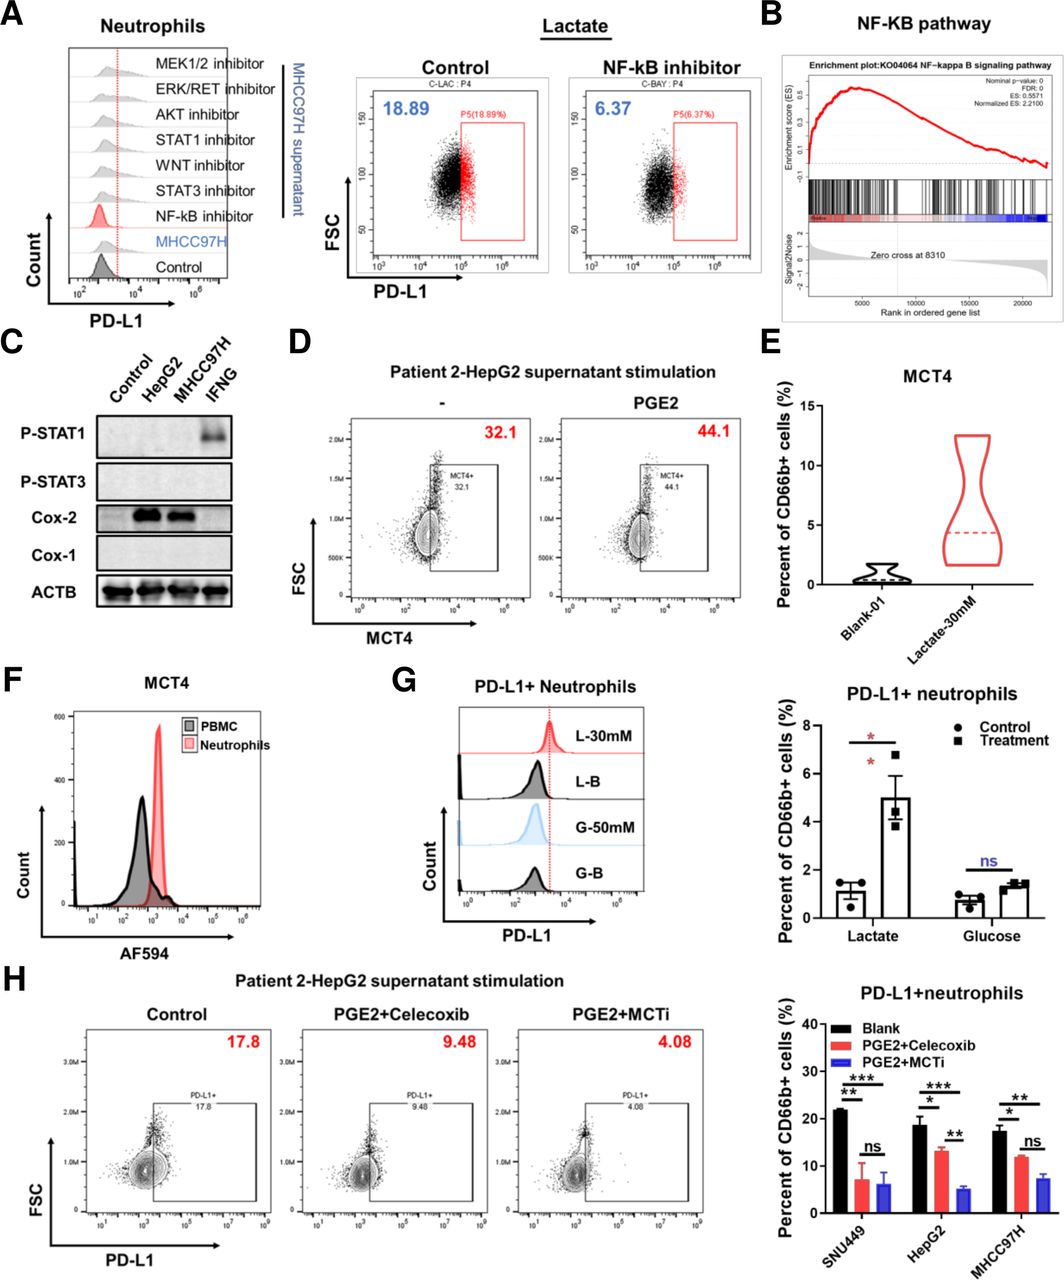
The effect of NF-κB-COX-2-PGE2 on PD-L1 and MCT4 expression. Representative flow cytometry images showing PD-L1 expression levels on neutrophils isolated from HCC patients stimulated by MHCC97H supernatant (left) treated with different inhibitors and stimulated by lactate and treated with Bay 11–7082 (right) (A). GSEA analysis of the orthotopic sequencing data of Hepa1-6 mouse model for NF-κB pathway (B). Western blot analysis for Stat1/3 and cox1/2 expression stimulated by the supernatant of HepG2 and MHCC97H, IFNG and GM-CSF respectively for 24 hours (C). Representative flow cytometry images showing MCT4 expression on neutrophils stimulated by PGE2 (10 uM) (D) and lactate (30 mM) (E). Representative flow cytometry images showing MCT4 expression on neutrophils and PBMC derived from the peripheral blood of HCC patients (F). Representative flow cytometry images and histogram showing PD-L1 expression on neutrophils stimulated by lactate (30 mM) and glucose (50 mM) (G). Representative flow cytometry images and histogram showing PD-L1 expression on neutrophils stimulated by supernatant derived from SNU449, HepG2, MHCC97H treated with or without celecoxib and α-cyano-4-hydroxycinnamic acid (H). *P<0.05, **p<0.01, ***p<0.001, ****p<0.0001. GSEA, Gene Set Enrichment Analysis; HCC, hepatocellular carcinoma; IFNG, interferon gamma; ns, not significant; PD-L1, programmed cell death-1 ligand.
The COX-2+ neutrophils produced PGE2 to execute immunosuppressive function and we found that PGE2 can also promote MCT4 expression on neutrophils (figure 4D). Simultaneously, high concentration lactate promoted MCT4 expression as also and assessment of MCT4 on the cell surface, determined higher expression on neutrophils compared with PBMC derived from the peripheral blood of HCC patients (figure 4E,F). On view of MCT4 responsible for endogenous lactate transport, to determine whether the endogenous or exogenous lactate induce PD-L1 expression, we tested it by flow cytometry after 50 mM glucose and hypoxia stimulation for 24 hours and found that only exogenous lactate could promote PD-L1 expression on neutrophils (figure 4G). Furthermore, PGE2 has been reported to promote lactate production via regulating HIF-1a. We used exogenous PGE2 to stimulate HepG2, SNU449 and MHCC97H cells and treated with celecoxib and MCT inhibitor, then we collected the supernatants to stimulate neutrophils. We found that inhibiting COX-2 and MCT could reduce lactate production and decrease PD-L1 expression (figure 4H, online supplemental figure S6B). In addition, the JAK inhibitor baricitinib treatment inhibited PD-L1 expression on neutrophils stimulated by IFNG (online supplemental figure S6C). Within this model, baracitinib was able to significantly reverse the suppression of neutrophil cytotoxity imparted by the TME, determined by LDH secretion assay, restoring antitumor capacity, further supported by CCK8 viability assay of tumor cells. (online supplemental figure S6D). However, JAK and STAT inhibition combined with lenvatinib in vivo showed no further effect compared with lenvatinib alone (online supplemental figure S6E). These results suggest that tumor-derived lactate induced PD-L1 expression via NF-κB-Cox-2 pathway and COX-2 inhibitor can both reduce lactate production and decrease PD-L1 expression on neutrophils.
Lactate-H+ expand neutrophil lifespan and contribute to enhancing PD-L1 expression
Lactate-derived acidic TME regulate immune cells extensively and previous studies reported that lactate-H +expand neutrophil lifespan.28 We used supernatants from HepG2 and MHCC97H compared with lactate stimulation and tested the apoptosis by flow cytometry. We found that both the supernatant and lactate can decrease apoptosis and this process was inhibited by celecoxib (figure 5A–D). To determine whether the lactate molecule or the H+induce PD-L1 expression, we used Na2CO3 to revert the acidic environment in culture medium and found that the induced PD-L1 expression was partially decreased (figure 5E). This meant lactate-H+ also attributed to PD-L1 expression.
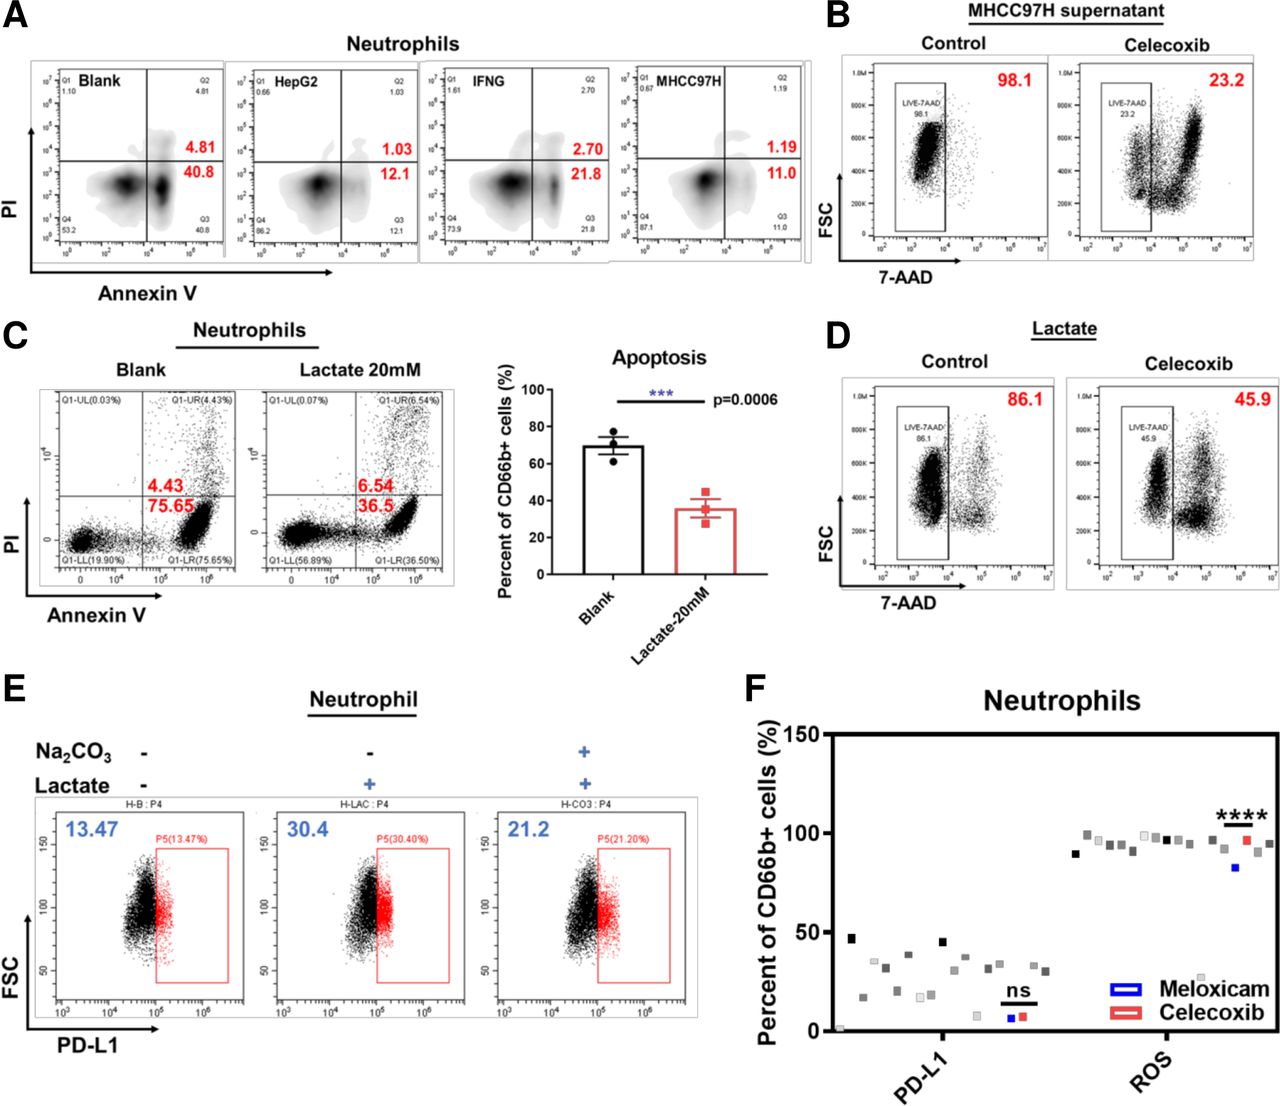
The effect of lactate-H+ on neutrophils. Representative flow cytometry images showing apoptosis of neutrophils stimulated by supernatant derived from HepG2 and MHCC97H and IFNG (A). Representative flow cytometry images showing lived neutrophils after stimulated by MHCC97H supernatant and treated with or without celecoxib (B). Representative flow cytometry images showing apoptosis of neutrophils stimulated by lactate (20 mM) (C). Representative flow cytometry images showing lived neutrophils after stimulated by lactate (20 mM) and treated with or without celecoxib (D). Representative flow cytometry images showing PD-L1 expression on neutrophils stimulated with or without Na2CO3 (1 mg/mL) and lactate (20 mM) (E). Dot plots showing PD-L1 expression levels on neutrophils and ROS production of neutrophils treated with different nonsteroidal anti-inflammatory drugs or stimulated by HepG2 supernatant assessed by flow cytometry (F). *P<0.05, **p<0.01, ***p<0.001, ****p<0.0001. IFNG, interferon gamma; ns, not signiicant; PD-L1, programmed cell death-1 ligand; ROS, reactive oxygen species; FSC, forward scatter.
To verify whether non-specific targeting of pan COX-1/COX-2 was superior to specific targeting of COX-2, we examined the effect of a panel of nonsteroidal anti-inflammatory drugs (NSAIDs) on PD-L1 expression and ROS secretion in neutrophils in vitro (Table S4)(online supplemental file 11). Our results showed that celecoxib, the specific COX-2 inhibitor, can not only significantly reduce PD-L1 expression in a dose dependent manner but also promote ROS secretion (figure 5F). Nevertheless, COX1/2 inhibitors had no significant effect on immune-checkpoint CTLA4 (online supplemental figure S7A). These suggest COX-2 inhibitor maybe used to address tumor-augmented and drug-augmented immunosuppression within the TME, enhancing the antitumor capacity of lenvatinib in vivo.
Supplemental material
Celecoxib improves the effect of lenvatinib by reducing neutrophil infiltration and PD-1 exhausted T cells
To identify the effect of lactate on lenvatinib treatment in vivo, we used 0.5% methyl cellulose, lenvatinib, lactate and the combined therapy to treat mice with orthotopic H22 liver cancer. We found that lactate treatment dramatically shrunken the survival and hampered the efficacy of lenvatinib (figure 6A). Further studies were conducted to determine the beneficial effect of combined lenvatinib and celecoxib treatment both in subcutaneous and orthotopic models, the combined therapy achieved the most effective outcome in both models without significant weight change (figure 6B, online supplemental figure S7B). The combined therapy could significantly reduce ascites occurrence (figure 6C). Intriguingly, in subcutaneous models, lenvatinib singly could reduce PD-1+ T cells consistent with our and others’ studies, whereas in orthotopic models lenvatinib would increase PD-1+ T cells. However, the combination therapy of lenvatinib with celecoxib or anti-Ly6G antibodies can reduce the infiltration of neutrophils and PD-1+ exhausted T cells (figure 6D). This was associated with modulation of chemokine secretion, especially CXCL5 (online supplemental figure S7C).
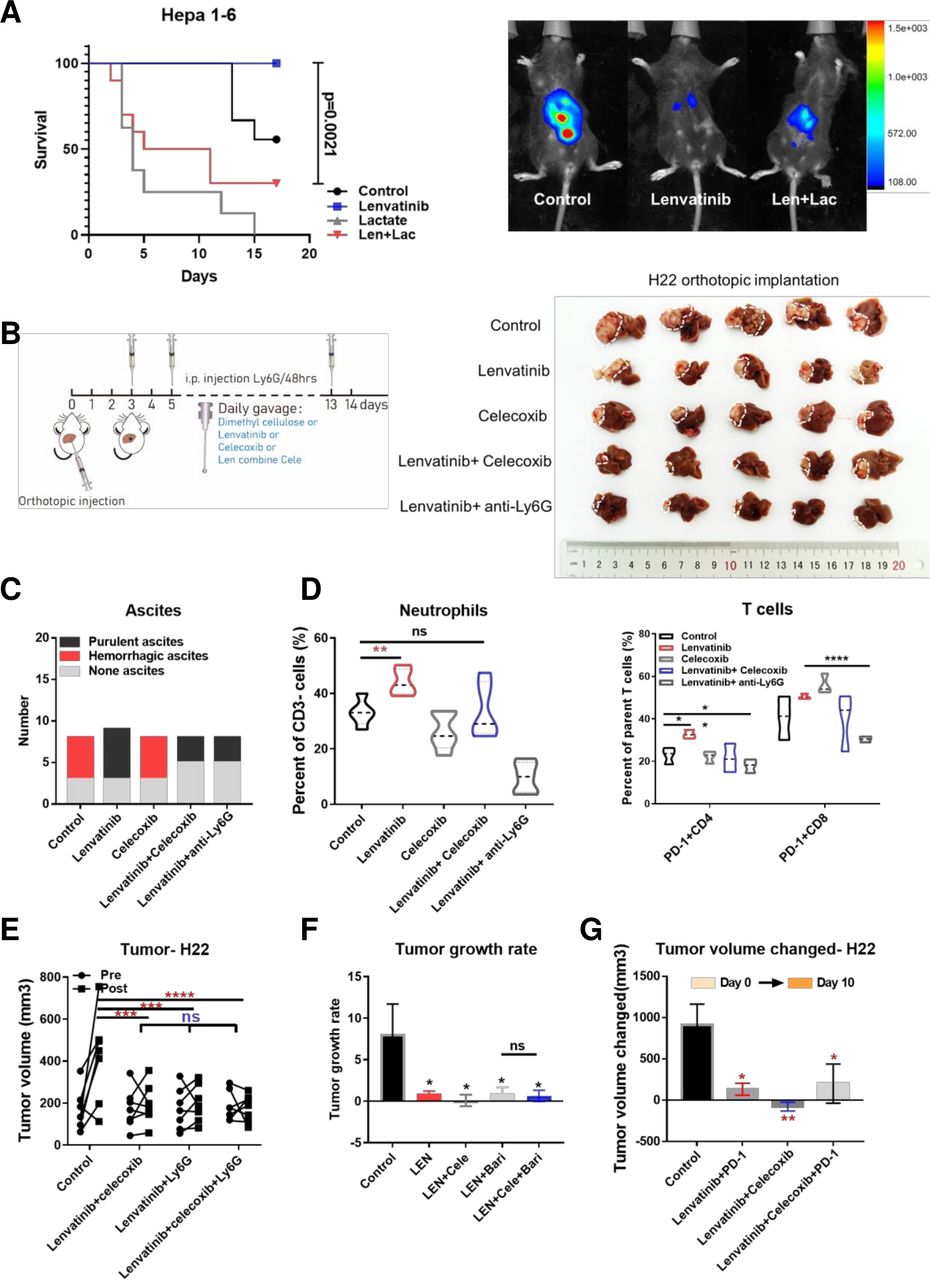
The effect of lenvatinib in combination with celecoxib in H22 BALB/c mice models. Survival for orthotopic murine models after 14 days of treatment by 0.5% methylcellulose, lenvatinib (10 mg/kg), lactate (0.5 g/kg), lenvatinib combined with lactate (A). Treatment pattern diagram for murine models and tumor tissue samples in orthotopic liver after 14 days of treatment by 0.5% methylcellulose, lenvatinib (10 mg/kg), celecoxib (50 mg/kg), lenvatinib combined with celecoxib or anti-Ly6G antibodies (per 48 hours) (B). Histogram showing the occurrence of ascites in different treatment group (C). Histogram showing infiltration of neutrophils (left) and PD-1+ T cells (right) in each treatment group (D). Tumor volume before and after 10 days of treatment by lenvatinib combined with celecoxib, Ly6G antibodies and the triple combination for BALB/c mice subcutaneously implanted with H22 cells (n=7 per group) (E). Tumor growth rate over 10 days of treatment by lenvatinib, lenvatinib combined with baricitinib, celecoxib respectively and the triple combination for BALB/c mice models subcutaneously implanted with H22 cells (n=7 per group) (F). Tumor volume changed before and after 10 days of treatment by lenvatinib combined with celecoxib, PD-1 antibodies and the triple combination for BALB/c mice subcutaneously implanted with H22 cells (n=7 per group) (G). *P<0.05, **p<0.01, ***p<0.001, ****p<0.0001. PD-1, programmed cell death-1; ns, not significant.
We tested the role of neutrophils in the combined therapy via removal of neutrophils from the system, through combined use of an anti-Ly6G antibody in the in vivo H22 tumor model. The experiments showed that the antitumor effects of combined lenvatinib/celecoxib treatment were not enhanced through removal of neutrophils with LY6G treatment, with the combination alone offering the same efficacy of lenvatinib and lenvatinib/celecoxib (figure 6E). We further used baricitinib to inhibit IFNG-induced PD-L1 expression and the combined therapy also showed no enhanced effect in subcutaneous models (figure 6F). To compare the antitumor effect of lenvatinib with or without celecoxib combined with PD-1 blockade, we conducted further in vivo studies using the H22 murine model. We found that the effects of the two combined lenvatinib/celecoxib treatments were comparable to lenvatinib plus PD-1 blockade or the combination plus PD-1 blockade (figure 6G), with no adverse effect on body weight. This suggests that celecoxib treatment is fully capable of mitigating the inhibitory effects of the neutrophils in TME crosstalk.
Discussion
The combination of vascular regulation and immunotherapy has yielded promising results for advanced HCC patients. High ORRs have been achieved with both bevacizumab (65.0%) and lenvatinib (42.3%) combined with anti-PD-1/PD-L1 antibodies.8 29–31 Although these combined therapies are promising, it should be noted that immunotherapies are expensive, putting huge economic pressure on many patients. At the same time, the heterogeneity of tumors and the existence of multiple suppressive immune microenvironments may hinder the effect of immune combination. It is therefore crucial to seek more options to treat HCC.
In our study, we found that lenvatinib stimulate CXCL2, CXCL5 to promote the infiltration of neutrophils. Once neutrophils enter TME, PD-L1 expression on neutrophils is up-regulated by various factors including IFN-B3; and lactate. The tumor-derived supernatant induced PD-L1+ neutrophils tend to polarize into N2 phenotype, suppressing antitumor immunity.
Lenvatinib has an extensive effect on TME. On one hand, in our previous study, we showed that lenvatinib could reduce the infiltration of PD-1+T cells and led to long-term immune memory formation in subcutaneous mice models. This conclusion was cohesive to previous reports.1 2 On the other hand, however, the study in anaplastic thyroid cancer (ATC) showed that lenvatinib monotherapy increased polymorphonuclear myeloid-derived suppressor cells. These cells play a negative role in ATC’s response to lenvatinib.32 Taken together, these results suggested that lenvatinib is a double-edged sword, its immunomodulatory effect on TME is not only stimulative but also suppressive. It is, therefore, possible to enhance the anti-tumor effect of lenvatinib by specifically targeting the immunosuppressive factors. Future directions for lenvatinib combination therapy should be guided accordingly.
Our previous knowledge of neutrophils is often context dependent and even frequently divergent.14 This perhaps indicates an enormous research potential for neutrophils. Recently, many studies focus on the formation of NETs, but there are more to study on neutrophils regulation in TME.33 For example, neutrophils can diminish T-cell immunity and is correlated with poor prognosis in cancers.24 34 Besides, in our research, we found that tumor secretion and inflammatory factors can prolong the survival of neutrophils. This indicates that neutrophils may have a wider range of influence in TME.
In spite of the prolong of lifespan, neutrophils remain to be the vanguard of acute immune reactions. In order to response rapidly, the metabolic reprogramming must play an important role in neutrophils. Various studies have reported different metabolic pathways in respiratory burst, chemotaxis, and apoptosis of neutrophils. For-long neutrophils have been believed to depend mainly on glycolytic metabolism.35 The role of the productions of glycolysis on neutrophils, however, is yet to be explored. Recent studies found that lactate is more than a metabolic waste, it can also be converted to fuel metabolism through Krebs cycle. Accumulation of lactate in the microenvironment is a feature of cancer, and previous studies have demonstrated the interaction of lactate with NETosis. Nonetheless, lactate as a signal intracellularly have never been reported in neutrophils, with several reference in tumors and macrophages.25 36 In our study, we found that tumor-derived lactate could induced PD-L1 expression via NF-κB/COX-2 pathway. Simultaneously, lactate-H +could expand neutrophils lifespan and partially promote PD-L1 expression. This elucidated the interaction between metabolic reprogramming and immune regulation in neutrophils and provided a novel method of remodeling TME. Notably, we also found that PD-1 antibodies could decrease the expression of COX-2 in tumors (online supplemental figure S7D). Our study on PD-L1+ neutrophils provides a novel perspective to understand the effect of combination therapy with lenvatinib and PD-1 antibodies.
COX-2/PGE2 can not only regulate PD-L1 expression, but also activate recruitment of neutrophils, and neutrophils can synthesize PGE2 to affect immunity.37–40 Targeting COX-2 by celecoxib could therefore decrease neutrophils infiltration and improve tumor killing function of neutrophils. In addition, celecoxib may also exert an antitumor effect through various mechanisms, such as antiangiogenic effects or stem cells proportion reduction.33 41 42 Triple-drug combination of lenvatinib with celecoxib and anti-Ly6G antibody, however, did not show better results than lenvatinib combined with celecoxib. This suggests that lenvatinib combined with celecoxib may mainly rely on reducing neutrophils especially PD-L1+ neutrophils to promote anti-tumor immunity.
Celecoxib is a small molecule inhibitor and it is cheap, convenient, and relatively safe. An HCC patient in our department with ankylosing spondylitis who has long-term administration of celecoxib achieved a prolong stable disease after lenvatinib treatment for almost 1 year, and is continuously followed up. Immunofluorescence showed that there were a few MPO+ cells infiltrated in the microenvironment (online supplemental figure S7E). Previous clinical usage of celecoxib was limited by adverse reactions such as GI bleeding, but the practice of the IMBRAVE150 study proved that as long as adequate inspection measures are taken to screen out suitable applicable populations, previous restricted drugs can also provide possibilities in cancer treatment. It is worth noting that it is difficult to use immunotherapy for relapsed patients with transplantation, and the combination of small molecule inhibitors provides them with a more effective choice.
In our study, we also found that IFN-B3 can upregulate the expression of PD-L1 on neutrophils in vitro by activating the JAK-STAT pathway.24 However, no significant effect of lenvatinib in combination with JAKS/STAT inhibitors was observed in vivo, which may be due to the fact that both JAK and STAT inhibitors can inhibit IFN-B3; pathway. Future study on dose and duration of these inhibitors is however required. Besides, our observation period was relatively short, and the effect of reduction of SP/CD44+ tumorigenic cells treated by targeting Jak/Stat pathway on long-term survival was not observed.43
In brief, our study reveals the lenvatinib-mediated recruitment and infiltration of neutrophils negatively affects the activation of T cells, thereby limiting the antitumor effect of lenvatinib in HCC. Tumor-derived lactate induces PD-L1 expression on neutrophils via MCT1/NF-κB/COX-2 and targeting COX-2 by celecoxib enhanced lenvatinib efficacy (figure 7). Previous studies about lenvatinib mainly used subcutaneous models and these would exaggerate the efficacy of lenvatinib because of the insufficiency of blood supply in subcutaneous compared with orthotopic models. However, we performed both models. We found that the effect of lenvatinib on CD8+ T cells infiltration and PD-1 expression on T cells was contradictory and is worth future exploration. There are limitations in our study that should be mentioned. The HCC models adopted in this experiment did not recreate the inflammatory microenvironment associated with causes of liver cirrhosis such as hepatitis. Synergistic effect of combination therapy should be considered, and we should investigate different dose schedules in future study. Furthermore, we did not verify the intracellular pathway by knockdown or knockout in neutrophils because of the technical difficulties and the intention that we want to screen a systematic drug to use in clinical. In conclusion, our study highlights the role of lactate induced PD-L1+ neutrophils in resistance to lenvatinib treatment and may result in a significant therapeutic benefit for HCC patients.

Major findings in graphical form.
Data availability statement
The datasets supporting the conclusions of this article are available in the Research Data Deposit repository, http://www.researchdata.org.cn/. The RDDN of the dataset for this study is RDDB2021001079. All data are available on reasonable request.
Ethics statements
Ethics approval
The present study was performed in accordance with the Declaration of Helsinki. Approval for the use of human subjects was obtained from the research ethics committee of Sun Yat-sen University Cancer Center and informed consent was obtained from each individual enrolled in this study. All animal experiments were approved by the Animal Ethics Committee of Sun Yat-sen University.
Acknowledgments
Thanks to the selfless help of Zhou lab, the strong support of the patients in this experiment, and the sacrifice of experimental animals for scientific inquiry.
References
Supplementary materials
Supplementary Data
This web only file has been produced by the BMJ Publishing Group from an electronic file supplied by the author(s) and has not been edited for content.
Footnotes
HD, AK, NL and MH contributed equally.
Contributors HD and AK was responsible for visualization, validation and writing; NL and MH were responsible for resources and validation; XH, SQ, SL, WL, QX, HC, JL and XJ helped for investigation; QC and SL was responsible for formal analysis; ZZ was responsible for methodology; MZ was responsible for conceptualization and supervision.
Funding This work was primarily supported by National Key Research and Development Project (2019YFC1316204), National Natural Science Foundation of China (No. 81771956) and the National Natural Science Foundation of Guangdong (2017A020215149 and 2019A1515010751). Editorial support for the writing of this manuscript was paid for by Eisai and provided by Jake Burrell, PhD (Rude Health Consulting).
Competing interests None declared.
Provenance and peer review Not commissioned; externally peer reviewed.
Supplemental material This content has been supplied by the author(s). It has not been vetted by BMJ Publishing Group Limited (BMJ) and may not have been peer-reviewed. Any opinions or recommendations discussed are solely those of the author(s) and are not endorsed by BMJ. BMJ disclaims all liability and responsibility arising from any reliance placed on the content. Where the content includes any translated material, BMJ does not warrant the accuracy and reliability of the translations (including but not limited to local regulations, clinical guidelines, terminology, drug names and drug dosages), and is not responsible for any error and/or omissions arising from translation and adaptation or otherwise.