Article Text

Abstract
Background T cell engagers are bispecific antibodies recognizing, with one moiety, the CD3ε chain of the T cell receptor and, with the other moiety, specific tumor surface antigens. Crosslinking of CD3 upon simultaneous binding to tumor antigens triggers T cell activation, proliferation and cytokine release, leading to tumor cell killing. Treatment with T cell engagers can be associated with safety liabilities due to on-target on-tumor, on-target off-tumor cytotoxic activity and cytokine release syndrome (CRS). Tyrosine kinases such as SRC, LCK or ZAP70 are involved in downstream signaling pathways after engagement of the T cell receptor and blocking these kinases might serve to abrogate T cell activation when required (online supplemental material 1). Dasatinib was previously identified as a potent kinase inhibitor that switches off CAR T cell functionality.
Methods Using an in vitro model of target cell killing by human peripheral blood mononuclear cells, we assessed the effects of dasatinib combined with 2+1 T cell bispecific antibodies (TCBs) including CEA-TCB, CD19-TCB or HLA-A2 WT1-TCB on T cell activation, proliferation and target cell killing measured by flow cytometry and cytokine release measured by Luminex. To determine the effective dose of dasatinib, the Incucyte system was used to monitor the kinetics of TCB-mediated target cell killing in the presence of escalating concentrations of dasatinib. Last, the effects of dasatinib were evaluated in vivo in humanized NSG mice co-treated with CD19-TCB. The count of CD20+ blood B cells was used as a readout of efficacy of TCB-mediated killing and cytokine levels were measured in the serum.
Results Dasatinib concentrations above 50 nM prevented cytokine release and switched off-target cell killing, which were subsequently restored on removal of dasatinib. In addition, dasatinib prevented CD19-TCB-mediated B cell depletion in humanized NSG mice. These data confirm that dasatinib can act as a rapid and reversible on/off switch for activated T cells at pharmacologically relevant doses as they are applied in patients according to the label.
Conclusion Taken together, we provide evidence for the use of dasatinib as a pharmacological on/off switch to mitigate off-tumor toxicities or CRS by T cell bispecific antibodies.
- drug therapy
- combination
- cytokines
- inflammation
- t-lymphocytes
- cytotoxicity
- immunologic
- preclinical
- immunotherapy
- lymphocyte activation
- drug evaluation
Data availability statement
The authors declare that all relevant data to the study are included in the article or uploaded as online supplemental information.
This is an open access article distributed in accordance with the Creative Commons Attribution Non Commercial (CC BY-NC 4.0) license, which permits others to distribute, remix, adapt, build upon this work non-commercially, and license their derivative works on different terms, provided the original work is properly cited, appropriate credit is given, any changes made indicated, and the use is non-commercial. See http://creativecommons.org/licenses/by-nc/4.0/.
Statistics from Altmetric.com
- drug therapy
- combination
- cytokines
- inflammation
- t-lymphocytes
- cytotoxicity
- immunologic
- preclinical
- immunotherapy
- lymphocyte activation
- drug evaluation
Background
T cell bispecific antibodies (TCBs) or T cell engagers are bispecific antibodies that, with one binding moiety, recognize a tumor antigen expressed on tumor cells and, with the other binding moiety, the T cell receptor resulting in T cell activation and subsequent tumor cell killing.1–5 We have described potent 2+1 TCBs, for example, cibisatamab (CEA-TCB)6 7 or glofitamab (CD20-TCB),8 based on a 2+1 format with one binder to the CD3ε chain of the T cell receptor and two binders to the specific tumor antigens. Their Fc region enables a longer half-life and is engineered with P329G LALA mutations to prevent FcγR signaling.9 10 Crosslinking of the CD3ε chain with tumor antigens by simultaneous TCB binding triggers T cell activation, proliferation and cytokine secretion.6 7 In contrast to chimeric antigen receptor (CAR) T cells, TCBs represent an “off the shelf” therapy to eradicate tumors.1 11 12 While lineage-specific antigens like CD19, CD20 or BCMA can be targeted with CAR T cells or TCBs as the respective cell types expressing these antigens are non-essential, the targeting of solid tumor antigens in epithelial tumors is more challenging due to their broader expression in normal tissues resulting in potential undesired on-target off-tumor toxicity.13
One of the most common mode-of-action related toxicities reported with T cell engagers is cytokine release syndrome (CRS).14 This complex clinical syndrome is featured by fever and in the most severe cases by hypotension and/or hypoxia.15 CRS is linked to a strong release of pro-inflammatory cytokines by T cells producing TNF-α, IFN-γ and GM-CSF16 17 and by myeloid cells producing TNF-α, IL-1β and IL-6.18–21
Several problems of toxicity grading of CRS were addressed as summarized in a recent publication of a consensus grading scale,22 mainly driven by treatment interventions, with severe cases easily classified if managed with pressors and/or high-flow oxygen devices. Management of severe CRS also requires appropriate supportive care, high-dose glucocorticoids and benefit from anti-IL-6R/IL-6 treatment such as tocilizumab or silixumab.16 23 24
Another problematic toxicity to manage in the clinic is represented by off-tumor off-target toxicity as observed with TCRs in the context of adoptive T cell therapy. A clinically relevant example of the risks associated with TCR-based therapies in the context of adoptive T cell therapy was identified when an unexpected cross-reactivity of an enhanced affinity TCR targeting an HLA-A*01-restricted epitope from MAGE-A3 resulted in severe cardiovascular toxicity through recognition of an unrelated HLA-A*01-associated peptide, A1-Titin.25 Similarly, a MAGE-A3 peptide-specific TCR for adoptive T cell therapy demonstrated an undetected cross-reactivity with MAGE-A12 responsible for severe neurotoxicity.26 A rapid blockade of T cell activation/proliferation at onset of the off-target toxicity would have been essential to stop such life-threatening toxicities. Recombinant TCR-based T cell engagers or TCR-like TCBs targeting intracellular proteins presented by MHC class I have the potential inherent risk of recognizing related undesired peptides in the context of MHC presentation. Furthermore, on-target off-tumor toxicity may also occur when the tumor-associated antigens (TAAs) are expressed on healthy cells like in epithelial tissues, which may potentially trigger cell death and inflammation, resulting in irreversible tissue damage and compromising the patient’s safety.
Tyrosine kinases such as Lck, Fyn (Src family of protein kinases) or ZAP70 are involved in downstream T cell activation signaling pathways after engagement of the CD3ε chain of the T cell receptor.27 Blocking these kinases might counteract T cell activation. Recently, screening of tyrosine kinase inhibitor (TKI) libraries was performed in an effort to identify TKI candidates inhibiting CAR T cell proliferation and activation.28 Mestermann et al29 and Weber et al30 identified dasatinib as a potent candidate that switches off CAR T cell functionality by inhibiting Src/Lck phosphorylation and NFAT signaling.31 Using an in vitro model of target cell killing by human peripheral blood mononuclear cells, we assessed the reversible effects of dasatinib combined with CEA-TCB, as an example of a solid-tumor targeting TCB,7 CD19-TCB, as an example of blood cancer targeting TCB, or HLA-A2 WT1-TCB, as an example of TCR-like TCB on T cell activation and proliferation, target cell killing and cytokine release. “Killing assays” testing the dose-response effects of dasatinib were conducted to define the threshold at which TCB-induced T cell activation was fully inhibited. In humanized NSG mice, the combination of dasatinib with CD19-TCB successfully prevented TCB-mediated B cell depletion. These counteracting effects can be obtained at dasatinib concentrations corresponding to clinically relevant doses. Our data show that dasatinib can act as a reversible on/off switch for TCB-mediated T cell cytotoxicity and cytokine release. Dasatinib could be used either to block TCB-induced T cell activation in case of tissue toxicities or to reduce cytokine release if CRS symptoms are not manageable with standard interventions, as an alternative to TNF-α or IL-6R blockade.19 32 Graphical Abstract has been provided as online supplemental material 1.
Supplemental material
Methods
Reagents and antibodies
CEA-TCB (cibisatamab), HLA-A2 WT1-TCB (RG6007), CD19-TCB and DP47-TCB were produced internally in the 2+1 TCB format previously described (Bacac et al, CCR for CEA and CD20-TCBs). Dasatinib (S1021) was purchased from Selleckchem.
Cell culture
The SKM-1 cell line (DSMZ# ACC547) is a human acute myeloid leukemia cell line. The cells were cultured in RPMI (11875101; Gibco) containing 20% FBS (26140079; Gibco) and split every 3 to 4 days (to 0.6 million cells/mL). To ensure sufficient MHC I levels, cells were used in an assay 1–2 days after passaging. For the Incucyte experiment, SKM-1 labeled with NucLightRed (NLR) were used.
The NLR-labeled A375 cell line is an adherent melanoma cell line which is HLA-A2 and WT1 positive. It was transduced with a vector coding for histone-staining red fluorescent protein. The cells were cultured in DMEMF12 (11320033; Gibco) containing 10% FBS (26140079; Gibco) supplemented with 6 µg/mL puromycin and split every 3 to 4 days (to 20,000 cells/cm2). Cells were plated 1 day prior to the assay and pulsed with RMF peptides 2 hours before starting the assay.
The NLR-labeled MKN45 cell line is an adherent human gastric cancer cell line, which expresses high levels of the CEA antigen. It was transduced with a vector coding for histone-staining red fluorescent protein. The cells were cultured in RPMI Glutamax (61870036; Gibco) containing 10% FCS and split every 3 to 4 days (50,000 cells/cm2). The cells were plated 1 day prior to the assay.
The SU-DHL-8 cell line is a human large cell lymphoma cell line derived from peritoneal effusion in a 59-year-old male Caucasian patient (ATCC catalog number CRL-2961). The cells were cultured in RPMI (11875101; Gibco) containing 10% FBS (26140079; Gibco) and split every 3 to 4 days (to 0.8 million cells/mL).
Cell line authentication was performed at Microsynth.
PBMCs isolation
Peripheral blood mononuclear cells (PBMCs) were isolated from buffy coats donated by healthy donors (blood donation center in Zürich, in accordance with the Declaration of Helsinki) by Ficoll density gradient. Briefly, blood from buffy coat was diluted 1:1 with PBS and about 25 mL was layered on 15 mL of Ficoll (17-5442; GE-Healthcare) and centrifuged for 30 min at 2000 rpm without break. Lymphocytes were collected with a 10 mL pipette in a 50 mL tube, rinsed with PBS, and successively centrifuged at 1700 rpm (5 min), 1500 rpm (5 min), 1100 rpm (10 min) and 900 rpm (10 min) to remove remaining platelets.
Preparation of effector cells
PBMCs were counted and then adjusted to either 0.4×10⁶ cells/mL, 1.0×10⁶ cells/mL, 2.0×10⁶ cells/mL or 6.0×10⁶/mL in assay medium. Then 50 µL of the cell suspension was transferred to the wells of the assay plates, corresponding to 20,000, 50,000, 100,000 or 300,000 cells/well.
Preparation of antibodies and dasatinib solution
HLA-A2 WT1-TCB, CEA-TCB, DP47-TCB and CD19-TCB were diluted in assay medium. A series of eight dilutions (1:10) was prepared by transferring and mixing 100 µL of 400 nM TCB solution to the subsequent wells containing 900 µL of assay medium. A 20× dasatinib solution was prepared in PBS from a 10 mM DMSO stock solution and transferred into the wells (10 µL/well).
For in vivo administration, dasatinib was formulated in 10% DMSO, 30% PEG300, 5% Tween 80% and 55% H2O in a stock solution of 10 mg/mL
Preparation of adherent tumor target cells
One day before the assay, adherent NLR-labeled A375 or NLR-labeled MKN45 target tumor cells were detached from the plate using 0.05% trypsin (25300096; Gibco). Cells were washed with PBS and the counts of viable cells (>90%) were determined by Trypan Blue staining using an EVE cell counter. Cells were re-suspended in pre-warmed assay medium (37°C) to obtain a cell density of 50,000 cells/mL. Then 100 µL of the cell suspension was transferred into a 96-flat-bottom well plate, corresponding to 5000 target cells per well.
Preparation of non-adherent tumor target cells
On the day of the assay, SKM-1 or SU-DHL-8 tumor cells were washed with PBS and the counts of viable cells were determined by Trypan Blue staining using an EVE cell counter (>90%). If required, the cells were labeled with Cell Trace CTV (C34557; Thermo Fisher) or CFSE (C34554; Thermo Fisher). Cells were re-suspended in pre-warmed assay medium (37°C) to obtain a cell density of 200,000 cells/mL. Then 100 µL of the cell suspension was transferred into a 96 U-bottom well plate, corresponding to 20,000 target cells per well.
For the Incucyte experiments, NLR-labeled SKM-1 cells were attached to a 96-well plate using rectronectin from Takara. Flat-bottom 96-well plates were coated with 50 µL of a rectronectin stock solution of 10 µg/mL (45 min, RT). The plates were washed with PBS, and the cells were plated (45 min, 37°C) before the assay.
Labeling of tumor cells
SKM-1 tumor cells were washed once with sterile PBS and labeled with Cell Trace CTV (C34557; Thermo Fisher) or CFSE dye (C34554; Thermo Fisher) (5 µM, 20 min at RT), washed with RPMI+20% FBS and counted.
Preparation of the killing assay
In assays with 20,000 SKM-1 tumor cells/well, 50 µL of the effector cell suspension (20,000, 100,000 or 200,000 cells/well) were added, followed by 50 µL of the antibody solutions. The final E:T ratio was 1:1, 5:1 or 10:1 and the total volume per well was 200 µL. The assay plates were covered with lids, and placed in the incubator, 37°C, 5% CO2.
Preparation of the killing assay using the Incucyte
The assay medium of tumor cells was replaced with fresh medium (100 µL/well). Then 50 µL of the effector cell suspension (50,000 cells/well) followed by 50 µL of the antibody dilutions were added to the assay plates containing 5000 adherent target cells/well. The E:T was approximately 10:1 and the total volume per well was 200 µL. The assay plates were incubated in the Incucyte for measurements of total red area/well every 3 hours, at 37°C, 5% CO2.
Flow cytometry readout: T cell activation and B cell count
At the assay endpoint, PBMCs were washed twice in PBS (1500 rpm, 5 min, RT) and stained with the following markers: CD4 (APC-Cy7, 317418; Biolegend), CD8 (BV605, 344742; Biolegend), CD25 (BUV395, 564034; BD), CD69 (PE, 310306; Biolegend) and Live Dead Near Infra Red (NIR) (L10119; Thermo Fisher) for 30 min at 4°C in FACS buffer. For blood staining, 25 µL of blood was lysed twice using BD Pharm Lyse buffer (555899; BD) (200 µL, 10 min, RT) and stained with the following markers: CD45 (Alexa 700, 304119; Biolegend), CD20 (APC, 302309; Biolegend) and Live Dead NIR (L10119; Thermo Fisher) for 30 min at 4°C in FACS buffer. Cells were then washed twice in FACS buffer (1500 rpm, 5 min, RT) and re-suspended in 100 µL/well FACS buffer for analysis. Sample acquisition was performed using an HTS plate reader connected to a BD Fortessa Flow cytometer.
Flow cytometry readout: intracellular cytokine staining
To block cytokine secretion, 20 µL of culture medium containing 1/150 (final concentration: 1/1500) Brefeldin A (Golgiplug, 555029; BD) and 1/100 (final concentration: 1/1000) Monensin A (Golgistop, 554724; BD) and CD107a (Alexa 647, 562622; BD) was transferred to each well for 24 hours. At the assay endpoint, PBMCs were collected, washed twice in PBS (5 min, 1500 rpm, RT) and stained with a mix of antibodies to the following surface markers: CD4 (BUV395, 564724; BD), CD8 (BV605, 344742; Biolegend) and live dead NIR (L10119; Thermo Fisher) in PBS (30 min, 4°C, no light) in PBS. PBMCs were centrifuged (5 min, 1500 rpm, RT) and fixed with Cytofix/Cytoperm buffer (554722; BD) (80 µL/well, 30 min, 4°C). PBMCs were centrifuged and then washed with Perm/Wash buffer (554723; BD) (5 min, 1500 rpm, RT). PBMCs were incubated in Perm/Wash buffer (30 min, 4°C, no light) and then stained with a mix of antibodies to cytokines: TNF-α (APC-Cy7, 502944; Biolegend) and IFN-γ (BV795, 612845; BD) in Perm/Wash buffer (50 µL/well, 30 min, 4°C, in the dark). PBMCs were centrifuged and washed with FACS buffer (5 min, 1500 rpm, RT). Last, they were re-suspended in 100 µL FACS buffer and sample acquisition was performed using and HTS plate reader connected to a BD Fortessa Flow cytometer.
Cytokine measurement
Cytokines were analyzed in the culture supernatants from the killing assays (stored at −80°C) by Luminex using a human8Plex Assay kit (M50000007A; Bio-Rad) and additional reagents for IL-1β (171B5001M; Bio-Rad) and MCP-1 (171B5021M) measurement. Pre-diluted supernatants were incubated with beads in a 96-well filter plate (1 hour, 800 rpm, RT, in the dark). The plate was washed twice using a vacuum manifold and the detection antibody solution was added (1 hour, 800 rpm, RT, no light). The plate was vacuumed and washed twice and the streptavidin solution was added (30 min, 800 rpm, RT, in the dark). The plate was vacuumed and washed twice and the samples were re-suspended in assay buffer. Sample acquisition was conducted using the Luminex equipment from Bio-Rad.
In vivo experiment
Humanized NSG mice were ordered from the Jackson Laboratory. The Cantonal Veterinary Office, Zurich, Switzerland, approved the protocol (ZH225-17) in accordance with the Swiss Animal Protection Law. One day before treatment, humanized NSG mice were randomized based on their T cell counts into three groups of four mice. One group was treated with dasatinib (50 mg/kg, orally) 1 hour before injection of CD19-TCB (0.5 mg/kg, intravenously) on day 0 and again 5 hours and 8 hours after injection. On days 1 and 2, dasatinib was given twice per day with intervals of 10–11 hours. Blood was collected by tail-vein bleedings or by terminal retro-orbital bleeding at 72 hours.
Data analysis
Flow cytometry data were analyzed using FlowJo V.10. Cytokine data were analyzed using the Bio-Plex software. GraphPad Prism V.8 was used to generate the graphs and for statistical analysis. For dose–titration curves, AUC were calculated and used for statistical comparison. Data are shown as means with SD or SEM or as individual curves. The statistical tests used are indicated in the figure legends for each experiment.
Results
Dasatinib is a potent inhibitor of TCB-mediated target cell killing at pharmacologically relevant doses
To assess the inhibitory effect of dasatinib on TCB-mediated target-cell killing, PBMCs were co-cultured with NLR-labeled SKM-1 cells and HLA-A2 WT1-TCB, in medium supplemented with escalating concentrations of dasatinib. The Incucyte system was used to capture the loss of red fluorescent protein signal over time as a readout of target-cell killing. A concentration of 100 nM (48.8 ng/mL) and 50 nM (24.4 ng/mL) dasatinib resulted in 92.2% and 95.5% inhibition of target-cell killing induced by 10 nM HLA-A2 WT1-TCB (figure 1A and table 1), while not directly affecting NLR-labeled SKM-1 growth (online supplemental figure 2A). A concentration of 25 nM (12.2 ng/mL) and 12.5 nM (6.1 ng/mL) dasatinib resulted in 87.1% and 80.2% inhibition of target-cell killing for 10 nM HLA-A2 WT1-TCB (table 1). The lower concentration of 6.25 nM dasatinib combined with 10 nM HLA-A2 WT1-TCB only partially inhibited killing (figure 1A and table 1). Similarly, 100 nM and 50 nM dasatinib significantly prevented HLA-A2 WT1-TCB-induced SKM-1 killing as well as T cell proliferation and activation in a killing assay using CSFE-labeled SKM-1 tumor cells co-cultured with PBMCs and HLA-A2 WT1-TCB (figure 1B–E and online supplemental figure 4A,B). Dasatinib did not affect T cell nor SKM-1 cell viability, nor the target expression on SKM-1 cells (online supplemental figures 2A,D,E and 3). Moreover, treatment with a concentration of dasatinib above 25 nM totally prevented the release of IFN-γ, IL-2 and to a lower extent TNF-α (figure 1F–H and online supplemental figure 8A–D). The lower concentration of 12.5 nM and 6.25 nM dasatinib decreased but did not fully suppress cytokine release (figure 1F–H). Overall, these data show that dasatinib can fully prevent T cell mediated target-cell lysis triggered by PBMCs stimulated with HLA-A2 WT1-TCB at in vitro concentrations of 50 nM and above. The inhibitory effect of dasatinib on HLA-A2 WT1-TCB-induced T cell cytotoxicity and cytokine release was confirmed using another target cell line (A375) for HLA-A2 WT1-TCB. (online supplemental figures 1 and 2B).
Supplemental material
Percentage of inhibition of tumor cell killing for each concentration of dasatinib was calculated over that in the absence of dasatinib for a fixed HLA-A2 WT1-TCB concentration of 10 nM in the assay of figure 1A, mean of n=2 donors
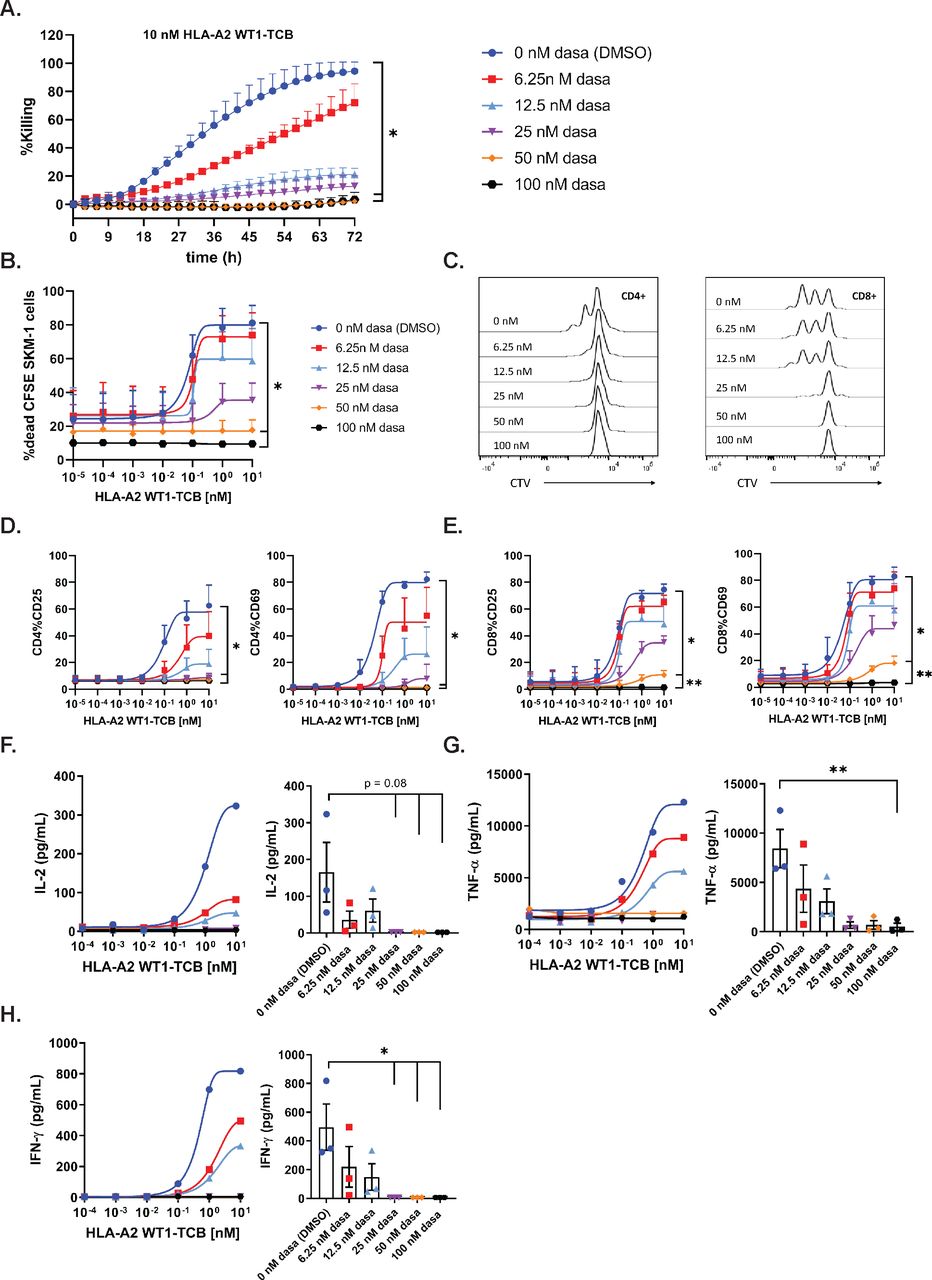
Dasatinib is a potent inhibitor of TCB-mediated target cell killing at the label pharmacological dose. (A) Real-time killing of NLR-labeled SKM-1 tumor cells by 10 nM HLA-A2 WT1-TCB in the presence of escalating concentrations of dasatinib. NLR-labeled SKM-1 tumor cells were co-cultured with peripheral blood mononuclear cells (PBMCs) and HLA-A2 WT1-TCB in media supplemented with dasatinib, E:T=2.5:1. Killing was followed by Incucyte (1 scan every 3 hours, zoom ×10, phase and red 400 ms acquisition time), mean of n=2 donors±SD with *p≤0.05, **p≤0.01 by one-way ANOVA (Friedman test). Effects of escalating concentrations of dasatinib on HLA-A2 WT1-TCB-induced killing (B), T cell proliferation (C) and T cell activation (D, E) in a killing assay where CFSE-labeled SKM-1 tumor cells were co-cultured with CTV-labeled PBMCs and HLA-A2 WT1-TCB, E:T=5:1. (B) The killing of CFSE-labeled SKM-1 cells was measured by flow cytometry at t=24 hours using a Live/Dead stain allowing exclusion of dead cells. (C) To assess the effect of dasatinib on T cell proliferation, the dilution of the CTV dye in CD4+ and CD8+ T cells was measured by flow cytometry at t=72 hours, histogram plots for 1 donor representative of 3. (D, E) The expression of CD25 and CD69 on CD4+ and CD8+ T cells was measured by flow cytometry (t=24 hours), mean of n=3 donors+SD with *p≤0.05, **p≤0.01 1 by one-way ANOVA (Friedman test). (F, G, H) The levels of IFN-γ, TNF-α and IL-2 were measured by Luminex in the supernatants after 24 hours. The dasatinib dose–response curves depict the data from 1 donor representative of 3. The graphs show the individual values for n=3 donors treated with 10 nM HLA-A2 WT1-TCB in the presence of escalating concentrations of dasatinib, mean of n=3 donors±SEM with *p≤0.05, **p≤0.01 by one-way ANOVA (Friedman test).
Dasatinib rapidly switches off TCB-induced T cell functionality
To evaluate if dasatinib could act as a rapid and potent inhibitor of activated T cells, we first stimulated PBMCs cultured with SKM-1 tumor cells and HLA-A2 WT1-TCB for 24 hours before adding 100 nM dasatinib to the co-culture (figure 2A).
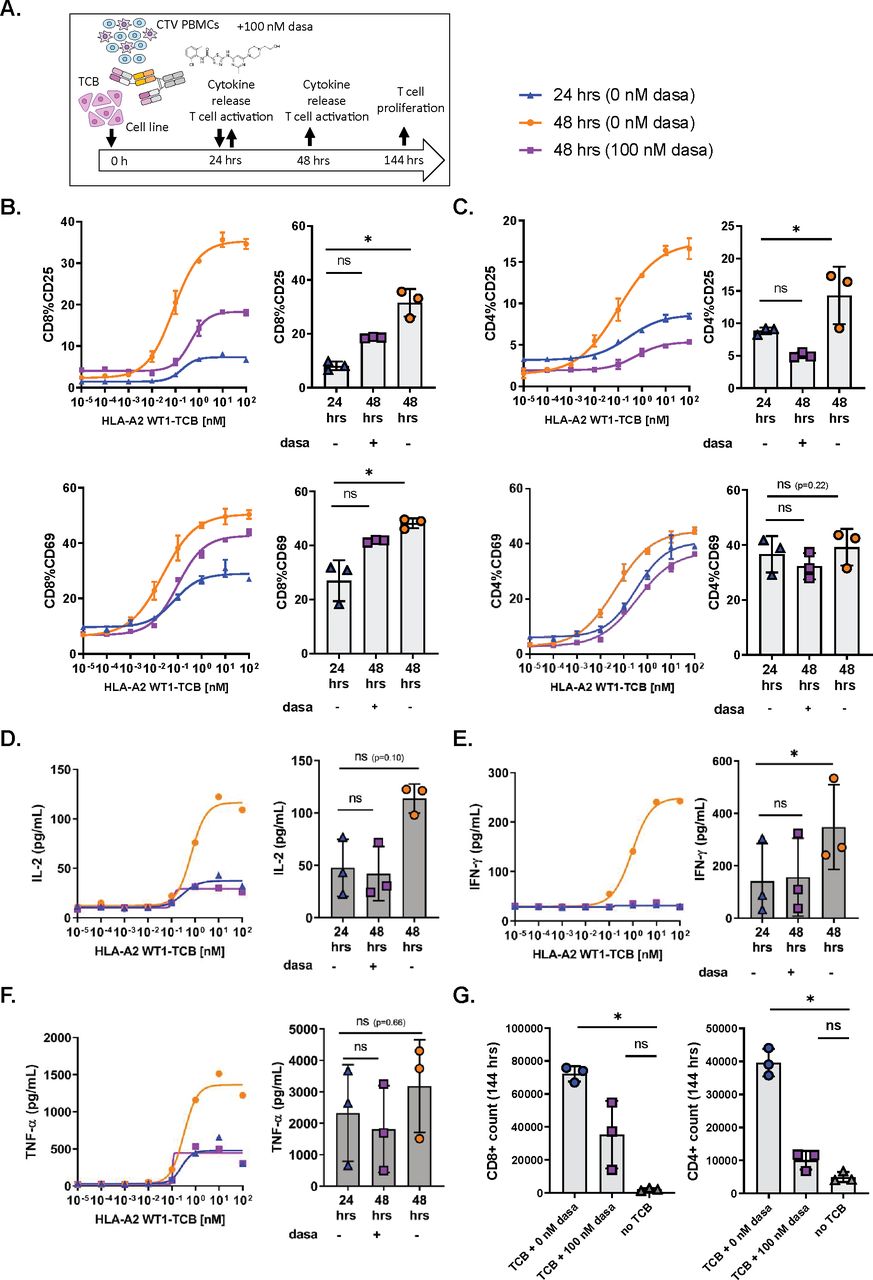
Dasatinib is a rapid and potent inhibitor of TCB-induced T cell functionality. (A) In vitro killing assay set-up and timelines. CTV-labeled peripheral blood mononuclear cells (PBMCs) were co-cultured with SKM-1 tumor cells (E:T=1:1) and HLA-A2 WT1-TCB. Dasatinib was added after 24 hours of activation. (B, C) The expression of CD25 and CD69 on CD8+ and CD4+ T cells was measured by flow cytometry after 24 hours and 48 hours of activation in the presence and absence of dasatinib. (D, E, F) The supernatants were collected at 24 hours and 48 hours, and the levels of IL-2, IFN-γ and TNF-α were measured by Luminex. (G) At 144 hours, the absolute T cell counts were measured by flow cytometry to assess the effect of dasatinib on CD4+ and CD8+ T cell proliferation. The dose–response curves depict the data from 1 donor representative of 3, mean of technical replicates±SD (B, C). The graphs show the means±SD of individual values from 3 donors treated with 10 nM HLA-A2 WT1-TCB with *p≤0.05, **p≤0.01 by one-way ANOVA (Friedman test). ns, not significant.
The expression of CD69 and CD25 on CD8+ and CD4+ T cells at 24 hours showed a partially activated phenotype for T cells stimulated with HLA-A2 WT1-TCB in the absence of dasatinib (figure 2B,C). Along with activation of T cells, IFN-γ, TNF-α and IL-2 were also found in the culture supernatants after 24 hours of stimulation (figure 2D–F).
Following a further 24 hours of incubation, this time in the presence of 100 nM dasatinib, the expression of the early activation marker CD69 and the late activation marker CD25 on CD4+ and CD8+ T cells at 48 hours were lower than those measured at 48 hours in absence of dasatinib (figure 2B,C). Thus, treatment with 100 nM dasatinib rapidly inhibited further induction of activation markers in pre-activated T cells.
We also measured the cytokine levels in the killing assay supernatants at 48 hours, to assess the impact of dasatinib on T cell-mediated cytokine release. No differences were observed for IFN-γ, TNF-α and IL-2 levels measured at 24 hours and 48 hours, as opposed to the dasatinib-untreated control where cytokine levels had largely increased at 48 hours (figure 2D–F). This indicated that the addition of 100 nM dasatinib at 24 hours had rapidly prevented the release of cytokines by activated T cells.
We also assessed T cell proliferation 120 hours after addition of 100 nM dasatinib in the killing assay, measuring the CTV dye dilution peaks by flow cytometry. The treatment with 100 nM dasatinib decreased the proliferation of CD4+ and CD8+ T cells induced by 10 nM HLA-A2 WT1-TCB, with a stronger effect on CD4+ T cells (online supplemental figure 4C). In addition, CD4+ and CD8+ T cell counts were significantly higher in untreated cultures than in those treated with 100 nM dasatinib (figure 2G). Dasatinib appeared to impact more strongly the CD4+ than the CD8+ T cell proliferation (figure 2G and online supplemental figure 4C). These results showed that 100 nM dasatinib added to the killing assay inhibited TCB-induced T cell proliferation with an apparent stronger impact on CD4+ than on CD8+ T cells.
As demonstrated in these experiments, dasatinib treatment rapidly resulted in the blockade of T cell activation, cytokine release and proliferation indicating a loss of T cell functionality.
Dasatinib prevents TCB-induced cytotoxicity of activated T cells
To assess whether dasatinib could efficiently prevent TCB-mediated target cell killing by activated T cells, we set up an in vitro killing assay with two stimulation steps, in an attempt to mimic an ON/OFF switch of T cell cytotoxicity. PBMCs were first activated with HLA-A2 WT1-TCB for 20 hours in the presence of SKM-1 target cells labeled with CFSE in the absence of 100 nM dasatinib (ON). The PBMCs were then washed and re-stimulated with the TCB on SKM-1 cells labeled with CTV in the presence of 100 nM dasatinib (OFF switch). The use of CFSE-labeled and CTV-labeled SKM-1 tumors allowed to differentiate the tumor cells used in the first or second stimulation by flow cytometry (figure 3A).

Dasatinib is a potent inhibitor of TCB-induced T cell cytoxicity. (A) In vitro killing assay set-up and timelines. Peripheral blood mononuclear cells (PBMCs) were co-cultured with CFSE-labeled SKM-1 tumor cells (E:T=5:1) and HLA-A2 WT1-TCB. After 20 hours, the cells were washed and re-stimulated with HLA-A2 WT1-TCB on fresh CTV-labeled SKM-1 cells (E:T=5:1) in the presence or absence of 100 nM dasatinib for 24 hours. (B) The killing of SKM-1 cells was measured by flow cytometry at 20 hours (after 1st stimulation) and 44 hours (after 2nd stimulation) by exclusion of dead CFSE-labeled and CTV-labeled SKM-1 cells using a Live/Dead NIR dye. The flow cytometry dot plots are from 1 donor representative of 3 treated with 10 nM HLA-A2 WT1-TCB. (C) CTV-labeled and CFSE-labeled SKM-1 tumor cell killing before and after restimulation with HLA-A2 WT1-TCB in the presence or absence of dasatinib, mean of n=3 donors±SD with *p≤0.05, **p≤0.01 by one-way ANOVA (Friedman test). (D, E) IFN-γ, IL-2, TNF-α, IL-8, GM-CSF and IL-6 levels were measured by Luminex in the culture supernatants. The dose–response curves depict the data from 1 donor representative of 3 and the graphs show the mean±SD of the individual values from 3 donors treated with 10 nM HLA-A2 WT1-TCB with *p≤0.05, **p≤0.01 by one-way ANOVA (Friedman test).
The first treatment with HLA-A2-WT1-TCB induced an upregulation of the early and late T cell activation markers CD69 and CD25 on CD8+ and CD4+ T cells (online supplemental figure 5), as well as the killing of CFSE-labeled SKM-1 target cells (figure 3B,C), while a non-targeted TCB, DP47-TCB, did not show any activity (online supplemental figure 6). T cells were therefore activated by HLA-A2 WT1-TCB and functional before the addition of dasatinib in the system. Following the second stimulation in the presence of 100 nM dasatinib, 87.30% of CTV-labeled SKM-1 cells were alive while only 2.04% were still alive following re-stimulation in the absence of dasatinib (figure 3B). Thus, addition of dasatinib on the second stimulation prevented HLA-A2 WT1-TCB-mediated killing (figure 3B,C). In addition, the release of IFN-γ, IL-2 and GM-CSF (known to be produced by T cells) and of TNF-α, IL-6 and IL-8 (produced by T cells and monocytes) was fully inhibited on re-stimulation in the presence of 100 nM dasatinib (figure 3D,E).18 19 This result emphasizes that dasatinib can switch off activated T cells, rapidly blocking TCB-mediated cytokine release as well as T cell cytotoxicity.
To investigate how dasatinib could prevent T cell cytotoxicity, we measured the expression of CD107a by intracellular staining as a readout for T cell degranulation (online supplemental figure 7A) after stimulation with 10 nM HLA-A2 WT1-TCB in the presence or absence of 100 nM dasatinib. The addition of dasatinib prevented T cell degranulation, as indicated by the inhibition of CD107a (online supplemental figure 7B,C). This result shows that dasatinib can prevent T cell degranulation and potentially the release of perforin and granzyme B that mediate the killing of target cells.
Dasatinib reversibly stops TCB-induced tumor cell killing
We then verified whether the effect of dasatinib was reversible on its removal. To this aim, we set up a killing assay with repeated stimulations in the presence or absence of dasatinib and followed the killing kinetics using the Incucyte system (figure 4A). After each stimulation, effector cells were washed and re-stimulated on fresh NLR-labeled MKN45 target cells with 1 nM CEA-TCB in the presence or absence of dasatinib, in order to mimic an OFF/ON/OFF or ON/OFF/ON switch. A dose titration of dasatinib was conducted in this system, showing that 100 nM and 50 nM significantly prevented the killing of NLR-labeled MKN45 cells by 1 nM CEA-TCB (figure 4B and online supplemental figure 2C). In addition, dasatinib blocked CEA-TCB-mediated cytokine release (online supplemental figure 9).

Dasatinib reversibly switches off TCB-induced T cell functionality. (A) Restimulation assay set-up. Peripheral blood mononuclear cells (PBMCs) were co-cultured with NLR-labeled MKN45 (E:T=10:1) target cells and CEA-TCB for 3 consecutive stimulations in the presence or absence of 100 nM dasatinib, mimicking an ON/OFF/ON switch (C) or OFF/ON/OFF switch (D), mean of n=3 donors+SD. (B) Effects of escalating concentrations of dasatinib on NLR-labeled MKN45 killing by 1 nM CEA-TCB on the first stimulation, mean of n=3 donors+SEM with *p≤0.05 by one-way ANOVA (Friedman test). Real-time killing was followed by Incucyte (1 scan every 3 hours, zoom ×10, phase and red 400 ms acquisition time). (E, F) The levels of IFN-γ, IL-2 and TNF-α were measured by Luminex in the culture supernatants after each stimulation of the ON/OFF and OFF/ON switch assays for a dose response of CEA-TCB, mean of n=2 donors+SEM.
Adding 100 nM dasatinib in the co-culture during the first stimulation resulted in the inhibition of target cell killing, which was then reversed after dasatinib removal for the second stimulation (OFF/ON) (figure 4C). IFN-γ, IL-2 and TNF-α were not detected in the supernatants after the first stimulation in the presence of 100 nM dasatinib, indicating a full inhibition of T cell derived cytokine release (figure 4E). Removal of dasatinib after 3 days and re-stimulation with 1 nM CEA-TCB resulted in the release of IFN-γ, IL-2 and TNF-α, indicating that T cell functionality was restored on dasatinib removal (figure 4E). Subsequent addition of dasatinib at day 6 again inhibited T cell cytotoxicity until day 9 (figure 4C), showing an overall OFF/ON/OFF switch effect during the time course of this experiment.
When dasatinib (100 nM) was added to the culture medium only on the second stimulation with CEA-TCB to prevent T cell cytotoxicity and then removed for the third stimulation, target cell killing was finally restored (figure 4D and online supplemental file 1), mimicking an ON/OFF/ON switch. Addition of 100 nM dasatinib for the second TCB stimulation prevented the release of IFN-γ, IL-2 and TNF-α, as expected (figure 4F).
Supplementary video
Cytokine release has been shown to occur on initial exposure to T cell bispecific antibodies, but not or much less on subsequent dosing. Interestingly, low doses of dasatinib (<25 nM) added for the first TCB stimulation in the OFF/ON assay described in figure 4A partially inhibited target cell killing but seemed to equilibrate cytokine release between the first and second stimulation (online supplemental figure 10A–C).
Dasatinib prevents CD19-TCB-induced B cell depletion and cytokine release in humanized NSG mice
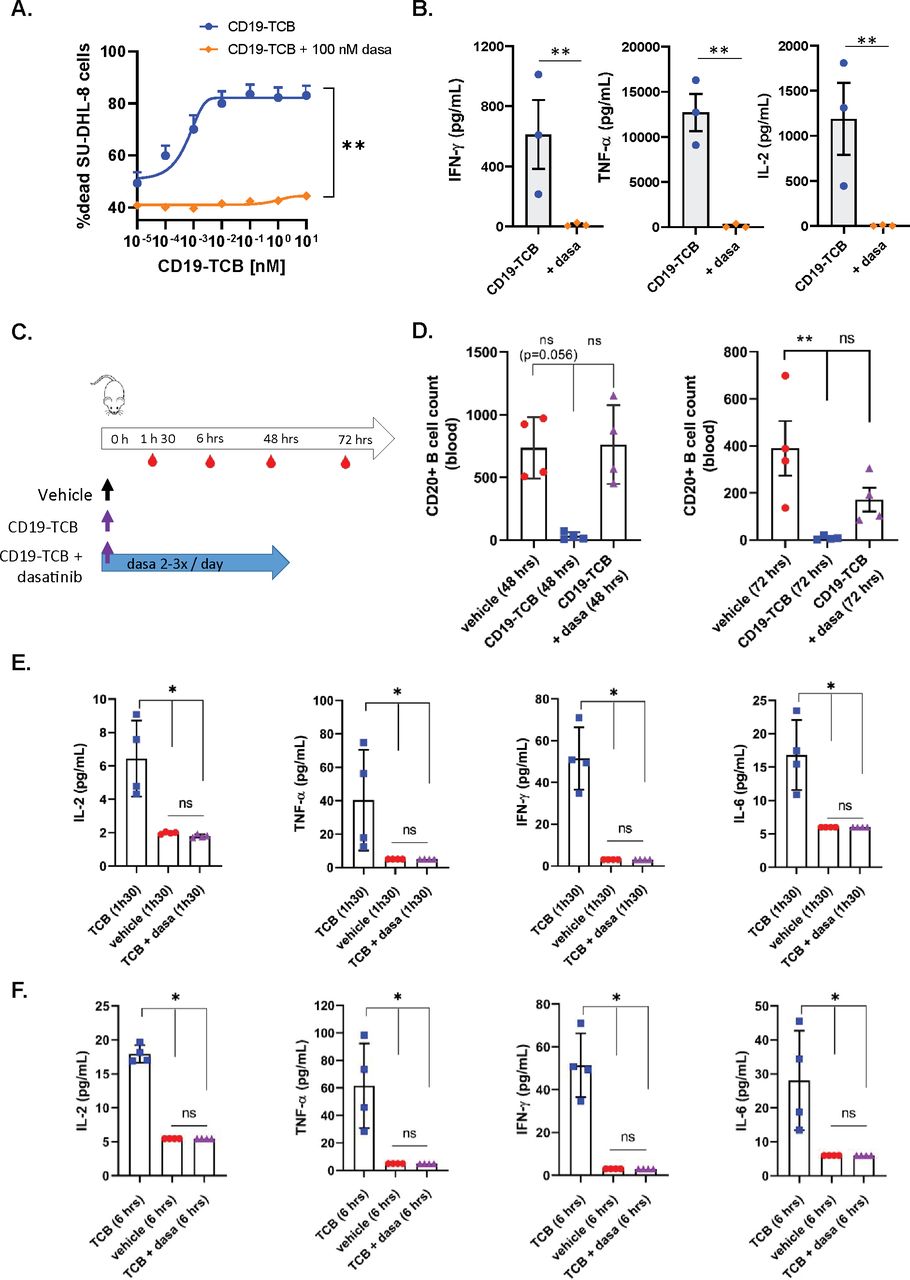
In line with the previous observations with CEA-TCB and HLA-A2 WT1-TCB, 100 nM dasatinib prevented CD19-TCB-dependent killing of SU-DHL-8 tumor cells and T cell activation as well as the release of TNF-α, IFN-γ and IL-2 in vitro (figure 5A,B and online supplemental figure 11A,B). To verify whether dasatinib could prevent CD19-TCB-induced B cell depletion and cytokine release in vivo, humanized NSG mice were either treated with vehicle or with 0.5 mg/kg CD19-TCB as a monotherapy or combined with 50 mg/kg dasatinib (figure 5C). To best translate the clinical pharmacodynamics and pharmacokinetics profile of dasatinib and to verify if the resulting exposure would be sufficient to prevent CD19-TCB-induced T cell cytotoxicity and cytokine release, dasatinib was given orally three times on day 0 and twice on days 1 and 2. As shown by the CD20+ B cell count measured in the blood at 48 hours, dasatinib prevented the killing of CD20+ B cells by CD19-TCB (figure 5D). At 72 hours, partial killing of B cells was nevertheless observed (figure 5D). The half-life of dasatinib being around 6 hours, the exposure of dasatinib was probably not sufficient any longer to continuously inhibit T cell cytotoxicity at the later timepoint. This is another indication that the inhibitory effect of dasatinib is rapidly reversible in vivo, as observed by Mestermann et al29 and Weber et al30 for CAR T cells.33

Dasatinib prevents CD19-TCB-induced B cell depletion and cytokine release in vivo. Effect of 100 nM dasatinib on CD19-TCB-dependent SU-DHL-8 killing and cytokine release. Peripheral blood mononuclear cells were co-cultured with CTV-labeled SU-DHL-8 tumor cells (E:T=10:1) and escalating concentrations of CD19-TCB in the presence or absence of 100 nM dasatinib. (A) The killing of CTV-labeled SU-DHL-8 cells was measured by flow cytometry (t=24 hours) using a Live/Dead stain allowing exclusion of dead cells. (B) The levels of IFN-γ, TNF-α and IL-2 were measured in the culture supernatants by Luminex (24 hours, 10 nM CD19-TCB). (A, B) Mean of n=3 donors+SD with *p≤0.05, **p≤0.01, paired t-test. (C) Humanized NSG mice were co-treated with 0.5 mg/kg CD19-TCB (intravenously) and 50 mg/kg dasatinib (orally). (D) CD20+ B cell counts were measured by flow cytometry in blood collected at 48 hours and 72 hours. (E, F) The levels of IFN-γ, TNF-α, IL-2 and IL-6 were measured by Luminex in serum collected 1 hour 30 min and 6 hours post-treatment with CD19-TCB. (D–F) Mean of n=4 mice per group±SD with *p≤0.05, **p≤0.01 by one-way ANOVA (Kruskal-Wallis test). ns, not significant.
Dasatinib blocked the release of IL-2, TNF-α, IFN-γ and IL-6 measured 1 hour 30 min and 6 hours after CD19-TCB treatment, indicating that dasatinib could also rapidly switch off CD19-TCB-dependent cytokine release (figure 5E,F).
In line with the in vitro findings, the rapid onset of the activity of dasatinib allowed to prevent B cell depletion and cytokine release induced by the first infusion of CD19-TCB in humanized NSG mice. Collectively, these data demonstrate the favorable pharmacodynamic profile of dasatinib, efficiently preventing CD19-TCB-induced T cell cytotoxicity and cytokine release for at least 48 hours when administered twice per day at the dose of 50 mg/kg.
Discussion/conclusion
In recent studies, Mestermann et al29 and Weber et al30 showed that the kinase inhibitor dasatinib allowed pharmacological control over activated CD19 CAR T cells. They demonstrated that dasatinib could reversibly switch off activated CAR T cells, enabling the mitigation of CRS and CAR T cell–associated neurotoxicity (CRES).24 The authors suggested that the use of dasatinib would represent a more efficient approach to mitigate these life-threatening toxicities than the current approaches consisting of treatment with glucocorticoids or tocilizumab blocking IL-6R, which do not always result in recovery of symptoms in patients treated with CAR T cells.34 Our work demonstrates that dasatinib reversibly suppresses T cell bispecific antibody-dependent cytotoxicity and cytokine release in vitro and in vivo, in line with recent in vitro findings of Leonard et al35 with blinatumomab. Dasatinib therefore represents an attractive way to improve the safety profile and tolerability of T cell engagers.
We show that the rapid blockade of T cell activities with dasatinib could be a way to revoke inflammation and tissue damage in cases of severe TCB-mediated off-tumor toxicity. In vitro, 50 nM dasatinib was found to prevent the killing of TAA-expressing cells by CEA-TCB-stimulated or HLA-A2 WT1-TCB-stimulated T cells. To verify whether these in vitro concentrations would translate into pharmacologically active doses, we compared the in vitro dose with the Cmin, Cmax and steady-state concentrations measured in patients exposed to labeled pharmacological doses of dasatinib. Wang et al reported that the PK parameters derived from 146 patients treated with 100 mg dasatinib QD were a Cmin value of 2.61 ng/mL and a Cmax value of 54.6 ng/mL.36 Hence, the in vitro doses of 50 nM (24.4 ng/mL) and 100 nM (48.8 ng/mL) appear translatable to the dasatinib dosing regimen of 100 mg QD.36 In humanized NSG mice, the PK/PD profile of dasatinib seemed favorable as it prevented CD19-TCB-induced B cell depletion and cytokine release.
Addition of dasatinib 20 hours or 4 days after T cell stimulation with HLA-A2 WT1-TCB or CEA-TCB in killing assays was shown to rapidly stop further T cell activation and proliferation, as well as the release of cytokines including IFN-γ, IL-2 and TNF-α. Moreover, the presence of dasatinib on restimulation of activated T cells on fresh SKM-1 cells totally averted HLA-A2 WT1-TCB-mediated target cell killing and T cell degranulation. Altogether, these data reveal that dasatinib can quickly switch off TCB-mediated T cell cytotoxicity at pharmacological label doses in cases where undesired side effects occur, such as tissue toxicity.
Another application for dasatinib could be the mitigation of severe T cell engager–induced CRS.37 The cytokine cascade is first initiated by T cells, which release cytokines that trigger activation of other immune cells, thus amplifying the cascade.19 Myeloid cells were shown to be key mediators of IL-6 and IL-1β release and to be activated via TNF-α. Li et al19 also showed that blocking TNF-α decreased cytokine release following treatment with a HER2 T cell–dependent bispecific antibody.32 In vitro, TNF-α blockade partially inhibited the release of IL-6 and IL-1β but not of the T cell–derived cytokines IL-2 or IFN-γ, and did not block T cell cytotoxic activity (19 and manuscript in preparation). In our study, dasatinib rapidly and fully switched off the release of IL-2, IFN-γ, IL-6, TNF-α and IL-1β, in addition to blocking T cell cytotoxicity. Importantly, dasatinib was also able to rapidly stop both the cytokine release and cytotoxicity of pre-activated T cells, which might be important for the mitigation of high-grade CRS as well as tissue toxicities.
Tumor-associated antigen distribution in healthy and malignant tissues as well as the susceptibility of developing CRS is very heterogeneous among individuals and personalized prediction is not yet optimal. Consequently, dasatinib represents an attractive potential antidote against TCB-induced life-threatening safety liabilities like off-tumor related toxicities or high-grade CRS. Due to its short half-life as a small molecule, it can be tightly regulated in contrast to the administration of TNF-α or IL-6R blocking antibodies. Dasatinib (Sprycel) is indicated for the first-line treatment of Philadelphia chromosome-positive chronic myelogenous leukemia and acute lymphoblastic leukemia.36 The dasatinib regimen of 100 mg once a day is associated with favorable PK parameters and a fast absorption rate of 30 min to 4 hours, suggesting that it could rapidly induce a pharmacological on/off switch after administration.36 Furthermore, dasatinib’s toxicity profile is well characterized and treatment-associated adverse events, including cytopenias and pleural effusions, are manageable by dose modification or interruption.38 Overall, this may support a straightforward implementation of dasatinib for the management of extreme cases of life-threatening CRS and on-target tissue toxicities.
Other Src kinase inhibitors were reported to block CAR T cell functionality like nintedanib, imatinib, ponatinib or saracatinib as well as the BTK inhibitor ibrutinib. However, none of them appeared as potent as dasatinib.28 35 39 40 Our work highlights that a short-term intervention with dasatinib could be used as a rapid safety switch to mitigate high-grade CRS and/or adverse events related to on-target off-tumor activity of T cell engagers. We showed that dasatinib blocked TCB-mediated target cell killing on first infusion in a mouse model, but whether intermittent dosing of dasatinib would negatively affect T cell engagers’ efficacy in a tumor model, as can be anticipated from the data presented, remains to be investigated. Indeed, the combination of blinatumomab and dasatinib to treat patients with relapsed or MRD-positive Philadelphia chromosome-positive leukemia was found to be safe and associated with efficacious responses.41 42 Recently, Weber et al33 showed that treatment with dasatinib could improve CAR T cell functionality, by inducing rapid and transient ON/OFF switches preventing exhaustion. While, for TCBs, our results suggest that dasatinib treatment would have a reversible but detrimental effect on efficacy, it is reasonable to assume that, like for CAR T cells, pulsed treatment with dasatinib may be able to reduce T cell engager–induced T cell exhaustion as well. To specifically reduce the risk of CRS and improve its mitigation, further mechanistic studies are required to identify kinase inhibitors that might differentially regulate T cell activation and cytokine release induced by CD3 bispecific antibodies.
Data availability statement
The authors declare that all relevant data to the study are included in the article or uploaded as online supplemental information.
Ethics statements
Ethics approval
The Institutional Animal Care and Use Committee of RICZ and the Cantonal Veterinary Office of Zurich approved the study protocol (license ZH225-17) in accordance with the Swiss Animal Protection Law. All the experiments were performed according to committed guidelines (GV-Solas; Felasa; TierschG) and under the AALAC accreditation.
Acknowledgments
The authors thank all the members of the HLA-A2 WT1-TCB and CEA-TCB team for reviewing the article as well as all members from Cancer Immunotherapy, Oncology, Large Molecule Research, and Pharmaceutical Sciences at Roche Pharma Research and Early Development (pRED) who contributed to the development of these programs; Oncology DTA, Pharmaceutical Science and pRED leadership for support during all phases of this project.
References
Supplementary materials
Supplementary Data
This web only file has been produced by the BMJ Publishing Group from an electronic file supplied by the author(s) and has not been edited for content.
Footnotes
Contributors Concept and experimental design: GL, HH, VP, CF, JS, CK. Acquisition of data: GL. Data analysis and interpretation: GL, HH, AS, AMG, VP, CF, CK, CB, A-CW, EM-B. Writing, review and/or revision of the manuscript: GL, HH, EM-B, CF, AO, CK, MB. Administrative, technical or material support: JC. Study supervision: CK, HH, AS, MB, PU.
Funding All funding for the studies were provided by Roche.
Competing interests GL, HH and CK declare patent application related to the work described. All authors, except AO, are employees of Roche or were employed by Roche at the time of this study. All the authors, except AO, GL and HH, declare ownership of Roche stock.
Provenance and peer review Not commissioned; externally peer reviewed.
Supplemental material This content has been supplied by the author(s). It has not been vetted by BMJ Publishing Group Limited (BMJ) and may not have been peer-reviewed. Any opinions or recommendations discussed are solely those of the author(s) and are not endorsed by BMJ. BMJ disclaims all liability and responsibility arising from any reliance placed on the content. Where the content includes any translated material, BMJ does not warrant the accuracy and reliability of the translations (including but not limited to local regulations, clinical guidelines, terminology, drug names and drug dosages), and is not responsible for any error and/or omissions arising from translation and adaptation or otherwise.