Article Text

Abstract
Background Triple negative breast cancer (TNBC) is a subtype of breast cancers with poor prognosis and targeted drug therapies are limited. To develop novel and efficacious therapies for TNBC, we developed a bispecific antibody F7AK3 that recognizes both trophoblast cell surface antigen 2 (TROP2) and CD3 and evaluated its antitumor activities both in vitro and in vivo.
Methods The binding affinities of F7AK3 to the two targets, TROP2 and CD3, were evaluated by surface plasmon resonance. Binding of F7AK3 to TNBC cells and T cells were evaluated by flow cytometry. Immunofluorescent staining was performed to demonstrate the interactions between T cells with TNBC cells. The cytotoxicity of T cells against TNBC cell lines and primary tumor cells mediated by F7AK3 were determined in vitro. In vivo antitumor activity of F7AK3 was investigated in a xenograft TNBC tumor model, using immunodeficient mice that were reconstituted with human peripheral blood mononuclear cells.
Results We demonstrated that F7AK3 binds specifically to human TROP2 and CD3 antigens, as well as TNBC cell lines and primary tumor cells. Human T cells can only be activated by F7AK3 in the presence of target tumor cells. F7AK3 recruits T cells to TROP2+ tumor cells in vitro and into tumor tissues in vivo. Antitumor growth activity of F7AK3 is observed in a xenograft TNBC tumor model.
Conclusion This study showed the antitumor potential of an anti-TROP2xCD3 bispecific antibody F7AK3 to TNBC tumor cells both in vitro and in vivo. These data demonstrate that F7AK3 has the potential to treat TNBC patients, which warrants further preclinical and clinical evaluation of the F7AK3 in advanced or metastatic TNBC patients.
- immunotherapy
- tumor microenvironment
- breast neoplasms
- lymphocytes
- tumor-infiltrating
- antibodies
- neoplasm
Data availability statement
Data are available on reasonable request. All data relevant to the study are included in the article or uploaded as online supplemental information.
This is an open access article distributed in accordance with the Creative Commons Attribution Non Commercial (CC BY-NC 4.0) license, which permits others to distribute, remix, adapt, build upon this work non-commercially, and license their derivative works on different terms, provided the original work is properly cited, appropriate credit is given, any changes made indicated, and the use is non-commercial. See http://creativecommons.org/licenses/by-nc/4.0/.
Statistics from Altmetric.com
Background
Triple negative breast cancer (TNBC) represents a diverse subgroup of breast cancers that are characterized with the absence of expression of the estrogen receptor (ER), progesterone receptor (PR), and ERBB2 (also known as HER2).1 2 TNBC is associated with a poor prognosis.1 2 Chemotherapy has been the mainstay for the treatments of TNBC patients, however, most patients experience relapse following an initial response.2–4 Over the last few years, the therapeutic regimens for TNBCs have been expanded.5 6 Olaparib and talazoparib, two poly ADP-ribose polymerase (PARP) inhibitors were approved by U S Food and Drug Administration (FDA) and European Medicines Agency for locally advanced/metastatic TNBC with germline BRCA mutations.7–9 Atezolizumab in combination with nab-paclitaxel was approved in 2019 by FDA as first-line treatment for unresectable locally advanced or metastatic TNBC whose tumors express programmed cell death 1 ligand 1 (PD-L1) and pembrolizumab plus chemotherapy was approved for inoperable locally advanced/metastatic TNBC.10–12 Sacituzumab govitecan, a first-in-class antibody-drug conjugates (ADCs) targeting trophoblast cell surface antigen 2 (TROP2) has been approved in 2020 by FDA for metastatic TNBC who have received at least two prior therapies.13–15
TROP2, encoded by TACSTD2, is a calcium signal transducer that is associated with transformed cell growth and a paralog of epithelial specific cell adhesion molecule.16 TROP2 is upregulated in a variety of solid cancers including breast cancer, colorectal cancer, lung cancer, and gastric cancer, and the level of its expression is associated with prognosis.16–19 Overexpression of TROP2 has been shown to drive cancer cell growth consistently across cell type and species.20 Sacituzumab govitecan consists of a humanized IgG1 anti-TROP2 antibody that is covalently linked via a hydrolysable linker to a topoisomerase inhibitor SN-38, the active metabolite of irinotecan.14 21 In a randomized, phase 3 ASCENT trial, patients with metastatic TNBC receiving sacituzumab had significantly longer progression-free survival (5.6 vs 1.7 months) and overall survival (12.1 vs 6.7 months) compared with single-agent chemotherapy treatment.14
Tumor-infiltrating lymphocytes (TILs) are critical for antitumoral activity with prognostic values.22 23 The presence of TILs is associated with improved survival and metastatic TNBC tumors tend to have significant reductions of TILs compared with primary tumors.24 25 Thus, regimens that can redirect T cells to and activate them within tumors may provide further therapeutic benefits for TNBC patients.
Bispecific T cell engager antibodies (BiTEs) recognizing both tumor surface antigens and CD3 are a new class of immunotherapy agents.26 27 Blinatumomab, a protype of such agents that binds to both CD19 and CD3, was approved for the treatment of relapsed or refractory precursor B cell acute lymphoblastic leukemia.28 There are different strategies to design the bispecific antibodies and modify the characteristics of the antibodies. Nevertheless, the majority of BiTEs under investigation in the clinic share the mechanism of dual engagement of T cell and tumor cells and activation of T cells, regardless of the intrinsic antigen specificity of the T cell receptor (TCR).26 27
Herein, we developed and characterized a bispecific antibody F7AK3 that binds to both TROP2 and CD3. We examined F7AK3-mediated T cells activation and cytotoxicity for TNBC cell lines and primary cells in vitro and evaluated in vivo antitumor efficacy of F7AK3 in a xenograft TNBC tumor model.
Methods
Generation, expression and purification of bispecific anti-TROP2xCD3 antibody
The anti-CD3 scFv arm (named as K3) was developed as described previously.29 A large human naïve phage display library with the size of 5×10¹⁰ cfu (colony forming unit), constructed by Excyte Biopharma, was used for the panning of human TROP2 (Acrobio systems, cat. TR2-H82E5-25 μg) as previously described.30 A lead clone F7 was identified after monophage ELISA,31 and the binding specificity was verified by FACS. To increase the affinity of F7, parsimonious mutation32 was applied to identify beneficial replacements in CDRs (complementarity-determining region) and a combinatory library was built to combine selected substitutions. Affinity and liability optimized clones were screened by both ELISA and FACS to yield the final clone F7A.
The tetravalent bispecific antibody F7AK3 was built by FIST (fusion of IgG and scFv technology) platform in Excyte Biopharma. It is composed of F7A IgG4P and anti-CD3 scFv, assembled in an in-house vector pG4HK by standard molecular cloning methods. The plasmid was stably transfected into CHO-K1 (Shanghai Biochemical Institute, China Academia of Sciences) suspension cells. High expression clones were selected, and fermentation supernatants were purified by Protein-A affinity chromatography using MabSelect column (GE Healthcare, Princeton, New Jersey, USA).33 The bispecific antibody was further purified by cation exchange chromatography using Capto MMC (GE Healthcare) and ion exchange chromatography using Q HP (GE Healthcare) columns. The purified protein was concentrated and stored in 50 mM PBS containing 0.15M NaCl buffer. The purity was analyzed with intact mass spectrometry, sodium dodecyl sulfate polyacrylamide gel electrophoresis (SDS-PAGE) and size-exclusion chromatography.
Primary tumor cell isolation and culture
For primary cell isolation, tumor specimens were isolated at the time of surgery with informed consent and were gently minced into small pieces, then digested with 6 mL PBS containing 50 µL 25 mg/mL collagenase IV (Invitrogen, 17104019) and 25 µL 10 mg/mL DNase I (Roche, 10104159001) for 1 hour at 37°C. Cell suspensions were filtered twice and centrifuged at 1500 rpm for 5 min. Tumor cells and TILs were enriched and collected separately after Percoll gradient centrifugation (GE healthcare, 17-0891-01) following the manufacturer’s protocol. Afterwards, primary tumor cells were cultured with dulbecco's modified eagle medium (DMEM) supplemented with 10% heat-inactivated fetal calf serum (FCS) (Gibco, 1715753) and antibiotic antimycotic (Gibco, 15240062) for 2 weeks, then used for the indicated experiments.
Cell lines and cell culture
Cells were cultured at 37℃ with 5% CO2 in a humidified incubator. MDA-MB-231, MDA-MB-468, MCF7, 4T1, and HCC1395 were from ATCC. MDA-MB-231 was authenticated by STR profiling. All of the cell lines were passaged less than 2 months after each thaw and tested to be free of mycoplasma contamination.
Peripheral blood mononuclear cells collection and activation of T cells
Peripheral blood mononuclear cells (PBMCs) were isolated from healthy donor blood (LDEBIO, Guangzhou) by density gradient centrifugation. PBMCs were cultured in RPMI 1640 medium supplemented with 10% heat-inactivated FCS, antibiotic antimycotic, 1 mM pyruvate (Gibco, 11360070), NEAA (Gibco, 11140050) and 50 µM β-mercaptoethanol (Sigma, m3148). Cells were activated by TCR stimulation using plate-bound human anti-CD3/CD28 (clone OKT-3 and clone 9.3 Bio X Cell, respectively, 5 µg/mL of each) for 3 days, followed by interleukin 2 (IL-2) (20 ng/mL, PeproTech, 200–02) stimulation for 5 days.
Binding analysis of antibody to tumor cells
Tumors cells were collected, washed with PBS, and incubated with FACS buffer (1×PBS with 0.5% BSA) containing various concentrations of F7AK3 for 30 min at room temperature. Subsequently cells were washed with FACS buffer twice and stained with PE-conjugated goat-anti human IgG Fc antibody (Invitrogen, 2234986). Dead cells were identified using Live/Dead Fixable Dead Cell staining kit (Invitrogen, 2123595). Samples were analyzed by flow cytometry with a FACS LSR II or FACS Verse (BD).
RNA isolation and real-time PCR
RNA was isolated from cultured cells with TriZol (Ambion, 318309) and cDNA was synthesized from 1 µg of RNA using the Reverse Transcription Kit (Toyobo, FSQ-201). All q-PCR was performed with the SYBR Green method on a Bio-Rad CFX Connect. The quantification of the results was performed by the comparative Ct (2–ΔΔCt) method. The Ct value for each sample was normalized to the value for the GAPDH gene. Primer sequences are as follows.
TACSTD2-F: 5’-CCCGAGGAGAAGAGGAGTTTG-3’.
TACSTD2-R: 5’-CATCCAAACTGCGTTCAGGC-3’.
GAPDH-F: 5’-ACAACTTTGGTATCGTGGAAGG-3’.
GAPDH-R: 5’-GCCATCACGCCACAGTTTC-3’.
Immunoblot assay
Cells were lysed with RIPA lysis buffer containing phenylmethylsulfonyl fluoride (1 mM). Cell lysates were separated by SDS-PAGE and transferred onto PVDF membranes (Millipore). The blots were probed with the following primary antibodies overnight at 4°C: anti-TROP2 (Abcam, ab214488) and anti-GAPDH (Servicebio, GB11002). Afterwards, the membrane was incubated with a horseradish peroxidase-conjugated secondary antibody for 1 hour, followed by detection using a chemiluminescence assay kit.
Cytotoxicity assay and intracellular cytokines staining
For cell cytotoxicity, activated T cells were co-cultured with tumor cells in a 5:1 ratio in the presence of different concentrations of F7AK3 for indicated times. Afterwards, T cell cytotoxicity was assessed by quantification of lactate dehydrogenase (LDH) amounts in the supernatants using the Cytotoxicity Detection KitPLUS (Sigma-Aldrich) according to manufacturer’s instructions.
For measurements of T cell activation and cytokine expression, PBMCs from human donors were cocultured with tumor cells in an Effector:Target (E:T) ratio of 3:1 in the presence or absence of F7AK3 (1 µg/mL) for 72 hours. T cell activation were assessed by incubating cells with directly conjugated antibodies to CD4 (Biolegend, 980812), CD8 (BD, 557746), CD69 (BD, 560738), CD25 (Biolegend, 302603), PD1 (BD, 558694). For cytokine expression, cocultured cells were stimulated with phorbol 12-myristate 13-acetate (PMA), ionomycin and Golgiplug for 4 hours and antibodies against interferon γ (IFN-γ) (BD, 563287), tumor necrosis factor α (TNF-α) (Biolegend, 502944), Granzyme B (Invitrogen, 1893847), IL-2 (Biolegend, 500322) were used for intracellular staining. Data were analyzed by flow cytometry with a FACS LSR II or FACS Verse (BD).
Cell proliferation and apoptosis analysis
For in vitro proliferation, tumor cells were cultured in 96-well plate, treated with 1 µg/mL F7AK3 for indicated days. Cell viabilities were analyzed with CCK8 kit (Dojindo, CK04) following the manufacturer’s protocol. For apoptosis analysis, tumor cells were incubated in 12-well plate, treated with 1 µg/mL F7AK3 for 48 hours. Cells were harvested, washed twice with ice-cold PBS and stained with Annexin V-FITC (Biolegend, 640906) and propidium iodide (Sigma, P4170) in Annexin V binding buffers. Samples were analyzed on a BD Verse flow cytometry and data were analyzed using FlowJo software.
Immunofluorescence
Tumor cells were seeded at 3×10⁴ cells per well in glass slides and cultured for 12 hours. Then activated T cells were added to the culture in the absence or presence of F7AK3 (1 µg/mL) for 30 min. Afterwards, cells were washed twice with PBS and fixed with 4% paraformaldehyde, permeabilized with 0.1% Triton X-100, and blocked with 5% BSA. Cells were incubated with anti-TROP2 (Abcam, ab214488) and anti-CD3 (Servicebio, GB13440) overnight at 4°C. Secondary fluorescent antibodies conjugated with FITC and Cy3 (Servicebio, GB22303 and GB21301) were added for 1 hour and 4',6-diamidino-2-phenylindole (DAPI) (Servicebio, G1012) was used for nuclear staining. The percentages of CD3+ T cells in tumor tissues were quantified manually as the percentage of green labeled cells (CD3+ T cells) to all cells (DAPI). Images were obtained with a confocal microscope (Olympus) under a 60×oil objective.
Immunohistochemical analysis
Paired tumor and adjacent non-tumor tissue samples were obtained with informed consent from Tongji Hospital of HUST (Wuhan, China). The demographic and clinical characteristics of the enrolled patients are presented in online supplemental table S1. The specimens were isolated at the time of surgery, formalin fixed and paraffin embedded, and stained with H&E. TROP2 expression was scored as follows: multiplication of the intensity of immunostaining ((1) mild; (2) moderate; (3) strongly positive) and the percentage of positive tumor cells, which resulted in a score of 0–300. A score <10 was considered as 0, a score of 10–40 was considered as 1, 41–140 as 2 and 141–300 as 3. Standard immunohistochemistry was performed with antibodies against TROP2 (Abcam, ab214488), CD3 (Servicebio, GB13440) then examined by two blinded pathologists.
Supplemental material
Mouse xenograft model
Seven weeks old female NOD/ShiLtJGpt-Prkdcem26Il2rgem26/Gpt (NCG) mice were purchased from Gempharmatech (Nanjing, China). 2×10⁶ MDA-MB-231 cells were subcutaneously injected into the right dorsal flank of animals. When tumors reached a size between 70 and 100 mm³, mice were randomized into groups and 5×10⁶ PBMCs were injected intravenously. Then mice were received without or with indicated concentrations of F7AK3 twice a week for 4 weeks. Tumor sizes were measured by an electronic caliper twice per week and calculated according to the formula ‘tumor volume=length × width2/2’. At day 42, all mice were sacrificed and tumors were collected.
Statistics
Data were graphed using GraphPad Prism software. Statistical significance was determined by unpaired Student’s t-test, one-way analysis of variance (ANOVA) or two-way ANOVA. A p value of less than 0.05 was considered significant. *p<0.05; **p<0.01; ***p<0.001; ns, not significant.
Results
TROP2 is highly expressed in TNBC tissues and cells
To evaluate the expression of TROP2 in human primary breast cancer tissues, we analyzed TROP2 abundance with immunohistochemistry in 33 breast cancer tissues and adjacent tissues from three subtypes: HER2+, luminal and TNBC. We found that TROP2, as well as KI67, was highly expressed in breast cancer tissues compared with para-carcinoma tissues in all three subtypes, with no significant difference among the three subtypes (figure 1A,B, online supplemental figure S1A,B). In contrast, CD3 positive lymphocytes were largely identified in the stromal areas around the tumor nests (eight out of nine TNBC cases, figure 1A,C, online supplemental figure S1A,B). Next, we compared TROP2 expression in four human breast cancer cell lines, including three basal-like, triple negative subtypes (MDA-MB-468, MDA-MB-231 and HCC1395) and one luminal, HER2 negative subtype (MCF7). While MCF7 cells had low expression of TACSTD2, the gene encoding TROP2, MDA-MB-231, MDA-MB-468 and HCC1395 cells had evident expression of TACSTD2 (figure 1D). Of which, MDA-MB-468 had the highest expression (figure 1D). We further evaluated the amounts of TROP2 protein with immunoblot and flow cytometry assays. Comparing to MCF7 cells, all other three cell lines had significant enhanced expression of TROP2 (figure 1E,F, online supplemental figure S1C). Taken together, these data demonstrated that TROP2 is highly expressed in TNBC tumor cells, tumor tissues but not adjacent normal tissues.
Supplemental material
Supplemental material

TROP2 is highly expressed in TNBC tumor tissues and cells. (A) H&E and IHC staining of TROP2, CD3 and KI67 in TNBC tumor and paratumor tissues and representative images are shown (n=9). Scale bar, 100 µm. (B) TROP2 expression scores in TNBC tumor and paratumor tissues measured by IHC (n=9). (C) The percentages of T cells in TNBC tumor and paratumor tissues measured by IHC staining with anti-CD3 antibody (n=9). (D) Quantitative PCR analysis of TACSTD2 expression in four breast cancer cell lines. (E) TROP2 expression in four breast cancer cell lines was determined by flow cytometry using anti-TROP2 (Biolgend, 363804) and histograms of the MFI (median fluorescence intensity) of TROP2 from three experiments were shown (F). Experiments were repeated for three times (D–E). Significance measured by unpaired t test (C) and one-way ANOVA (F). Mean±SEM; *p<0.05; **p<0.01; ***p<0.001. ANOVA, analysis of variance; IHC, immunohistochemistry; TNBC, triple negative breast cancer; TROP2,trophoblast cell surface antigen 2.
Characterization and binding capacity of F7AK3 to the breast cancer cells
To facilitate the traffic of T cells into tumor foci and enhance their killing of TNBC tumor cells, we sought to develop a bispecific antibody recognizing both CD3 and TROP2 but with higher affinity to TROP2. This would prevent unwanted activation of T cells in periphery and trap T cells within tumors. To this end, we developed a bispecific antibody (referred as F7AK3) that fused a single chain variable fragment of anti-CD3 with a human anti-TROP2 IgG at its Fc part, as depicted in figure 2A.

The characterisation of F7AK3 bispecific antibody. (A) Schematic of F7AK3 bispecific antibody that contains a single chain of variable fragment of anti-CD3 fused with anti-TROP2 IgG. (B–E) Flow cytometry analysis of binding of increasing amounts of F7AK3 to MCF7 (B), MDA-MB-231 (C), MDA-MB-468 (D), HCC1395 (E) and CD3+ T cells (F). (G) The EC50 of F7AK3 binding capacities with target cells was calculated. (H) HCC1395 cells and activated T cells were cocultured for 30 min with or without F7AK3. Representative immunofluorescence images were shown. CD3 (green), TROP2 (red) and DAPI (blue). All experiments were repeated for three times. TROP2, trophoblast cell surface antigen 2.
The purity of monomeric bispecific antibody was >99% (online supplemental figure S2A,B). We saw a dose-dependent increase of antibody heavy chain and light chain band intensities with higher concentration of antibody (online supplemental figure S2B). F7AK3 interacted with the CD3 protein with a calculated dissociation constant Kd of 16.51 nM (online supplemental figure S2C,E). There was a stronger interaction between F7AK3 with TROP2 protein with a calculated Kd of 4.35 nM (online supplemental figure S2C–E).
Supplemental material
Next, we used flow cytometry to determine the binding activities of the F7AK3 to the aforementioned four breast cell lines. While MCF7 cells had minimal binding to F7AK3, MDA-MB-231 had intermediate binding and MDA-MB-468, HCC1395 had higher binding (online supplemental figure S2F). Calculated EC50 values were from 53.24 ng/mL for HCC1395 to 204.8 ng/mL for MCF7 (figure 2B–E and G), which correlates with the expression levels of TROP2. Consistent with the lower affinity to CD3, the binding EC50 for T cells was 568.3 ng/mL (figure 2F,G). To investigate whether the antibody can facilitate the engagement of T cells with tumor cells, we cocultured previously activated human T cells with HCC1395 with or without F7AK3. In the presence of the antibodies, we found TROP2 positive tumor cells were surrounded with CD3+ T cells but not in the F7AK3 untreated group (figure 2H).
Together, these data demonstrated that the binding affinities of F7AK3 to the tumor cells correlate with the expression levels of TROP2 and the antibody is capable of facilitating the engagement of T cells with TROP2 positive tumor cells.
F7AK3 activates T cells requiring the presence of TROP2-positive tumor cells
Next, we investigated the ability of F7AK3 to activate T cells in the absence or presence of TROP2-positive MDA-MB-231 tumor cells. Using CD25 and CD69 as markers of T cell activation, neither tumor cells nor antibodies alone activated CD4+ or CD8+ T cells (figure 3A,B). In contrast, in the presence of tumor cells, F7AK3 significantly activated T cells, to a greater extent than commercial CD3 agonist antibody (clone OKT-3, figure 3A,B). A similar pattern was observed for the expression of PD-1, another marker for T cell activation (figure 3C).
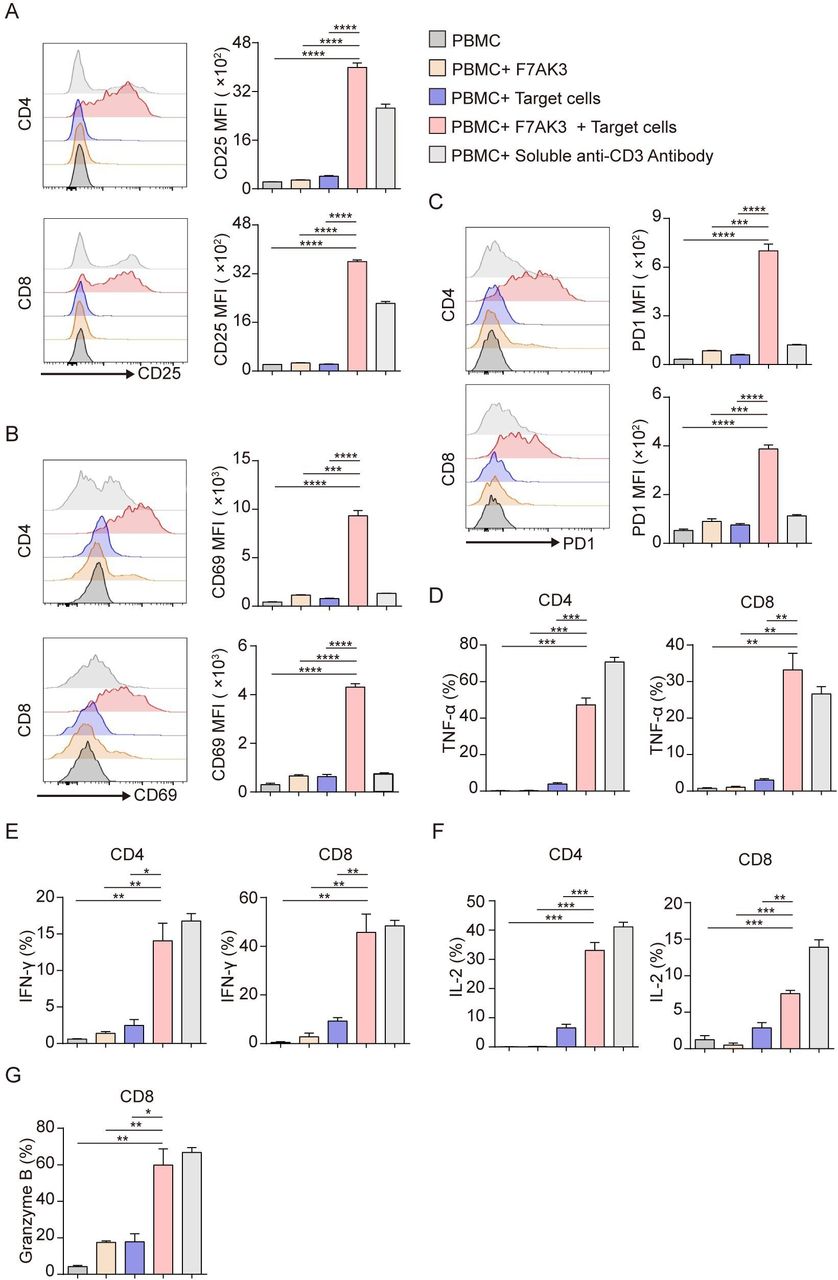
The activation of T cells by F7AK3 requires the presence of target tumor cells. (A–G) Isolated PBMCs from healthy donors were cultured with target MDA-MB-231 cells at an E:T ratio of 3:1, in the presence or absence of 1 µg/mL F7AK3 for 72 hours. Afterwards, surface expression of CD25 (A), CD69 (B), PD1 (C) on CD4+ and CD8+ T cells were determined by flow cytometry. (D–G) After 72 hours, cocultured cells were stimulated with PMA, ionomycin and Golgiplug for another 4 hours. Cytokines production of TNF-α (D), IFN-γ (E), IL-2 (F) in CD4+ and CD8+ T cells and granzyme B production (G) in CD8+ T cells were determined by intracellular staining. All experiments were repeated for three times with similar results. Mean±SEM; *p<0.05; **p<0.01; ***p<0.001. IFN-γ, interferon γ; IL-2, interleukin 2; MFI, median fluorescence intensity; PBMCs, peripheral blood mononuclear cells; TNF-α, tumor necrosis factor α.
We next compared the expression of cytokines in T cells activated by F7AK3 including TNF-α, IFN-γ, and IL-2. We found little production of cytokines by T cells when PBMCs were unstimulated, or stimulated with either antibodies or tumor cells alone (figure 3D–F). However, in the presence of MDA-MB-231 cells, F7AK3 induced significantly enhanced percentages of TNF-α-, IFN-γ-, and IL-2-postive CD4+ and CD8+ T cells, comparable to the agonist CD3 antibody (figure 3D–F). The same pattern was observed for Granzyme B expression in CD8+ T cells (figure 3G). Subsequently, we compared the extent of T cell activation measured by CD25 and CD69 expression and the amounts of cytokine production between TROP2 high expression HCC1395 cells and TROP2 low expression MCF7 cells. In the group of HCC1395 cells, F7AK3 elicited a higher extent of T cell activation and induced heightened percentages of cytokine production cells (online supplemental figure S3A–D).
Supplemental material
Taken together, these data suggest that F7AK3 only activated T cells in the presence of TROP2 positive tumor cells and this activation was dependent of the presence of TROP2 antigen.
F7AK3 induces T cell cytotoxicity to tumor cell lines
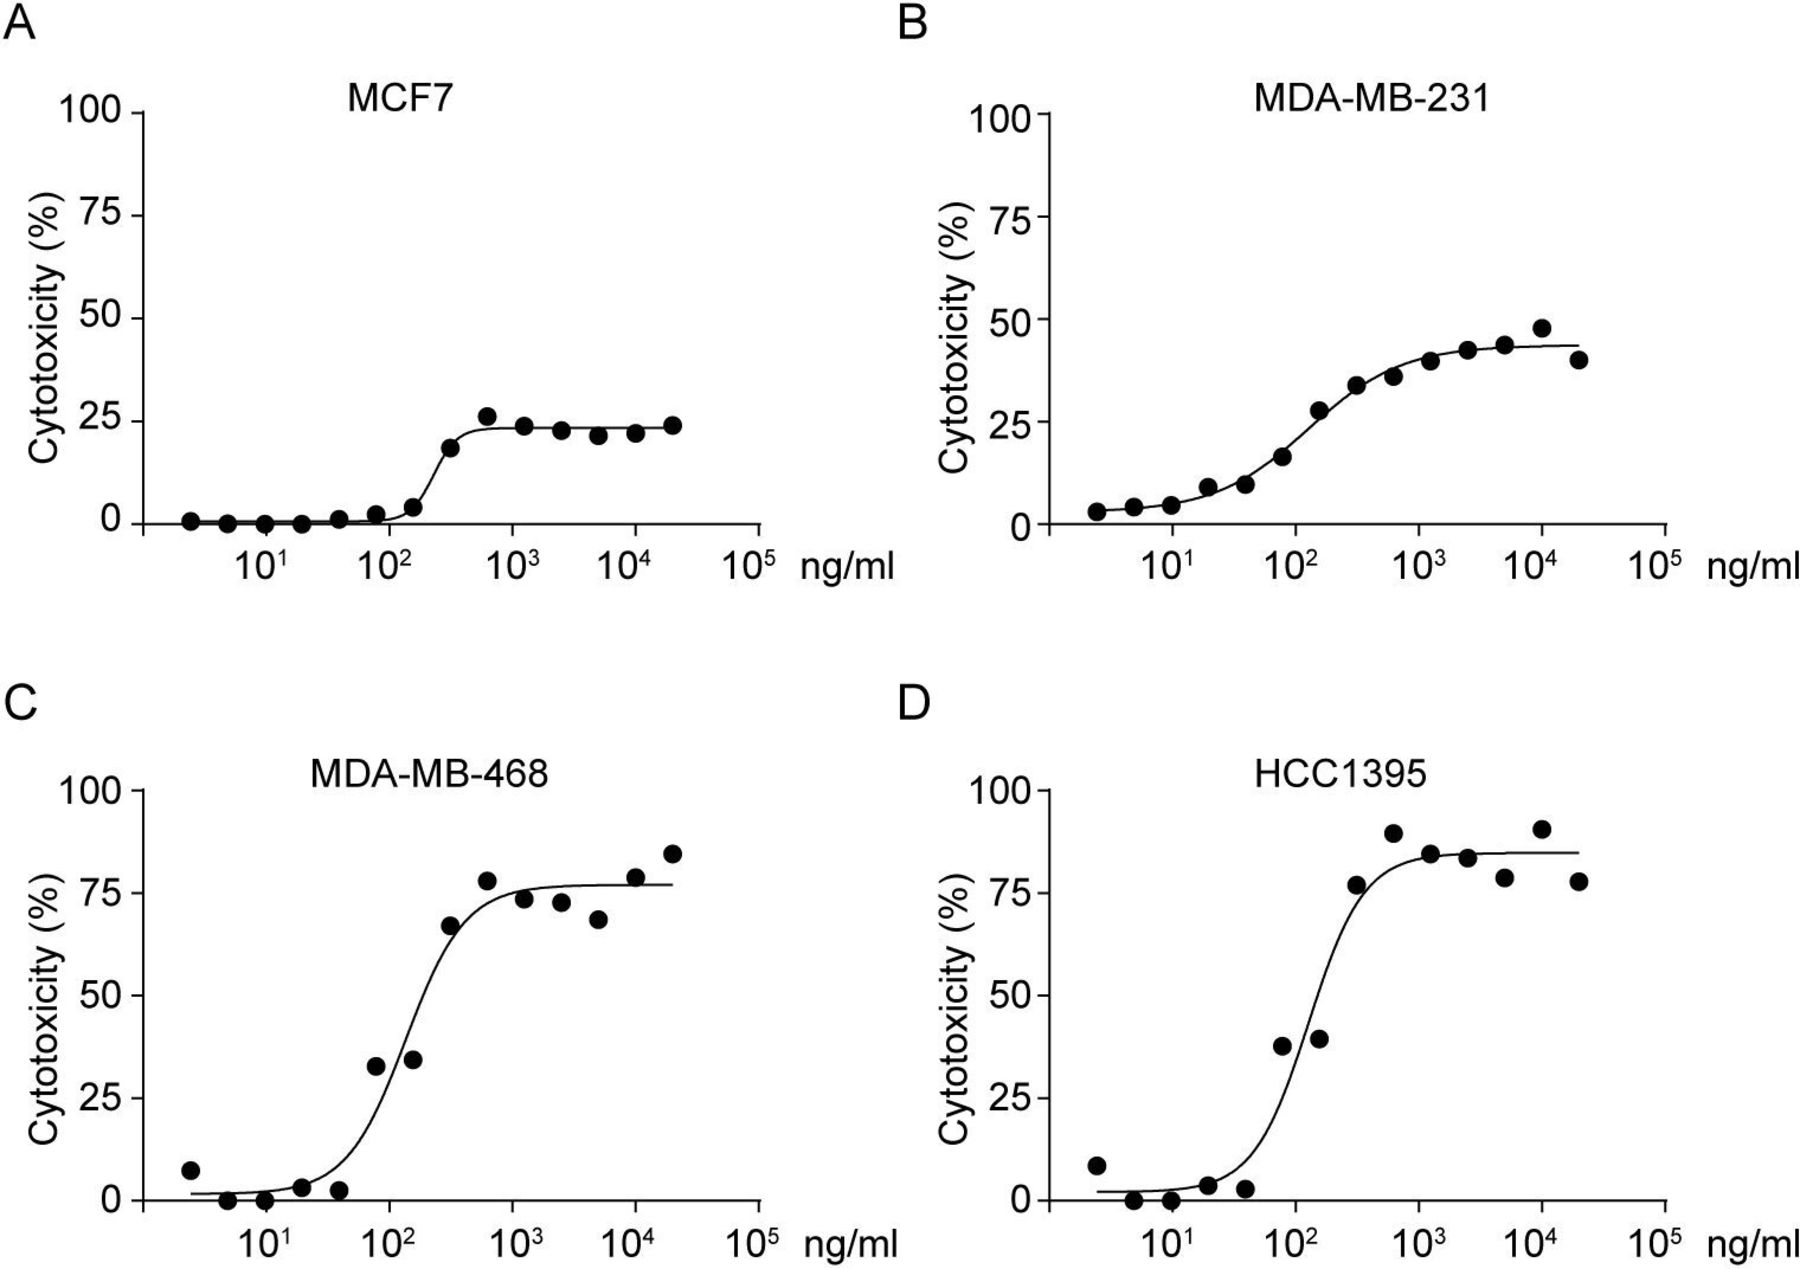
Next, we compared the T cell cytotoxicity induced by F7AK3 among different tumor cell lines. Each of tumor cell lines were co-incubated with activated T cells at various concentrations of F7AK3 for 24 hours. While 103 ng/mL F7AK3 induced maximum killing of all tested tumor cells, the cytotoxic potency was approximately 25% in MCF7, 50% in MDA-MB-231, 75% in MDA-MB-468 and 82% in HCC1395 cells (figure 4A–D). These percentages correlated with the levels of TROP2 expression. F7AK3 did not bind to murine 4T1 breast cancer cells (online supplemental figure S4A), a TROP2-negative cell line.34 Accordingly, the antibodies did not elicit any T cells cytotoxicity to 4T1 cells, irrespective of concentration (online supplemental figure S4B).
Supplemental material

F7AK3 induces cytotoxicity of T cells against breast cancer cells. (A–D) Human PBMCs were isolated and activated by TCR stimulation with plate-bound anti-human CD3/CD28 (clone OKT-3 and clone 9.3 BIO X cell, respectively, 5 µg/mL of each) for 3 days, followed by IL-2 (20 ng/mL) stimulation for 5 days. Tumor cells were cocultured with activated T cells at an E:T ratio of 5:1 in the presence of varying concentrations of F7AK3 for 24 hours. The cytotoxicity against tumor target cells MCF7 (A), MDA-MB-231 (B), MDA-MB-468 (C), and HCC1395 (D) was measured by the amounts of released LDH relative to a control containing 3% Trion X-100. Experiments were repeated for three times. IL-2, interleukin 2; PBMCs, peripheral blood mononuclear cells.
To evaluate whether F7AK3 affects tumor cell proliferation and apoptosis, we incubated tumor cells with or without F7AK3. We found that antibodies alone affected neither the cell apoptosis nor the cell proliferation of tested cell lines (online supplemental figure S5A–H). Taken together, these data demonstrated that F7AK3 elicited T cell-mediated cytotoxicity to TROP2-positive cells and the extent of cytotoxicity is associated with the levels of TROP2 expression.
Supplemental material
F7AK3 induces T cell-mediated killing of primary TNBC tumor cells
To investigate whether the effects of F7AK3 on tumor cell lines can be recapitulated in primary TNBC cells, we repeated the experiments with human primary TNBC cells. The subtype of primary breast cancers was determined with immunohistochemistry staining of PR, ER, and HER2 (Data not shown). Human primary TNBC cells also expressed TROP2 (figure 5A). In addition, F7AK3 bound to primary TNBC cells in a dose-dependent manner (figure 5B and C). In response to F7AK3, T cells were coalescent to primary TNBC tumor cells (figure 5D). Similar to the results obtained with cell lines, coculture of primary TNBC cells with PBMCs in the presence of F7AK3, both CD8+ T cells and CD4+ T cells had significantly upregulation of surface CD25 and CD69, compared with the groups without F7AK3 (figure 5E,F). The activated CD8+ T cells had enhanced Granzyme B expression in the presence of F7AK3 (figure 5G,H). Meanwhile, F7AK3 elicited killing of primary TNBC cells by T cells in a dose-dependent manner (figure 5I). Together, these data demonstrated that F7AK3 induces dose-dependent T cell killing of primary TNBC cells.

F7AK3 bispecific antibody induces T cell killing of primary TNBC cells. (A) TROP2 expression in primary TNBC cells was determined by flow cytometry using anti-TROP2 (Biolgend, 363804). (B) Human primary TNBC cells were stained with F7AK3 (1 µg/mL), followed by PE-conjugated anti-human IgG Fc staining. Blank staining contains no first antibody. (C) Flow cytometry analysis of binding of increasing amounts of F7AK3 to primary TNBC cells. (D) Human PBMCs were isolated and activated by TCR stimulation (clone OKT-3 and clone 9.3 BIO X cell, respectively, 5 µg/mL of each) for 3 days, followed by IL-2 (20 ng/mL) stimulation for 5 days. Human primary TNBC cells and activated T cells were cocultured for 30 min with or without F7AK3. Representative immunofluorescence images were shown. CD3 (green), TROP2 (red) and DAPI (blue). (E–H) PBMCs were cultured with primary TNBC cells at an E:T ratio of 3:1, in the presence or absence of 1 µg/mL F7AK3 for 72 hours. Surface expression of CD25 (E), CD69 (F) on CD8+ and CD4+ T cells were determined by flow cytometry. (G–H) After 72 hours, cocultured cells were stimulated with PMA, ionomycin and Golgiplug for another 4 hours. Granzyme B production in CD8+ T cells were determined by intracellular staining. Representative images (G) and histograms (H) were shown. (I) Human primary tumor cells were cultured with activated T cells in the presence of increasing amounts of F7AK3 for 24 hours. The amounts of LDH released were measured to determine the T cell-mediated tumor cell killing. All experiments were repeated for three times with similar results. The statistics significance was determined with unpaired t-test. Mean±SEM; *p<0.05; **p<0.01; ***p<0.001. IL-2, interleukin 2; MFI, median fluorescence intensity; PBMCs, peripheral blood mononuclear cells; TNBC, triple negative breast cancer; TROP2, trophoblast cell surface antigen 2.
F7AK3 inhibits the TNBC tumor growth in a xenograft model
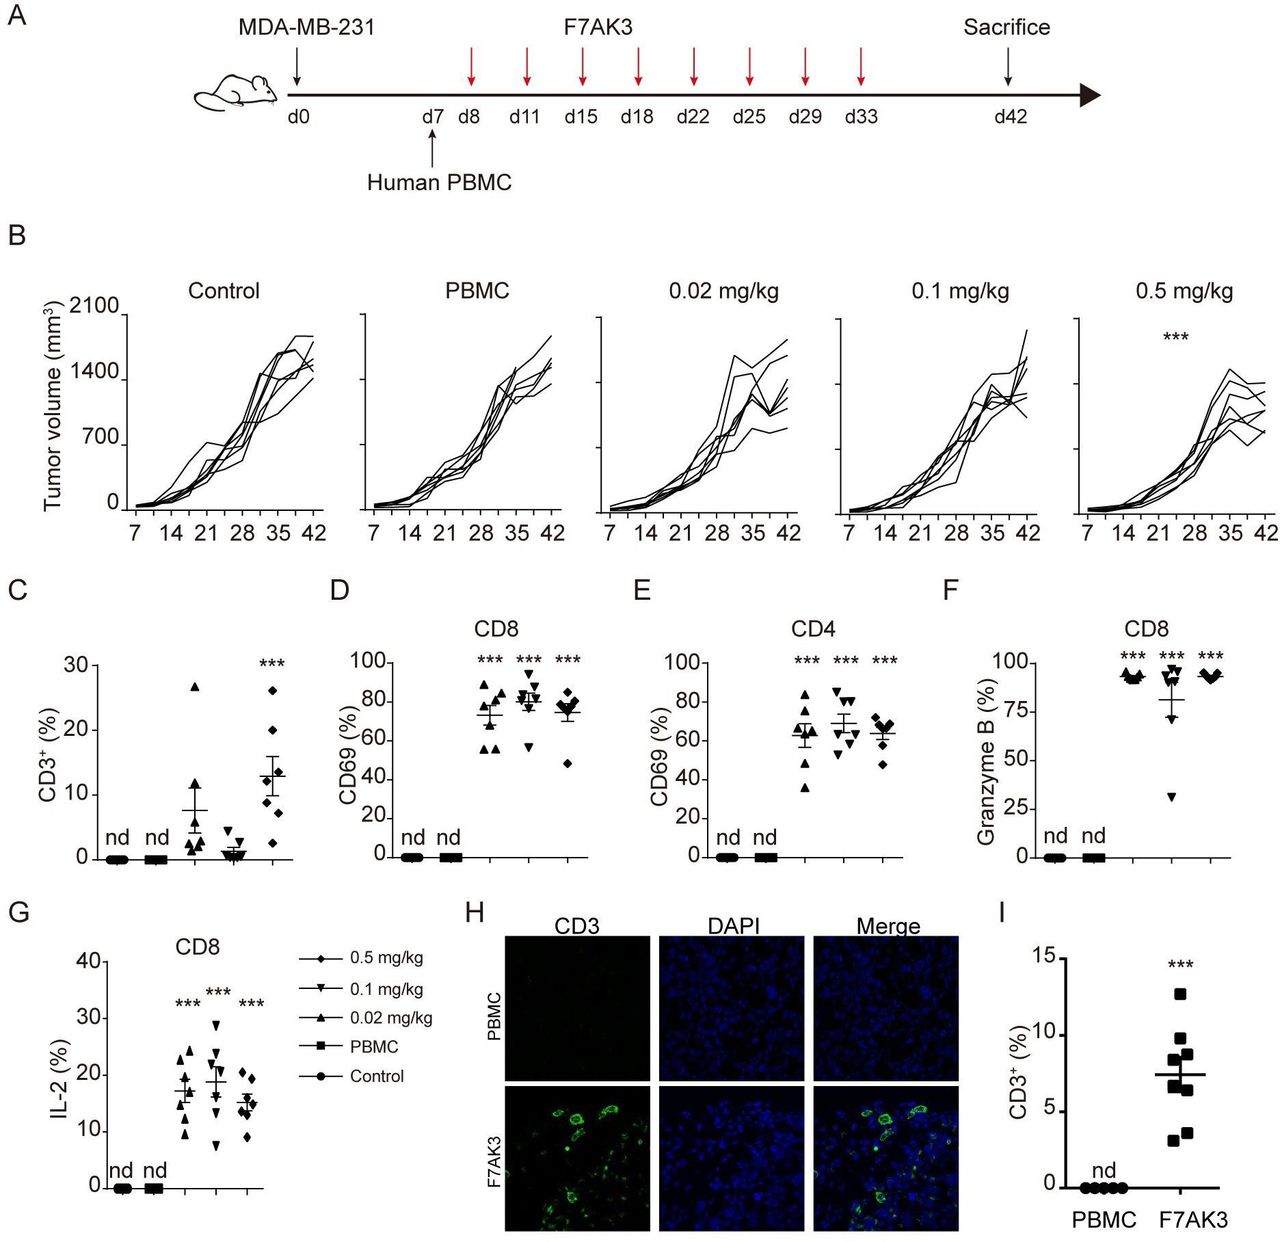
To evaluate the effects of the F7AK3 on tumor growth, we employed a widely used tumor xenograft model with nonobese diabetic/severe combined immunodeficiency (NOD/ShiLtJGpt-Prkdcem26Il2rgem26/Gpt, NCG) mice, followed by reconstitution of human PBMCs at day 7 and antibody treatments, as depicted (figure 6A). Despite the relatively low expression of TROP2, the aggressive TNBC cell line, MDA-MB-231 cells grew better in NCG mice, compared with MDA-MB-468 (Data not shown). Thus, we chose MDA-MB-231 cells for the xenograft experiments. F7AK3 treatment did not affect mouse weights (online supplemental figure S6A). F7AK3 treatment at a concentration of 0.02 mg/kg or 0.1 mg/kg modestly reduced tumor burden. At a concentration of 0.5 mg/kg, F7AK3 treatment significantly reduced tumor growth and tumor sizes, compared with the control group or PBMCs alone group (figure 6B, online supplemental figure S6B). In the PBMC alone group, there was no detectable presence of human CD45+ cells, CD3+ T cells, CD8+ and CD4+ T cells in the spleens or tumor tissues (figure 6C, online supplemental figure 6C–F). However, mice that received either dose of F7AK3 had significant expansion of human immune cells in the spleens and tumors. This was particularly evident in the group that received the highest antibody dose of 0.5 mg/kg (figure 6C, online supplemental figure 6C–F). Furthermore, F7AK3 treated groups had skewed CD8+ T cells over CD4+ T cells (figure 6C, online supplemental figure 6C–F). Treatment of F7AK3 induced in vivo expression of CD69 and PD1 in both CD8+ and CD4+ T cells (figure 6D,E, online supplemental figure 6G,H). In addition, antibodies significantly induced Granzyme B and IL-2 expression in CD8+ T cells (figure 6F,G). Moreover, we found a significant increase of T cells within tumor tissues in F7AK3 treated groups compared with PBMCs group using immunofluorescence staining (figure 6H). Together, these data demonstrated that the investigative F7AK3 bispecific antibody inhibits TNBC tumor growth in vivo via recruiting T cells into and activating T cells within tumor tissues.
Supplemental material
F7AK3 induces T cell accumulation and reduces tumor burden in a xenogeneic tumor model. (A) Schematic representation depicts the xenograft mouse model. NOD/ShiLtJGpt-Prkdcem26Il2rgem26/Gpt (NCG) immunodeficient mice were subcutaneously injected with 2.5×10⁶ MDA-MB-231 cells. after 7 days, mice were injected with 5×10⁶ human PBMCs intravenously and starting at day 8, mice were treated without or with varying doses of F7AK3 twice a week for four consecutive weeks (n=7 per group). Tumor volumes were measured twice per week. At day 42, mice were sacrificed. (B) Tumor growth curves of all mice were shown, means±SEM. (C) The percentages of CD3+ T cells among single cells of tumor tissues were determined flow cytometry. (D, E) The percentages of CD69+ T cells in CD8+ (D) and CD4+ (E) T cells were assessed by flow cytometry. (F, G) The expression of granzyme B (F) and IL-2 (G) in CD8+ T cells was determined by intracellular staining. (H, I) Immunostaining for CD3 (green) in isolated tumors from PBMCs group and 0.5 mg/kg F7AK3 treated group. Representative images (H) and the percentages of CD3+ T cells among all the tissues cells were quantified manually (I). Data were analyzed by two-way ANOVA analysis with Tukey’s multiple comparisons test (B), one-way ANOVA analysis with Brown-Forsythe test (C–G) and unpaired t-test (H). Mean±SEM; *p<0.05; **p<0.01; ***p<0.001. ANOVA, analysis of variance; IL-2, interleukin 2; Nd, not detected; PBMCs, peripheral blood mononuclear cells.
Discussion
In this preclinical study, we developed and characterized the binding activities and antitumor activities of a TROP2xCD3 bispecific antibody (F7AK3) to both TNBC cell lines and primary tumor cells in vitro. We further found F7AK3 suppressed human TNBC growth in a xenograft NCG immunodeficient mouse model in which mice were reconstituted with human PBMCs.
There was remarkable progress that has been made during the last few years for the treatment of advanced or metastatic TNBCs, including targeted strategies of PARP and TROP2 and combination of ICIs with chemotherapies.7–11 13 14 The efficacy of ICIs is affected by the subtypes of tumor microenvironments (TMEs).35–37 It has been reported that the TMEs can be clustered into three groups: immune-desert type that lacks lymphocyte infiltration, innate immune-inactivated type that infiltrated with inactivated innate immune cells and immune-inflamed type that infiltrated with high numbers of innate and adaptive immune cells.38 Only the immune-inflamed type TME is predicted to benefit from ICI therapies,38 which limits the efficacy of ICIs for TNBC patients. Strategies for activating tumor antigen-specific T cells might enhance the immunotherapy efficacy for advanced or metastatic TNBC.
TROP2 is highly expressed in numerous solid tumors including ovarian, colorectal and breast cancers.16 In our hands, TROP2 was differentially expressed in tested human breast cancer tissues. The expression of TROP2 was minimal in the tumor adjacent normal breast tissue (figure 1A), which is consistent with previous studies.16 These data suggest off-target effects may be limited if BiTE strategies targeting TROP2 are used for the treatment of TNBC. Although it is not specifically upregulated in TNBC tumors, given its highly enhanced expression pattern compared with adjacent normal tissues, TROP2 represents a suitable target for TNBC. The expression of TROP2 and CD3 in TNBC (n=9) seems to be mutually exclusive (8/9, figure 1A–C), indicating a major immune cell excluded type of TME in TNBC patients. These data also highlight the critical importance of directing T cells into tumor tissues for the successful treatment of TNBC.
ADCs using anti-TROP2 have been investigated in both preclinical and clinical studies.14 21 39 Sacituzumab govetican inhibits growth of multiple types of tumors including breast cancers and has been recently approved to treat relapsed or refractory metastatic TNBC.14 21 39 Combinational treatment of an anti-CD3xTROP2 bispecific antibody with IFN-α suppresses tumor growth in human pancreatic and gastric cancer xenografts.40 Our investigation of F7AK3 antibody did not induce significant T cell activation in the absence of target cells (figure 3), indicating a specific activation of T cells, minimizing off-target T cell activation and immune-related adverse events.
F7AK3 monotherapy induced infiltration of T cells into tumor tissues and activation of T cells, subsequently resulting in inhibition of tumor growth in a preclinical model (figure 6). However, we did not observe dose-dependent effects of F7AK3 for anti-tumoral effects. Nevertheless, we found that in the 0.5 mg/kg group, starting from day 35, the tumor growth was halted comparing to the growth curves in the groups of 0.02 mg/kg and 0.1 mg/kg. This could be due to the lower expression of TROP2 of MDA-MB-231 cells.
F7AK3 has differential binding affinities to TROP2 versus CD3. Our data demonstrate the high potency of in vitro tumor cells killing by F7AK3 in the presence of PBMC cells, which correlates to TROP2 expression. It is yet unknown whether this effect will be able to translate into clinical studies. It should be noted that in the phase 3 ASCENT trial, the majority of patients (80%) had high/medium tumor TROP2 expression and the small number of patients with low TROP2 expression limits definitive conclusions on benefit of sacituzumab govetican on this group.41 Currently, it remains unclear whether the extent of TROP2 expression is related to clinical benefit and would F7AK3 be appropriate in patients with low TROP2 expression such as ER+ tumors. More in vivo studies with higher doses and subtypes of breast cancers with differential TROP2 expression levels would provide valuable information on the antitumoral effects of F7AK3.
This proof-of-concept study of F7AK3 is also limited. As a CD3 BiTE, it would redirect pan T cell populations into the tumors, which may also include exhausted CD8+ T cells and immunosuppressive regulatory T cells. It remains unclear to what extent F7AK3 would recruit the non-antitumoral T cells. In addition, further studies on whether F7AK3 can potentially elicit exuberant T cell activation or heightened cytokine production in vivo are warranted.
In summary, our data demonstrate potent antitumor activity of F7AK3 against TNBC cells both in vitro and in vivo, which warrants further study and clinical evaluation of F7AK3 as an immunotherapy alone or in combination with other agents for advanced TNBC patients.
Data availability statement
Data are available on reasonable request. All data relevant to the study are included in the article or uploaded as online supplemental information.
Ethics statements
Patient consent for publication
Ethics approval
Studies with human breast cancer specimens have been approved by the Ethics Committee of Tongji Medical College, Huazhong University of Science and Technology (HUST) (Wuhan, China), and signed informed consents were obtained from all patients. All animal experiments were performed according to the guidelines of the Institutional Animal Care and Use Committee of Tongji Medical College, HUST.
Acknowledgments
We thank Dr Arian J Laurence, University of Oxford for editing and proofreading of the manuscript.
References
Supplementary materials
Supplementary Data
This web only file has been produced by the BMJ Publishing Group from an electronic file supplied by the author(s) and has not been edited for content.
Footnotes
HL and LB contributed equally.
Contributors Conception and design: HL, AQY and X-PY. Development of methodology: HL, NN, XD and LL. Acquisition of data (provided animals, acquired and managed patients, provided facilities etc): JM, LH and JW. Analysis and interpretation of data (eg, statistical analysis, biostatistics, computational analysis): HL, YD, AQY and X-PY. Writing, review, and/or revision of the manuscript: HL, AQY and X-PY, Administrative, technical, or material support (ie, reporting or organizing data, constructing databases): HL, LB, NN, XD, LL, YL, YD, MX, YC, LZ, YL and QM, Study supervision: AQY and X-PY. All authors reviewed and approved the final manuscript.
Funding This work was supported by the Key Special Project of Ministry of Science and Technology, China (2019YFC1316200), and grants from the National Scientific Foundation of China to X-PY (32070890, 81671539).
Competing interests No, there are no competing interests.
Provenance and peer review Not commissioned; externally peer reviewed.
Supplemental material This content has been supplied by the author(s). It has not been vetted by BMJ Publishing Group Limited (BMJ) and may not have been peer-reviewed. Any opinions or recommendations discussed are solely those of the author(s) and are not endorsed by BMJ. BMJ disclaims all liability and responsibility arising from any reliance placed on the content. Where the content includes any translated material, BMJ does not warrant the accuracy and reliability of the translations (including but not limited to local regulations, clinical guidelines, terminology, drug names and drug dosages), and is not responsible for any error and/or omissions arising from translation and adaptation or otherwise.