Article Text

Abstract
Background Adoptive T-cell transfer has become an attractive therapeutic approach for hematological malignancies but shows poor activity against large and heterogeneous solid tumors. Interleukin-12 (IL-12) exhibits potent antitumor efficacy against solid tumors, but its clinical application has been stalled because of toxicity. Here, we aimed to develop a safe approach to IL-12 T-cell therapy for eliminating large solid tumors.
Methods We generated a cell membrane-anchored IL-12 (aIL12), a tumor-targeted IL-12 (ttIL12), and a cell membrane-anchored and ttIL-12 (attIL12) and a cell membrane-anchored and tumor-targeted ttIL-12 (attIL12) armed T cells, chimeric antigen receptor-T cells, and T cell receptor-T (TCR-T) cells with each. We compared the safety and efficacy of these armed T cells in treating osteosarcoma patient-derived xenograft tumors and mouse melanoma tumors after intravenous infusions of the armed T cells.
Results attIL12-T cell infusion showed remarkable antitumor efficacy in human and mouse large solid tumor models. Mechanistically, attIL12-T cells targeted tumor cells expressing cell-surface vimentin, enriching effector T cell and interferon γ production in tumors, which in turn stimulates dendritic cell maturation for activating secondary T-cell responses and tumor antigen spreading. Both attIL12- and aIL12-T-cell transfer eliminated peripheral cytokine release and the associated toxic effects.
Conclusions This novel approach sheds light on the safe application of IL-12-based T-cell therapy for large and heterogeneous solid tumors.
- costimulatory and Inhibitory T-cell receptors
- cytokines
- dendritic cells
- immunotherapy
- lymphocytes
- tumor-infiltrating
Data availability statement
No data are available.
This is an open access article distributed in accordance with the Creative Commons Attribution Non Commercial (CC BY-NC 4.0) license, which permits others to distribute, remix, adapt, build upon this work non-commercially, and license their derivative works on different terms, provided the original work is properly cited, appropriate credit is given, any changes made indicated, and the use is non-commercial. See http://creativecommons.org/licenses/by-nc/4.0/.
Statistics from Altmetric.com
- costimulatory and Inhibitory T-cell receptors
- cytokines
- dendritic cells
- immunotherapy
- lymphocytes
- tumor-infiltrating
Background
Adoptive T-cell transfer has yielded remarkable clinical outcomes in patients with CD19-positive hematological malignancies.1–4 However, the application of T-cell therapy against solid tumors has achieved only modest effects5–9 owing to heterogeneous tumor antigen expression,10 poor infiltration into core tumor regions,6 the immune-suppressive tumor microenvironment,11–13 and barriers of the extracellular matrix in solid tumors.10 To overcome these challenges to solid-tumor treatment, T cells must target common tumor-specific antigens, penetrate into tumors and, optimally, stimulate secondary T-cell responses against different antigens to broaden the invigoration of antitumor immunity.
Wild-type interleukin 12 (wtIL12) is a potent antitumor therapeutic agent for the treatment of many types of cancers in murine, canine, and human patients. In a study including 29 patients with ovarian cancer or mesothelioma, 2 were tumor-free after weekly administration of recombinant human wtIL12 (rhIL12), and 8 had stable disease.14 Because of the short half-life of rhIL12, multiple doses were administered in clinical trials to enhance its antitumor efficacy. However, dose-limiting toxicities occurred at doses higher than 300 ng/kg,15 and severe toxicities, including two deaths, were associated with consecutive daily administration of rhIL12 at 500 ng/kg.16 In contrast to the adverse effects from systemic administration of wtIL12-based therapies, intratumoral wtIL12 T-cell and gene therapies are safe and effective against solid tumors.17 Different doses of the wtIL12 gene delivered via intratumoral electroporation elicited complete regression of metastatic tumors in 2 of 19 patients with metastatic melanoma and stable disease in 8 of 19,18 but such local wtIL12 delivery is limited to accessible tumors. To safely use IL-12 therapy systemically, strategies to constrain the release of IL-12 and interferon gamma (IFNγ) within tumors are urgently needed.
Our group reported that cell-surface vimentin (CSV) is exhibited on the surface of a variety of highly malignant solid tumor cells.19 Fusion of the CSV-targeted peptide VNTANST before the stop codon of the IL-12 p40-encoding sequence yielded a tumor-targeted IL-12 (ttIL12). Injection of this gene resulted in ttIL12 protein accumulation at tumor sites in several tumor types20–23 and significantly improved efficacy over wtIL12 therapy against primary, distal, and microscopic metastatic lesions in murine and canine tumor models.21 24 However, this ttIL12 still induced toxic cytokines in the peripheral circulation, although the overall toxicity was reduced.
In this study, we discovered that T cells or chimeric antigen receptor (CAR)-T cells engineered with anchored IL-12 (aIL12) (membrane-aIL12 without tumor targeting sequence) and anchored and ttIL-12 (attIL12) diminished the circulating levels of inflammatory cytokines. Significantly, the attIL12-T cell therapy dramatically enhanced the accumulation of IFNγ+CD8+ T cells in tumors and reduced or stabilized large solid patient-derived xenograft (PDX) tumors. Moreover, the antitumor effect of this approach was enhanced by activation and maturation of dendritic cells (DCs) as well as immune rejection of nontargeted tumor antigens in syngeneic tumor models.
Materials and methods
Animal studies and tumor models
B6 Cd45.1, C57BL/6-Tg (TcraTcrb)1100Mjb/J (OT-1), and CB17SC scid−/− mice of 6–8 weeks of both sexes were purchased from The Jackson Laboratory. The mouse care and handling procedures were approved by the Institutional Animal Care and Use Committee of The University of Texas MD Anderson Cancer Center.
To generate transplant tumors in mice, B16F10OVA (mouse melanoma) tumor cells (5×10⁵) were suspended in 30 µL phosphate-buffered saline (PBS) and subcutaneously inoculated into B6 Cd45.1 mice. Patient-derived OS31, OS1, OS02, OS09, and OS60-SJ osteosarcoma tumor cells (generously provided by Dr. Richard Gorlick, the Pediatric Preclinical Testing Consortium, The University of Texas MD Anderson Cancer Center) were implanted subcutaneously into CB17SC scid−/− mice. Mice were preconditioned with cyclophosphamide (Baxter Healthcare) and followed by 2–3 times of T cell infusions (2.5×10⁶) with 14 days apart. Tumors were measured with calipers twice weekly after implantation. Tumor volume was calculated by the formula V = (π /8) × (a b2), where V=tumor vol in cubic centimeters, a=maximum tumor diameter, and b=diameter at 90° to a. Mice were injected with Brefeldin A (Cell Signaling Technologies, 200 µg/mouse) via intraperitoneal injection 4 hours before euthanization for IFNγ intracellular staining. Mice were sacrificed on notice and survival curves were generated by the Kaplan-Meier method.
Cell culture
B16F10OVA cells were derived from B16F10 melanoma cells that express chicken ovalbumin. CCH.OS.D (OSD) human osteosarcoma cells were cultured in Dulbecco’s modified Eagle medium containing 10% FBS and supplemented with antibiotics, nonessential amino acid solution, and cultured in an incubator maintained at 5% CO2 and 37°C. B7H3 CAR-T cells were expanded and maintained in Dr. Gianpietro Dotti’s laboratory at The University of North Carolina at Chapel Hill.25 26 All the tumor cell lines were characterized by DNA fingerprinting at MD Anderson Cancer Center’s Characterized Cell Line Core Facility within 6 months of initiating the experiments and treated with a mycoplasma removal agent from Bio-Rad to ensure that the cells were free of mycoplasma before inoculation.
Mouse and human T cells
Murine T cells were enriched from splenocytes using a MojoSort mouse CD3 T Cell Isolation Kit (BioLegend) and cultured in Roswell Park Memorial Institute Medium (RPMI)-1640 medium supplemented with 10% FBS, 1% penicillin/streptomycin, and 50 U/mL recombinant murine IL-2 (rmIL-2).
Buffy coats from deidentified healthy blood donors were purchased from the Gulf Coast Regional Blood Center, and their acquisition was approved by the MD Anderson Institutional Review Board. Peripheral blood mononuclear cells (PBMCs) were isolated from buffy coat samples via centrifugation over Ficoll-Pague. Human T cells were enriched from PBMCs using an EasySep Human CD8C T-cell Isolation Kit (STEMCELL Technologies). Human T cells were cultured in 45% RPMI-1640% and 45% Click’s medium containing 10% FBS and supplemented with rhIL-2 (50 U/mL), rhIL-7 (10 ng/mL), and rhIL-15 (5 ng/mL).
Plasmid constructs
Human IL-12 subunit P35 with and without a transmembrane domain and subunit P40 with and without a tumor-targeted peptide were synthesized by Genscript and cloned into a third-generation self-inactivating lentiviral expression vector (Takara Bio, Inc.) under a murine stem cell virus and modified cytomegalovirus promoter.
Generation of lentivirus
High-titer replication-defective lentiviral vectors were produced and concentrated by the MD Anderson Functional Genomics Core Facility. Briefly, HEK293T human embryonic kidney cells were transfected with pVSV-G (a VSV glycoprotein expression plasmid), pCMV-Gag/Pol/Rev, and a transfer plasmid using Lipofectamine 2000 (Thermo Fisher Scientific). The viral supernatant was harvested 48 hours after transfection. Viral particles were concentrated using a Lenti-X Concentrator (Takara Bio).
Mouse and human T-cell lentiviral transduction
Mouse T cells were activated by adding CD3/CD28 Dynabeads (Thermo Fisher Scientific) according to the manufacturer’s instructions and then transduced with lentiviral supernatants. Lentivirus was then added to retronectin (Takara)-coated non-tissue culture–treated plates to reach a total volume of 400 µL and mixed gently. T cells and virus were centrifuged at 1000 g for 2 hours and then incubated at 37°C. After 3 days of culture, the medium was changed to complete RPMI-1640 medium (10% FBS, 2 mM GlutaMAX, 100 µM β-mercaptoethanol, 1% penicillin/streptomycin, 50 U/mL rmIL-2).
Human T cells were stimulated by CD3/CD28 Dynabeads (Thermo Fisher Scientific) according to the manufacturer’s instructions. On day 2, T cells were plated in non-tissue culture-coated 24-well plates, and polybrene (8 µg/mL) was added to the medium. Lentiviral supernatant was first centrifuged at 1500 g for 2 hours on retronectin (Takara)-coated non-tissue culture-treated plates. T cells were then plated and centrifuged at 1000 g for 20 min and incubated at 37°C. After 3 days, the medium was changed to 45% RPMI-1640% and 45% Click’s medium containing 10% FBS and supplemented with rhIL-2 (50 U/mL), rhIL-7 (10 ng/mL), and rhIL-15 (5 ng/mL).
Immunohistochemistry and immunofluorescence staining
Frozen tumor sections were sequentially fixed with cold acetone, acetone plus chloroform (1:1), and acetone. Paraffin-embedded sections were deparaffinized and heated in antigen retrieval buffer. Tissue sections were blocked with 3% H2O2 in distilled water for 20 min and then in blocking buffer (5% normal horse serum and 1% normal goat serum in PBS). Slides were incubated with primary antibodies overnight at 4°C and secondary antibodies for 1 hour at room temperature. For immunohistochemistry staining, the secondary antibody was biotin conjugated, the sections were treated with ABC (avidin-biotin complex) reagent (Vector Labs), and the nuclei were counterstained with hematoxylin (Sigma-Aldrich). Tumor sections were mounted with Cytoseal mounting medium (Life Technologies). Quantifications of immunohistochemistry images were assessed by examining three randomly selected low-power fields per slide. For immunofluorescence staining, tumor sections were mounted in an antifade fluorescence mounting medium with 4′,6-diamidino-2-phenylindole. Slides were visualized under a Nikon Eclipse Ti fluorescence microscope.
ELISA
Tumor lysates were collected from tumor-bearing mice that had undergone the indicated treatments. Serum was collected from the supernatant of centrifuged mouse whole blood. Culture medium was collected at 1 mL medium/106 T cells. Cell lysates were collected from the supernatant of lysed mouse or human T cells. Tumor lysates were collected from tumors that were lysed with radioimmunoprecipitation assay buffer as described previously.27 The levels of IL-12 and IFNγ were measured by using ELISA Ready-SET-Go! kits (eBioscience). The levels of granulocyte-macrophage colony-stimulating factor (GM-CSF), IL-6, and IL-2 were measured using an ELISA MAX Deluxe Set (BioLegend). The level of Flt3L was measured using a mouse Flt-3ligand ELISA Kit PicoKine (Boster Bio).
Flow cytometry
Cells were sequentially incubated with primary and secondary antibodies for 30 min each at 4°C. Stained cells were analyzed using an Attune acoustic focusing cytometer (Applied Biosystems) or a BD LSR-Fortessa cell analyzer (BD Biosciences). Flow cytometry data were analyzed using the FlowJo software program (FlowJo, LLC).
Time-Of-Flight mass cytometry
Tumors were collected from mice that had been subjected to different T-cell transfer treatments. Tumor tissue was digested with collagenase 4 (100 U/mL) and DNase I (100 U/mL) (Sigma-Aldrich), and tumor-infiltrating lymphocytes (TILs) were sorted for CD45+ cells. Fc receptors on the cells were blocked with anti-mouse CD16/32 antibodies, and cells were stained with a cocktail of metal-labeled antibodies (Fluidigm). Samples were diluted in double-distilled H2O with a bead standard and analyzed by a mass cytometer (Fluidigm).
Time-of-flight mass cytometry (CyTOF) antibodies were purchased from Fludigm or conjugated at MD Anderson Cancer Center’s Flow Cytometry Core Facility, including: CD45.2(Ms) 139La; Ly-6G/C 141Pr (MDA); CD39(Ms) 142Nd; CD68(Ms) 145Nd; CD223(Ms) 147Sm; CD11b(Ms) 148Nd; CD134(Ms) 149Sm; CD25(Ms) 150Nd (MDA); CD3e 152Sm (MDA); CD69(Ms) 145Nd (MDA); Foxp3(Ms) 158Gd; CD279(Ms) 159Tb (MDA); CD62L(Ms) 160Gd; iNOS(Ms) 161Dy; TIM-3(Ms) 162Dy; CD152(Ms) 163Dy; CD137(Ms) 165Ho; Arginase-1 166Er; CD8a(Ms) 168Er; CD206(Ms) 169Tm; NK1.1 170Er (MDA); CD44 171Yb (MDA); CD4(Ms) 172Yb (MDA); F4/80(Ms) 173Yb; I-A/I-E(Ms) 174Yb; CD28(Ms) 175Lu; and CD11c(Ms) 209Bi.
CyTOF files were normalized and transformed by MD Anderson Cancer Center’s Flow Cytometry Core Facility. Immune subpopulations were identified by PhenoGraph clustering analysis for the R cytofkit package. The frequency of each cluster was determined by dividing the number of indicated cell events by the number of CD45+ cell events in each sample.
Tumor-cell dissociation
Tumors were minced into 2 mm fragments, placed in 5 mL of dissociate buffer (RPMI-1640 medium with 100 U/mL collagenase type IV and 100 U/mL DNase I), and incubated at 37°C while shaking at 120 rpm for 30 min to 1 hour. The released cells were filtered with 70 µm strainers and centrifuged at 600 g for 5 min, followed by red blood cell lysis. Cells were then resuspended in fluorescence-activated cell sorting solution containing 2% FBS. Single-tumor-cell suspensions were obtained after CD45 depletion using an EasySep Human CD45 Depletion Kit (Stem Cell Technologies).
Microfluidic chip binding assay
A polydimethylsiloxane microfluidics slide chip (Abnova) was coated with 1 mg/mL streptavidin (Agilent). The chip was then washed and coated with 0.4 mg/mL biotin-vimentin (MD Anderson) for 1 hour. Next, 1.5×10⁶ attIL12-T cells (labeled with Calcein Green AM; ThermoFisher) and 1.5×10⁶ control-T cells (labeled with CMTPX red cell tracker; ThermoFisher) were mixed at a ratio of 1:1, loaded into a spiral chamber (Abnova), and passed through the slide chip at a flow rate of 1.8 mL per hour using the Cytoquest microfluidics pump (Abnova). The slide chip was then imaged on a fluorescent microscope (Keyence). Cells were enumerated using Keyence BZ-X700 analysis software.
DC isolation and naive CD8+ T-cell priming
CD45.1+ TILs were sorted from B16F10OVA tumors subjected to Ctrl-, wtIL12-, or attIL12-T cell treatment, and then DCs were isolated from TILs using an EasySep mouse Pan-DC Negative Selection Kit (StemCell Technologies). OT-1 cells were collected from spleens and lymph nodes of OT-1 mice, and CD8+ T cells were enriched using a MojoSort Mouse CD8 T Cell Isolation Kit (Biolegend). Naïve CD8+ T cells were stained with carboxyfluorescein succinimidyl ester (CFSE; 2.5 µM) and cocultured with DCs from different treatment groups at a ratio of 1:5 for 72 hours. CFSE dilution was determined using flow cytometry. Naïve CD8+ T cells were also labeled with BMQC violet cell tracker and cocultured with DCs from different treatment groups at a ratio of 1:5 for 24 hours. CD44 and CD69 expression on CD8+ T cells was determined using flow cytometry.
Statistical analysis
The directly measured outcomes were analyzed using a two-sided Student’s t-test to compare two treatment groups or 1-way analysis of variance to compare more than two treatment groups. The statistical analyses were conducted using GraphPad Prism V.8 software. All data values represent replicates and are shown as median±SEM. Significance was defined as p<0.05.
Results
Design and validation of the attIL12 armored T cells
In an effort to reduce IL-12–mediated off-tumor toxicities, we discovered a linear peptide (VNTANST) that can target CSV, which is expressed in all tumor types and species tested.19 20 24 28 Via systemic administration of the ttIL12 gene, we demonstrated IL-12 accumulation in tumors and tumor growth inhibition across tumor types.20 21 24 However, this treatment was limited to small solid tumors. To boost the antitumor efficacy of ttIL12, in this study we used T cells as a vehicle to carry ttIL12 to tumors. We developed a second-generation ttIL12, attIL12, in which ttIL12 was fused to an EGFR transmembrane encoding peptide. As controls, membrane-aIL12, wtIL12, and ttIL12 were also generated (figure 1A,B). Lentivirus containing these genes were generated and used to transduce human and mouse T cells. attIL12-transduced T cells from independent donors exhibited IL-12 expression on their cell surfaces (figure 1C). This finding was confirmed by immunofluorescence staining of the IL-12 p40 subunit (figure 1D). We compared IL-12 and IFNγ levels in cell lysates and culture medium of ctrl-T, attIL12-T, aIL12-T, and wtIL12-T cells (figure 1E). wtIL12-T cells released high levels of IL-12 and IFNγ in the culture medium. In comparison, the production of IL-12 and induced IFNγ by attIL12-T and aIL12-T cells were severely restricted within cells but not in the medium (figure 1E).
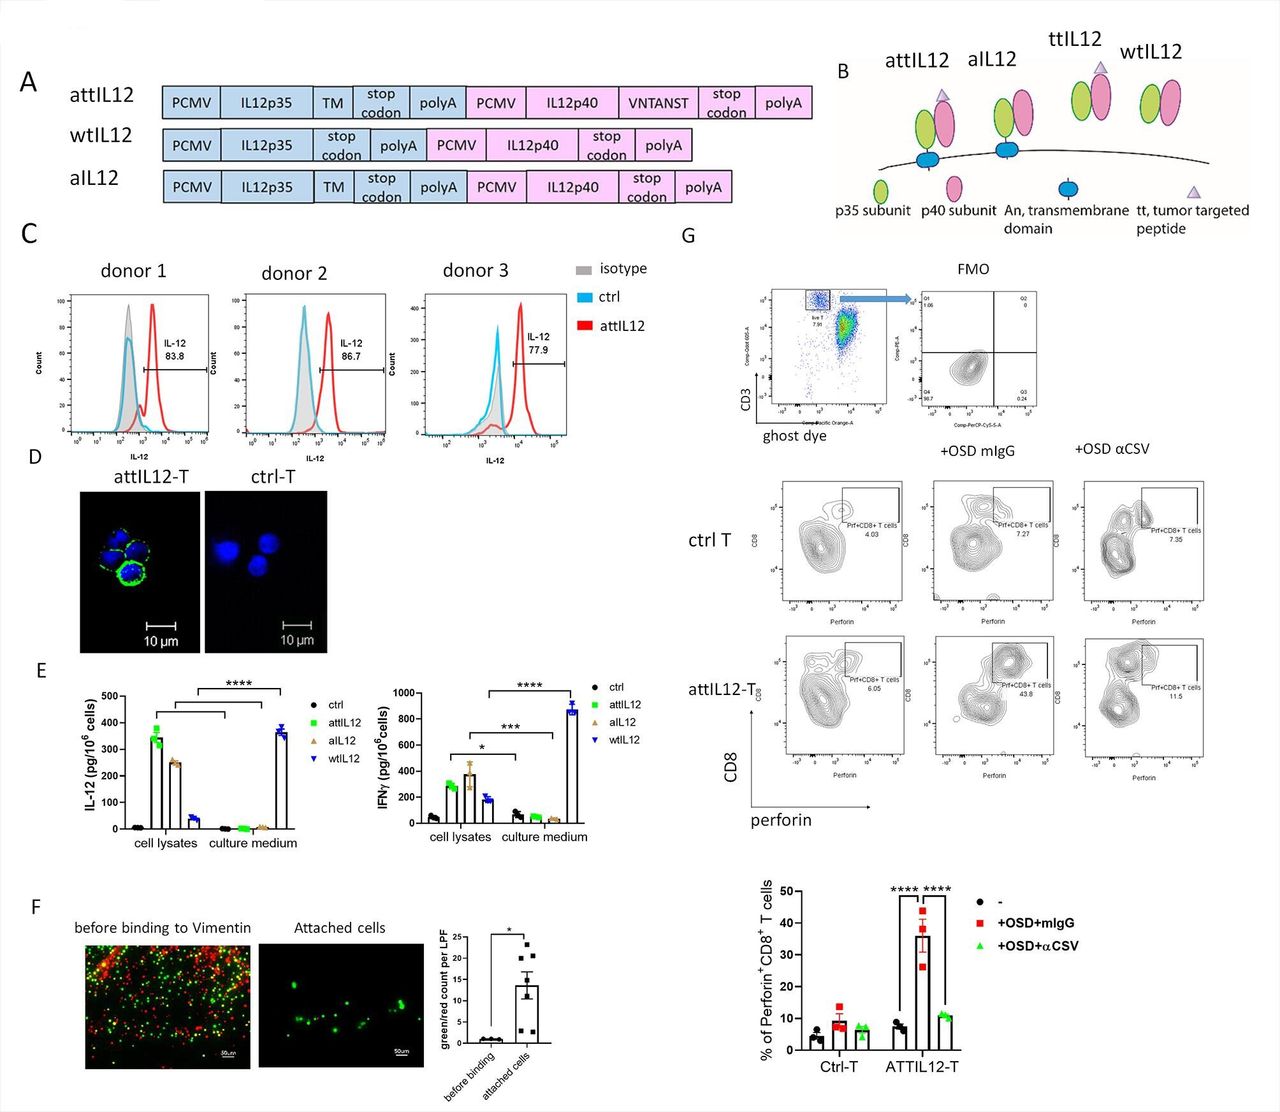
attIL12-T cell structure and in vitro functions. (A) Construct maps of attIL12, wild-type IL-12 (wtIL12), and membrane-anchored IL-12 (aIL12). (B) Schematic showing attIL12, aIL12, tumor-targeted IL-12 (ttIL12), and wtIL12. (C, D) attIL12 expression after lentiviral transduction of human T cells demonstrated by flow cytometry from three representative donors (C) and representative immunofluorescence images (D). Scale bars equal 10 µm. (E) Human T cells were isolated from peripheral blood mononuclear cells of healthy donors and transduced with control, aIL12, wtIL12, or attIL12 lentivirus. IL-12 and IFNγ levels were measured in cell lysates and culture medium. Bar graphs show the median (±SEM) concentrations of IL-12 and IFNγ (n=3). (F) attIL12-T cells (1.5×10⁶; labeled with calcein green am) and control-T cells (labeled with CMTPX red) were mixed at a ratio of 1:1, loaded onto vimentin-coated microfluidic slide chips, and washed using a Cytoquest microfluidics pump. The slide chips were then imaged on a fluorescent microscope. Bar graphs show the ratios of green/red fluorescent cells as the median (±SEM) per low-power field (LPF) before and after washing the chips. Scale bars equal 50 µm. (G) Control-T or attIL12-T cells were cultured alone or cocultured with OSD human osteosarcoma cells at a 3:1 ratio in the presence or absence of a CSV-blocking antibody (10 µg/mL) for 48 hours. Bar graph shows the frequency of perforin+ CD8+ Tcells (±SEM). The results represent three repeated experiments. *P<0.05; ***p<0.001; ****p<0.0001. attIL12, anchored and tumor-targeted IL-12; CSV, cell-surface vimentin; IFNγ, interferon γ; IL-12, interleukin 12; wtIL12, wild-type IL12 OSD, CCH-OS-D human osteosarcoma cell line; PCMV, plasmid vector with a CMV promoter; FMO, fluorescence minus one control.
attIL12 modification stimulates T-cell cytotoxicity against CSV+ tumor cells
To test whether attIL12-T cells truly target CSV, a direct binding assay was conducted using a Cytoquest microfluidic chip that was coated with recombinant vimentin protein. In brief, equal proportions of mixed control-T (red CMTPX labeled) and attIL12-T (green calcein AM labeled) cells were loaded onto the vimentin-coated microfluidic chip, and the chip was washed under microfluidic flow pressure via the automated washing process to capture vimentin-binding cells (green) and wash away the control-T cells (red) with no vimentin-binding ligand. Strikingly, automated fluorescence microscope scanning found that most if not all of the vimentin-bound cells were attIL12-T cells (figure 1F).
Having confirmed that attIL12-T cells target CSV+ tumor cells, the immediate question raised was whether this engagement triggers attIL12-T cell cytotoxicity against tumor cells. To address this question, we used the human metastatic osteosarcoma cell line OSD, in which more than 30% of cells express CSV (online supplementa figure S1). attIL12-T cells showed notable increases in perforin production after coculture with OSD cells, and these increases were significantly reduced by blockade of CSV (online supplementa figure S1, figure 1G). In contrast, control-T cells showed very little change. These results confirmed that attIL12-T cells not only bind CSV, but also become activated against CSV+ tumor cells.
Supplemental material
attIL12-T cell transfer enhanced T-cell infiltration and IFNγ production in CSV+ osteosarcoma PDX tumors
Poor tumor infiltration is a major obstacle in T-cell therapy for solid tumors. Thus, to test the effectiveness of attIL12-T cell infusions against solid tumors, mice-bearing OS1 osteosarcoma PDXs were preconditioned with cyclophosphamide and then administered 2 infusions of control-T or attIL12-T cells 14 days apart. Four days after the second infusion, immunofluorescence staining of tumor sections showed that attIL12-T cells had accumulated in tumors, whereas very few control-T cells were able to infiltrate tumors (figure 2A). Another barrier to T-cell therapy is the loss of effector T-cell functions in the tumor microenvironment. We therefore sorted the tumor-infiltrating T cells for CyTOF analysis. The PhenoGraph clustering method revealed 9 distinct clusters. Tumors from attIL12-T cell-treated mice showed dramatically higher frequencies of IL12+IFNγ+CD8+ T cells, NKG2D+CD8+ T cells, and IL12+CD4+ T cells and fewer exhausted CD4+ and CD8+ T cells than did control-T cell-treated tumors (figure 2B,C). The frequencies of total CD4+ and CD8+ T cells showed no difference between the two groups (figure 2C). The production of IL-12 and IFNγ in tumors was validated using ELISA in tumor lysates. attIL12-T cell infusions resulted in significantly higher levels of IL-12 and IFNγ than did control-T infusions (figure 2D). These results suggested that attIL12-T cells not only penetrate osteosarcoma tumors but also are activated in them.
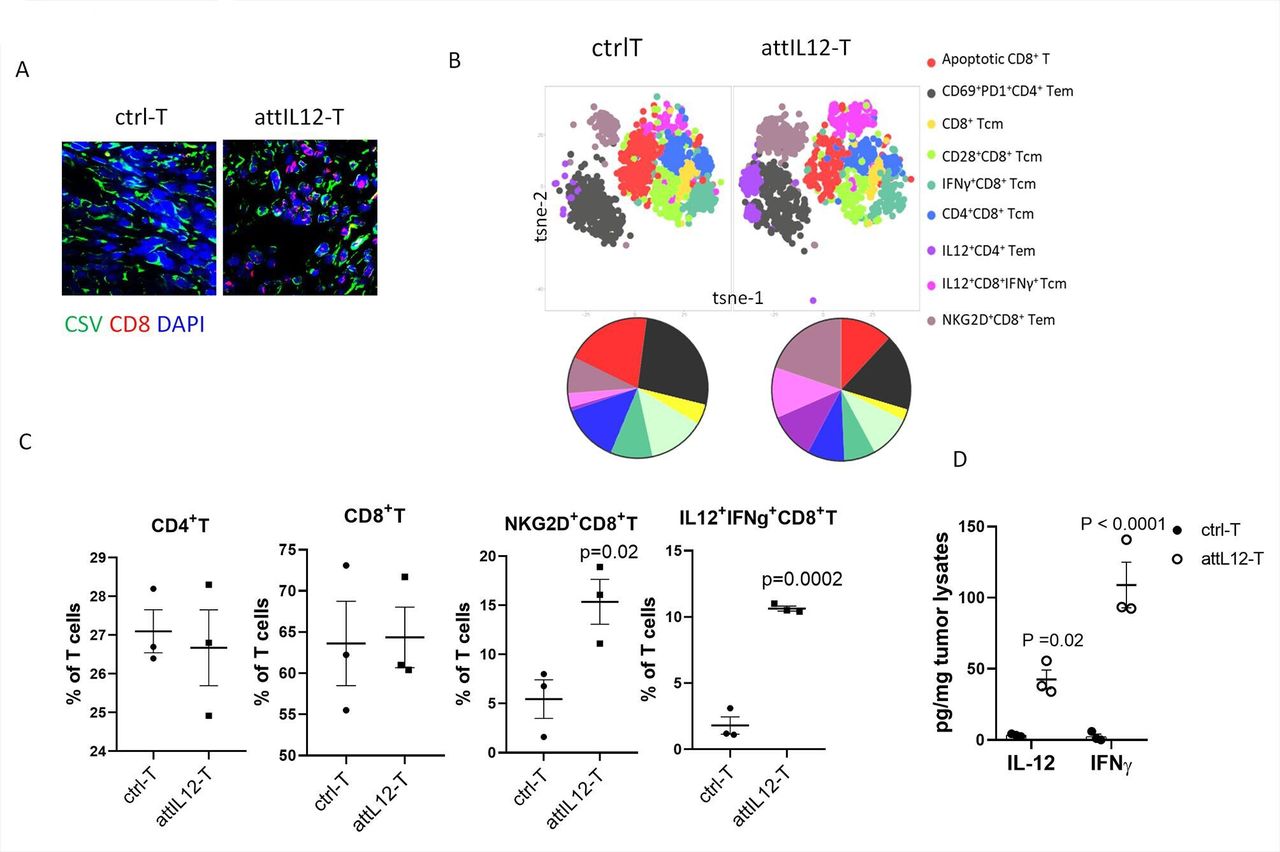
attIL12-T cell transfer enhanced T-cell infiltration and IFNγ production in CSV+ osteosarcoma PDX tumors. OS1 osteosarcoma PDX tumors were embedded subcutaneously in scid mice. Tumor-bearing mice were preconditioned with cyclophosphamide (60 mg/kg), followed by 2 T-cell transfer treatments 2 weeks apart. (A) Tumors were collected 4 days after the second T-cell transfer, and sections were stained with CSV and human CD8 antibodies for immunofluorescence analysis. (B) Tumor-dissociated cells from day four after the second T-cell transfer were stained with an anti-human CD45 antibody and sorted for tumor-infiltrating lymphocytes. Color-coded clusters of tumor-infiltrating immune cells generated by t-distributed stochastic neighbor embedding. Pie graphs show the proportions of the indicated tumor-infiltrating immune-cell clusters (n=3). (C) Graphs show the frequencies (±SEM) of total CD4+, CD8+, NGK2D+CD8+ and IL-12+IFNγ+CD8+ T cells from the tumor-infiltrating lymphocytes described in (B). (D) IL-12 and IFNγ levels in the tumor lysates were determined via ELISA (pg/mg tumor lysate±SEM). attIL12, anchored and tumor-targeted IL-12; CSV, cell-surface vimentin; IFNγ, interferon γ; IL-12, interleukin-12; PDX, patient-derived xenograft.
attIL12-T cell infusion inhibits human solid-tumor PDX progression
Encouraged by the finding that attIL12-T cell infusions substantially improved T-cell infiltration and boosted IFNγ production in tumors, we next explored the potential antitumor efficacy of attIL12-T cells against solid tumors. Because PDX tumor models more faithfully recapitulate the original patient’s histologic and genetic profile than do human tumor cell line–derived models, we tested four osteosarcoma PDX models (OS1, OS02, OS09, and OS60). Mice were preconditioned with cyclophosphamide and then treated with multiple T-cell infusions. Mouse subcutaneous tumors usually start to receive treatment when they are palpable, which is approximately 5 mm in diameter, but we tried to challenge bigger tumors. For OS1 PDXs, treatment was initiated when tumors reached 6 mm in diameter. Compared with the rapid tumor growth in the no-treatment and control-T cell treatment groups, attIL12-T cell transfer completely eradicated tumors in three of five mice (online supplementa figure S2); the other two mice had only very small tumors that became stable (online supplementa figure S2, figure 3A). For OS02, OS09, and OS60 models, we intentionally waited until tumors grew to 7 to 9 mm to start the treatment. Tumor development was partially inhibited by aIL12-T treatment (figure 3B,D), but remarkably delayed and stabilized by attIL12-T cell transfer (figure 3B–D), suggesting that the tumor targeted peptide in attIL12 is crucial for persistent tumor inhibition. However, bigger tumors (>8 mm) of OS09 and OS60 models continued to slowly progress after the treatment, revealing that attIL-12 cell infusion alone failed to eliminate very large osteosarcoma PDX tumors due to tumor antigen heterogeneity.

attIL12 modifications significantly improved T cells’ and CAR-T cells’ antitumor efficacy against human PDX tumors without adverse effects. (A–D) Osteosarcoma PDX OS1 (A), OS02 (B), OS09 (C), and OS60 (D) tumors were embedded subcutaneously in scid mice (n=3–4). Tumor-bearing mice were preconditioned at the points indicated by the black arrows, followed by T-cell transfer (red arrows). tumors were measured twice per week. The results represent two repeated experiments. (E–I) Osteosarcoma PDX OS09 tumor-bearing mice (n=3) were preconditioned (black arrow) and infused with T cells (red arrows). (E) Flow cytometry to determine B7H3 expression on OS09 tumor cells. (F) Tumor growth curve. (G–I) Tumors were dissociated and detected tumor infiltrating human T cells, NKG2D+CD8+ T cells and IL12+IFN+ T cells via flow cytometry. The graphs showed the frequencies or cell numbers (±SEM) of each population. attIL12, anchored and tumor-targeted; IFN, interferon; IL-12; CAR, chimeric antigen receptor; PDX, patient-derived xenograft.
Given that B7H3 is broadly expressed on pediatric tumors including osteosarcoma (figure 3E),29 and B7H3 CAR-T cell infusions effectively inhibit the growth of small tumors and leukemia30, T cells were engineered with B7H3 CAR (online supplementa figure S3A) and control vector or attIL12 (online supplementa figure S3B) to treat large OS09 tumors. Surprisingly, B7H3 CAR-T cells alone failed to eliminate large osteosarcoma tumors (figure 3F), but attIL12-armored B7H3 CAR-T cells inhibited the progression of large OS09 tumors after the first administration, and the tumors continued to regress after the second treatment (figure 3F). Flow cytometry showed that very few control B7H3 CAR-T cells were present in large tumors (figure 3G), even though OS09 tumor cells highly express B7H3 (figure 3E), which might be the cause of the poor antitumor efficacy. By contrast, attIL12-B7H3 CAR-T cells not only accumulated in the tumors and also produced high levels of NKG2D and IFNγ (figure 3H,I). These results showed that attIL12 can synergize with CAR-T cells to enhance tumor targeting, penetration, and T-cell activation in refractory large solid tumors.
attIL12 OT-1-T cell transfer reshapes tumor immunity to reject B16F10OVA tumor cells
The success of attIL12-T cell infusions in treating osteosarcoma tumors raised two questions: (1) is this treatment only effective against osteosarcoma tumors? and(2) can this treatment inhibit CSV low-expressing tumors? Our published data showed that ttIL12 delivery greatly enhanced the ratio of effector immune cells to suppressive immune subsets (regulatory T cells (Tregs), myeloid-derived suppressor cells (MDSCs), and M2 macrophages) in the tumor microenvironment which does not apply in human tumor models.21 We, therefore, sought to determine whether attIL12-T cell infusions could improve antitumor immunity in a CSV low and refractory syngeneic mouse melanoma model, B16F10OVA (B16F10 cells expressing chicken ovalbumin). OVA-specific T cells were used to represent as T cell receptor-T (TCR-T) cells. T cells were isolated from OT-1 mouse spleens and engineered with mouse attIL12. IL-12 expression on OT-1 T-cell membranes was assessed 5 days after transduction with control, wtIL12, or attIL12 lentivirus (figure 4A). As with human attIL12-T cells (figure 1E), both attIL12-transduced and wtIL12-transduced OT-1 T cells produced comparable levels of IL-12 and IFNγ in cell lysates, whereas only wtIL12-OT-1 T cells, not attIL12-OT-1 T cells, released high levels of cytokines in the culture medium (figure 4B).

attIL12-modified OT-1 T-cell transfer improved antitumor efficacy against B16F10OVA tumors. (A) IL-12 expression after control, attIL12, and wtIL12 lentiviral transduction on OT-1 mouse T cells isolated from mouse splenocytes, as assessed by flow cytometry. (B) IL12 and IFNγ levels in control, attIL12, and wtIL12 T-cell lysates and culture medium were determined by ELISA. Bar graphs show the median (±SEM) concentrations (n=3). (C) Experimental design of the B16F10OVA tumor model. CD45.1 C57BL/6 mice (n=5–6) were subcutaneously inoculated with 5×10⁵ B16F10OVA cells, and 5×10⁶ T cells (Ctrl-T, wtIL12-T, or attIL12-T) were transferred on days 3 and 10 after tumor inoculation. (D) B16F10OVA tumor growth and survival curves. Tumor size was measured twice weekly. Survival curves were generated by the Kaplan-Meier method. (E–K) IFNγ+CD8+ T cells (E), CD28+CD8+ T cells (F), PD-1+CD8+ T cells (G), Lag3+CD8+ T cells (H), CTLA-4+CD8+ T cells (I), CD39+CD8+ T cells (J), and NKG2D+CD8+ T cells (K) were detected among tumor-infiltrating lymphocytes 3 days after the second T-cell transfer. Dot plots show the frequencies (±SEM) of each cell population in each treatment group (n= 3). The results represent three repeated experiments. NS, not significant; *p<0.05; **p<0.01; ****p<0.0001. attIL12, anchored and tumor-targeted IL-12; CTLA4 CD152; IFNγ, interferon γ; IL-12, interleukin-12; i.v., intravenous; wtIL12, wild-type IL12. PD-1, programmed cell death protein 1.
Control, wtIL12-transduced, or attIL12-transduced T or OT-1 T cells on a CD45.2 background were transferred to preconditioned B16F10OVA tumor-bearing mice with a CD45.1 background on days 3 and 10 after tumor inoculation (figure 4C). Compared with the untreated mice, attIL12-T cell treatment suppressed tumor growth temporarily but not sufficient to eradicate rapidly progressing tumors (online supplementa figure S4A), and control-OT1 T cells alone also failed to induce any antitumor effect (figure 4D). By striking contrast, attIL12OT1-T cell treatment showed significantly better tumor inhibition and survival time than controlOT1-T or wtIL12OT1-T cell treatment (figure 4D), showing the synergistic antitumor efficacy of attIL12 signal plus TCR activation against CSV-low tumors. Both wtIL12 and attIL12-OT-1 T-cell infusions enhanced T-cell infiltration into tumors compared with control T-cell transfer, but attIL12-OT-1 T cells showed much better expansion potential (online supplementa figure S4B) and produced significantly higher levels of IFNγ in tumors (figure 4E). Similar to wtIL12TOT-1 T cells, tumor-infiltrating attIL12OT-1 T cells dramatically suppressed PD1 and Lag3 expression (figure 4G,H), and superior to wtIL12-OT1-T cells, attIL12-OT1-T cells also exhibited upregulation of the co-stimulatory receptor CD28 (figure 4F) and reduction of the inhibitory receptors CTLA-4 and CD39(figure 4I,J), indicating enhanced T-cell activation after attIL12-T cell infusions, as observed in human tumor models. Interestingly, NKG2D expression was high, but there was no significant difference in NKG2D expression on infused CD8+ T cells among control-treated, wtIL12-treated, or attIL12-OT-1 treated mice. However, the number of endogenous NKG2D+CD8+ T cells was increased more by attIL12-OT-1 treatment than by wtIL12-OT-1 treatment (figure 4K). This observation led us to decipher the changes in endogenous antitumor immunity after attIL12-OT-1 treatment.
To understand how attIL12-OT-1 T-cell transfer affects antitumor immunity, we isolated CD45+ immune cells from the B16F10OVA tumors shown in figure 5A for CyTOF analysis, which characterized them into 13 distinct clusters (figure 5A,B). attIL12-OT-1 treatment dramatically increased the proportions of CD8+ T cells and DCs and reduced that of MDSCs (figure 5A). These changes were validated via flow cytometry, which showed that CD103+ DCs were greatly boosted in both tumors (figure 5B) and tumor-draining lymph nodes (online supplementa figure S5A). Moreover, attIL12-OT-1 T-cell transfer promoted the maturation of these more abundant DCs, as measured by the induction of CD40, CD80, and CD86 (online supplementa figures S5B-D and S6A-C). Given that tumor-associated DCs take up tumor antigens, migrate into lymph nodes, and prime endogenous naïve T cells,31 we tested the antigen presentation of tumor-associated DCs by coculturing them with CFSE-labeled naïve CD8+ OT-1 T cells. attIL12-OT-1-treated DCs primed naïve CD8+ OT-1 T cells to exhibit high proliferative ability (figure 5C, online supplementa figure S6D) and strong early activation (CD69+CD44+) (figure 5D). Potent production of the immune-activation cytokines IFNγ, Flt3L, and GM-CSF was detected in tumors treated with attIL12-OT-1 T cells compared with other treatments (figure 5E–G). As a result, the tumor-infiltrating endogenous T cells gained immune-stimulatory features (figure 4K). Consistent with the CyTOF results, attIL12-OT-1 T-cell treatment suppressed inhibitory immune populations, including M2 macrophages, MDSCs, and Tregs (online supplementa figure S7), implying that this treatment can reshape the tumor immune environment to enable effective antitumor immune-cell therapy.

attIL12-OT-1 cell treatment reshapes tumor immunity by activating dendritic cell function. (A, B) Mass cytometry analysis of tumor-infiltrating immune cells on day 13 after B16F10OVA cell inoculation. Tumor-dissociated cells were stained with an anti-mouse CD45 antibody and sorted for tumor-infiltrating lymphocytes. (A) Color-coded clusters of tumor-infiltrating immune cells generated by t-distributed stochastic neighbor embedding. Pie graphs show the proportions of tumor-infiltrating immune-cell clusters (n=3). (B) CD103+ DCs were detected from dissociated tumor cells using flow cytometry. The dot plot shows the frequency of CD103+ DCs as median (±SEM) in the treatment groups (n=3). (C) Naïve CD8+ OT-1 T cells were stained with CFSE and cocultured with pan-DCs isolated from tumors subjected to the treatments shown in figure 4B at a ratio of 1:5 for 72 hours. CFSE dilution was detected using flow cytometry. The dot plot shows the frequency of proliferating CD8+ T cells as median (±SEM) (n=3). (D) Naïve CD8+ OT-1 T cells were labeled with BMQC violet cell tracker and cocultured with DCs from (D) at a ratio of 1:5 for 24 hours. CD44 and CD69 expression on CD8+ OT-1 T cells was determined using flow cytometry. The dot plot shows the frequency of CD44+CD69+ cells as median (±SEM) (n=3). (E–G) IFNγ (E), Flt3L (F), and GM-CSF (G) levels in tumors were determined via ELISA of tumor lysates. The dot plots show the levels of the cytokines (pg/mg tumor lysates) as median (±SEM) (n=3). (H) Experimental design of treatment of B16F10OVA tumors with Ctrl-OT1 T cells, attIL12-OT1 T cells, or wtIL12-OT1 T cells and removed; mice were then rechallenged with B16F10 tumor cells. (I) Growth curves of B16F10OVA and rechallenged B16F10 tumors (n=3) monitored twice Weekly. The results represent two repeated experiments. **p<0.01; ****p<0.0001; NS, not significant. APC, antigen-presenting cell; attIL12, anchored and tumor-targeted IL-12; BMQC, a violet dye for cell tracking; a violet dye for cell tracking; CFSE, carboxyfluorescein succinimidyl ester; DC, dendritic cell; GM-CSF, granulocyte-macrophage colony-stimulating factor; IFNγ, interferon γ; MDSC, myeloid-derived suppressor cell; Notx, no treatment; Treg, regulatory T cell; wtIL12, wild-type IL12.

attIL12-T cell treatment is a safe application that avoids off-tumor distribution and systemic cytokine release. (A) T-cell distribution in hearts, livers, spleens, and kidneys from OS02 tumor-bearing mice were examined with anti-human CD3 immunohistochemistry staining. (B) T-cell distribution in lungs of OS02 or OS31 PDX tumor-bearing mice were determined by anti-human CD3 immunohistochemistry staining at 2 days (OS02) or 4 days (OS31) after the second T-cell transfer. Bar graphs show the median (±SEM) numbers of human T cells per high-power field (HPF) (n=3). Scale of the 40× images, 50 µm. (C) Cytokine production in serum from OS02 tumor-bearing mice was determined using ELISA. The bar graphs show the median (±SEM) concentrations of the indicated cytokines (pg/mL) (n=3). (D) Serum was collected on day 13 (figure 4C) for cytokine analysis using ELISA. Bar graph shows the median (±SEM) IFNγ, TNFα, GM-CSF, and IL-6 levels (pg/mL) (n=3). *P<0.05; **p<0.01; ***p<0.001; ****p<0.0001; NS, not significant. The results represent three repeated experiments. attIL12, anchored and tumor-targeted IL-12; GM-CSF, granulocyte-macrophage colony-stimulating factor; IFNγ, interferon gamma; IL-6, interleukin-6; TNFα, tumor necrosis factor alpha; wtIL-12, wild-type IL12.
If attIL12-OT-1 T-cell treatment were to show superior tumor inhibition in a wild-type B16F10 tumor model without OT-1 antigen (OVA) expression, it would suggest that attIL12-OT-1 T cells program mature DCs that prime endogenous T cells to reject untargeted tumor antigens. To test this hypothesis, we repeated the animal study shown in figure 4D and surgically removed the primary tumors from all groups on day 17, followed by tumor rechallenge with 5×10⁵ B16F10 tumor cells (OVA negative parental cells) on the contralateral flank on day 30 (figure 5H). If attIL12-OT-1 T-cell transfer failed to induce antigen spreading, there should be no protection against OVA-negative B16F10 cells. In fact, B16F10 cells were rejected by the mice that had received attIL12-OT-1 T cells, in contrast to the aggressive tumor growth in mice treated with control- or wtIL12-OT-1 cells (figure 5I). These results clearly showed that secondary T-cell responses against untargeted B16F10 tumor epitopes were induced by infusing antigen-specific attIL-12 OT-1 T cells.
attIL12-T cell treatment is a safe application that avoids off-tumor distribution and systemic cytokine release
As reported by others, T cells armored with the wtIL12 gene elicited constitutive IL-12 production and associated robust secretion of toxic cytokines in cell culture supernatant in vitro and peripheral fluid in vivo.32 Also, CAR-T cells engineered with soluble IL-12 showed improved antitumor efficacy, but unfortunately induced severe clinical toxicities in human trials.33 We validated the safe application of attIL12-T cell therapy in a syngeneic tumor model in immune-competent mice, whose intact immune systems make them ideal for investigations of immune-therapy toxicity. Tissues from normal organs of T-cell–treated mice were assessed by a board-certified veterinary pathologist following staining with hematoxylin and eosin. In comparison with those in untreated mice, pathologic changes in the livers of mice treated with control-OT-1 T cells and attIL12-OT-1 T cells were relatively mild, and no significant histologic differences were observed between groups in the other tissues (online supplementa figure S8A). By contrast, mice treated with wtIL12-OT-1 T cells showed moderate hepatitis (online supplementa figure S8A). Standard toxicity-associated blood chemistry was also measured in mouse serum to assess liver toxicity and kidney function. Significant elevations in alanine aminotransferase and aspartate aminotransferase levels were detected on day 6 after wtIL12-OT-1 T-cell treatment, and a high blood urea nitrogen level was also observed, in contrast to the normal ranges of these enzymes measured in mice treated with attIL12-OT-1 T cells (online supplementa figure S8B). The serum samples from untreated mice were used as controls.
Two mechanisms could explain how attIL12-T cell transfer prevents IL-12-associated toxicities. The first mechanism is the minimal off-tumor distribution of attIL12-T cells. To study T-cell distribution in normal tissues, we stained sections of hearts, livers, spleens, and kidneys from osteosarcoma PDX-bearing mice 4 days after T-cell transfer and found no human T-cell accumulation in these organs (figure 6A). However, consistent with another report,4 high densities of control-T cells, wtIL12-T cells, and aIL12-T cells were detected in the lungs of OS02 and OS31 PDX-bearing mice at 2 days and 4 days after T-cell transfer, respectively, whereas attIL12-T cells showed significantly less lung infiltration (figure 6B), which we attribute to the tumor-exclusive expression of CSV.
The second mechanism is the minimal systemic inflammatory cytokine release after anchoring IL-12 to the T-cell membrane. In contrast to the robust IFNγ production in tumors, on attIL12-T and aIL12-T cell transfer, only basal levels of inflammatory cytokines (IL-12, IFNγ, tumor necrosis factor alpha [TNFα], GM-CSF, and IL-6) were released in serum from mice carrying PDX (figure 6C) or syngeneic tumors (figure 6D). However, wtIL12 T-cell treatment released cytokines mainly in the serum (figure 6C,D). These results revealed that attIL12 efficiently directs T cells specifically to tumors and restricts cytokine release in the serum, resulting in compartment-dependent cytokine production only in tumors, thereby diminishing the risk of systemic cytokine storm.
Discussion
We generated a second-generation ttIL12, attIL12, which anchors on the T-cell membrane. Like the first generation of ttIL12, attIL12 also targets CSV+ tumor cells and reverses immune suppression (figures 1F and 5A, online supplementa figure S7).21 A great improvement from the first generation of ttIL12, which could only eliminate residual solid tumors, attIL12-T cell transfer inhibits large-volume, heterogeneous tumors by initiating sequential tumor-eliminating mechanisms, including tumor-specific T-cell accumulation and expansion, tumor-restricted T-cell-activating cytokine release, DC maturation, and secondary T-cell responses. Moreover, the tumor compartment–specific cytokine release induced by attIL12-T cell therapy prevents toxicities to normal tissues.
The most interesting observation is that the attIL12-T cell modification—without directly inserting the first or second signals—induces large solid tumor regression. The reason is that the attIL12 modification of T cells alone is sufficient for triggering multiple T-cell activation signals. We demonstrated that attIL12T cell therapy can eliminate CSV-high-expressing PDX solid tumors (figure 3A,B). Others found that in addition to IL-12’s crucial role in invigorating effector T cells, IL-12 supplementation by T cells also augments antigen presentation,34 triggers innate immunity,35 and reprograms dysfunctional MDSCs36 in the suppressive tumor immune environment.
To overcome bigger solid tumors or CSV-low–expressing refractory solid tumors, inclusion of all 3 T-cell activation signals is critical. Why systemic transfer of attIL12-armed CAR-T or OT1-T cells inhibit large and heterogeneous solid tumors, whereas current T-cell therapies for solid tumors are only effective when delivered intratumorally? One possible explanation is the requirement of multiple T-cell signals for boosting antitumor response. For example, TCR activation37 38 in first-generation CAR-T cells is less effective than in second-generation CAR-T cells, which have both signal 1 and costimulatory receptor (signal 2) activation.39–41 However, even with both signals, these therapies have failed to yield promising results in solid-tumor clinical trials. In our osteosarcoma PDX model OS09 which exhibits high level of B7H3 expression, but B7H3CAR-T cell treatment failed to inhibit tumor growth (figure 3F). To eliminate heterogeneous solid tumors, a third T-cell activation signal, such as T-cell activation by cytokines, may be required.42 43 One of the most potent T cell-stimulating cytokines is IL-12, which induces robust activation of natural killer-mediated and T cell-mediated inflammatory responses.44 45 One report demonstrated that CD19 CAR-T cells engineered with secreted IL-12 showed promise in treating B-cell lymphoma.46 Other studies confirmed the enhanced efficacy of wtIL12-armored CAR-T cells against ovarian cancer cells.32 47 48 These successes are tempered, however, by the severe toxicity of IL-12-based T-cell therapies, which has eliminated hope of clinical approval. Our attIL12-T cell therapy has addressed this issue and may restore this hope. When we combined signal 1, 2 and attIL12 together, attIL12-B7H3CART treatment significantly induced OS09 tumor regression compared with attIL12T or B7H3CART cells alone (figure 3F). For CSV-low-expressing tumors B16F10OVA, attIL12 armed-OT1 cells eliminated tumors via (1) attIL12-CSV targeting and interaction mediated T cell activation, (2) TCR activation by the OT1-OVA interaction, and (3) attIL12 stimulation which in turn activated DCs and triggered antigen spreading (figures 4 and 5, online supplementa figure S4A).
This attIL12-T cell therapy, however, is totally different from the wtIL12-T cell therapy or classical CAR-T and TCR-T cells because it introduces a modified IL-12, attIL12. In brief, the attIL12-T cells recognize CSV+ tumor cells to promote T-cell infiltration and IFNγ production in tumors (figures 2 and 4E). Subsequently, the inflammatory cytokines invigorate DC maturation and antigen presentation to stimulate secondary T-cell responses against untargeted tumor antigens (figure 5). These surprizing results suggest that a different pool of T-cell activation signals linked to the attIL12-CSV axis should be further investigated in the future, as they may boost antitumor immunity against large-volume heterogeneous solid tumors. Our discoveries also show that attIL12-T cell therapy is not a CAR, but instead, serves as a T-cell vaccine. In this regard, the copresence of T cells and ttIL12 in the same tumor micro-niche may be critical to generating the superior antitumor efficacy against large solid tumors.
Cases of lethal toxicity have been frequently reported in CAR-T cell and IL-12 clinical trials and are mainly attributed to cytokine release syndrome (CRS), neurotoxicity, and/or on-target-off-tumor and off-target toxicities.49–51 An inappropriate antigen target that is also expressed on normal tissues may cause severe off-tumor toxicity and even death.52 53 We discovered that CSV is a universal marker exclusively expressed on tumor cells, such as sarcoma, breast cancer, and colon cancer cells.19 23 However, it is not the CSV targeting, but rather the anchoring of IL-12 on the T-cell membrane that is the true reason for CRS elimination; aIL12-T cells without the CSV-targeted peptide VNTANST also diminished IL-12 and IFNγ release in cell culture medium in vitro and serum in vivo. The underlying mechanism will be the focus of our future efforts.
Besides the cytokine release reduction, the attIL12-T cell approach provides another layer of safety by selectively migrating to and binding CSV+ tumor cells. In contrast to the soluble wtIL12 used by others, which freely interacts with IL-12 receptors in off-target tissues to stimulate inflammatory cytokines systemically, our attIL-12-T cell transfer constrained the production of IL-12-induced cytokines in tumors (figures 2D, 6C,D). This compartment-dependent cytokine secretion mechanism results in minimal levels of IFNγ, TNFα, GM-CSF, and IL-6 in the serum without causing a steady decline of body weight, suggesting a low risk of CRS and neurotoxicity. A recent study stated that the transmembrane hinge of CAR-T cells is crucial for reducing CRS and neurotoxicity.54 Our results demonstrated that besides this structural change, which would require a new construct, expression of membrane-attached IL-12 on T cells also effectively alleviated inflammatory cytokine levels in serum and therefore mitigated the risk of CRS and neurotoxicity.
In summary, attIL12-T cells may serve as an effective therapy for treating solid tumors, and we are preparing to move this treatment into a clinical trial. This approach could be used to boost the antitumor efficacy and reduce the toxicity of current T-cell therapies and sheds light on the safe application of IL-12-based T-cell therapy for large solid tumors (table 1).
Antibody list
Data availability statement
No data are available.
Ethics statements
Patient consent for publication
Ethics approval
The mouse care and handling procedures were approved by the Institutional Animal Care and Use Committee of The University of Texas MD Anderson Cancer Center. The use of human buffy coat was approved by the MD Anderson Institutional Review Board.
Acknowledgments
The authors would like to thank Dr. Amy Ninetto, Scientific Editor, Research Medical Library, MD Anderson Cancer Center, for editing the manuscript.
References
Supplementary materials
Supplementary Data
This web only file has been produced by the BMJ Publishing Group from an electronic file supplied by the author(s) and has not been edited for content.
Footnotes
Contributors JH designed and conducted the experiments, acquired and analyzed data, wrote and edited the manuscript; QY, WZ and ZZ conducted animal experiments; HD and YC provided CAR-T cells; QZ conducted T cell expansion; LD conducted experiments and acquired data; XX established and prepared the constructs; FNW evaluated the pathology changes; KM and RG reviewed and revised the manuscript; SK provided tumor models; GD provided materials; SL designed and supervised the studies, reviewed and revised the manuscript. SL is responsible for the overall content as guarantor
Funding This study was supported by the National Institutes of Health through grant R01 CA200574 and Cancer Center Support Grant P30 CA016672. The following Cancer Center Support Grant core resources were used: Genetically Engineered Mouse Facility and Monoclonal Antibody Core Facility.
Competing interests None declared.
Provenance and peer review Not commissioned; externally peer reviewed.
Supplemental material This content has been supplied by the author(s). It has not been vetted by BMJ Publishing Group Limited (BMJ) and may not have been peer-reviewed. Any opinions or recommendations discussed are solely those of the author(s) and are not endorsed by BMJ. BMJ disclaims all liability and responsibility arising from any reliance placed on the content. Where the content includes any translated material, BMJ does not warrant the accuracy and reliability of the translations (including but not limited to local regulations, clinical guidelines, terminology, drug names and drug dosages), and is not responsible for any error and/or omissions arising from translation and adaptation or otherwise.