
Abstract
Intracellular cytokine staining (ICS) is a popular method for visualizing cellular responses, most often T-cell responses to antigenic or mitogenic stimulation. It can be coupled with staining for other functional markers, such as upregulation of CD107 or CD154, as well as phenotypic markers that define specific cellular subsets, e.g. effector and memory T-cell compartments. Recent advances in multicolor flow cytometry instrumentation and software have allowed the routine combination of 8–12 (or more) markers in combination, creating technical and analytical challenges along the way, and exposing a need for standardization in the field. Here, we will review best practices for antibody panel design and procedural variables for multicolor ICS, and present an optimized protocol with variations designed for use with specific markers and sample types.
1 Introduction
With the use of secretion inhibitors such as monensin or brefeldin A, secreted cytokines and other proteins can be retained intracellularly. These proteins thus become available for antibody staining, upon fixation and permeabilization of the cells (1, 2). In general, short-term stimulation of cells with mitogen or antigen is required to induce cellular activation and production of cytokines. One common application of this technique is the visualization of antigen-specific T cells in PBMC (3) or whole blood (4). This requires stimulation with protein antigens or, commonly, pools of overlapping peptides spanning a protein sequence of interest (5). The latter, when designed with sufficient length and overlap between peptides, can efficiently stimulate both CD4 and CD8 T-cell responses.
A common protocol for antigen-specific stimulation of T cells for intracellular cytokine staining (ICS) is as follows. Whole blood or PBMC are incubated with antigen or peptide mixtures for 6–16 h. Brefeldin A and/or monensin is added at the time of stimulation (for peptides) or after 2 h (for proteins, to allow for intracellular antigen processing, which is compromised by the secretion inhibitor). At the end of the stimulation period, cells can be held at 4–18°C until ready to process. They are then treated with EDTA to remove adherent cells, fixed (usually with formaldehyde), permeabilized (usually with a detergent), and stained for intracellular determinants. In some cases, surface marker staining is done in conjunction with intracellular staining (this usually works well for CD3, CD4, and CD8). However, most other cell-surface markers require staining prior to fixation, because the epitopes recognized by staining antibodies are sensitive to fixation and/or permeabilization.
Intracellular staining for multiple cytokines is now often combined with staining for other functional and phenotypic markers as well. This has been made possible by the availability of flow cytometers with digital signal processing, and detectors for up to 18 colors. Along with this instrumentation, software for automated calculation of compensation between colors is now routinely used, often in combination with single-stained capture beads that make construction of compensation controls easier and more precise (since the actual experimental antibodies can be used for compensation, an important consideration for some tandem dye conjugates). Finally, software and fluorescent beads to automate instrument setup and track performance over time are now available, making longitudinal standardization of experiments, at least for a single instrument, much easier. Standardization across instruments, especially given the degree of instrument customization seen in the field, can still be difficult, however.
Despite the advances in tools for multicolor flow cytometry, designing optimal antibody panels of 8 or more colors can be a challenge. The optical spectrum is limited, such that addition of new fluorescent reagents tends to create more spillover into existing detectors. In some cases, this can severely compromise the ability to use those detectors for measurements requiring high-resolution sensitivity.
A general discussion of rules for antibody panel design, along with suggestions for specific fluorochrome combinations and panels, is given in (6, 7). These rules are very briefly summarized here.
-
1.
Use the dimmest fluorochromes for brightly staining antibodies (CD45, CD4, CD8, CD3, etc.), while reserving the brightest fluorochromes for dimly staining antibodies (see Table 1).
Table 1 Fluorochrome brightness -
2.
Avoid spillover from a bright cell population into a detector requiring high-resolution sensitivity (see Fig. 1). In some cases, two fluorochromes with high spillover between them can be used for markers that identify distinct, non-overlapping cell populations, thereby negating spillover concerns.
Fig. 1. 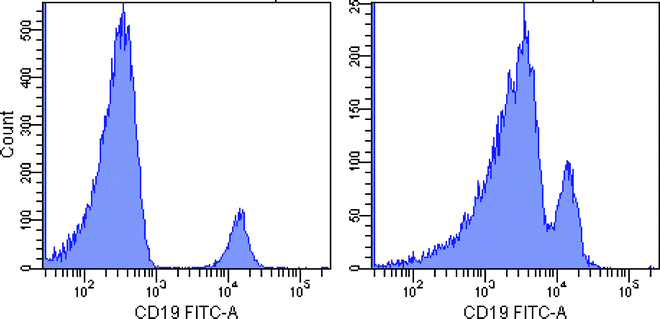
Effect of a bright signal in AmCyan on resolution sensitivity in FITC. Left panel: staining with CD19 FITC alone. Right panel: combined staining of CD45 AmCyan and CD19 FITC. Note the spread of the CD19-negative peak, causing loss of resolution sensitivity. This is only a problem when both markers are present on the same cell population (e.g. use of CD3 AmCyan and CD19 FITC would not pose a problem). Similar issues arise whenever there is significant spillover from a bright population in one detector to another detector where high-resolution sensitivity is required.
-
3.
Avoid potential artifacts of tandem dye degradation, either by avoiding tandem dyes that are particularly susceptible to breakdown (APC-Cy7 and PE-Cy7), or by choosing reagent combinations such that small amounts of tandem breakdown will not compromise readouts in the parent dye channels (APC or PE). See Maecker et al. (7) for further discussion and examples of this issue.

There are also practical considerations to panel design, such as what antibody conjugates are commercially available. In general, it is best to use direct fluorochrome conjugates for multicolor work and for intracellular staining, since nonspecific binding can be a significant concern in these situations.
Even direct antibody conjugates can be optimized by titration for a particular application. Optimal titers should be picked on the basis of maximal signal:noise, which is often obtained below the titer recommended by the manufacturer.
While panels will constantly be refined to include new markers of interest, a degree of standardization is helpful, to avoid extensive re-optimization of new panels and provide for some degree of longitudinal comparisons. In Table 2, we provide some suggested panels currently in use in our laboratory.
Finally, optimal detection of certain marker combinations requires modification of stimulation and processing steps (e.g. CD107 or CD154). These variables are summarized in Table 3.
2 Materials
2.1 Reagents
-
1.
Test specimens: heparinized whole blood, freshly isolated PBMC, or cryopreserved PBMC, isolated by Ficoll gradient centrifugation or via cell preparation tubes (CPT) (BD Vacutainer; BD Diagnostics, Franklin Lakes, NJ, or equivalent).
-
2.
RPMI-1640 medium with 20 mM HEPES, 10% fetal bovine serum, and antibiotic/antimycotic solution (cRPMI-10; components from Sigma Chemical Co., St. Louis, MO, or equivalent supplier).
-
3.
Stimulation antigens, e.g. peptide mixes (5). To prepare aliquots of lyophilized peptides, resuspend peptides or peptide mixes in DMSO at a concentration of 500 μg/mL/peptide or greater. Store resuspended peptides in aliquots at −80°C. Optional: Preconfigured plates containing lyophilized stimulation reagents, costimulatory antibodies, and secretion inhibitor(s) can be purchased (BD Lyoplate; BD Biosciences, San Jose, CA) (8).
-
4.
Staphylococcal enterotoxin B (SEB), 50 μg/mL in sterile PBS, to use as a positive control for stimulation.
-
5.
Recommended: costimulatory antibodies to CD28 and CD49d, 0.1 mg/mL each in sterile PBS (BD FastImmune; BD Biosciences).
-
6.
Brefeldin A, 5 mg/mL in DMSO; or brefeldin A plus monensin, 2.5 mg/mL each in 50% DMSO plus 50% methanol (Sigma).
-
7.
20 mM EDTA in PBS, pH 7.4 (BD FastImmune or equivalent).
-
8.
Erythrocyte lysis and cell fixation reagent, e.g. BD FACS lysing solution (BD Biosciences) or equivalent.
-
9.
Cell permeabilizing reagent, e.g. BD FACS permeabilizing solution 2 (BD Biosciences) or equivalent.
-
10.
Fluorescent-labeled antibodies (see for example Table 2). Optional: Preconfigured plates containing lyophilized antibody cocktails (BD Lyoplate) (8).
-
11.
Wash buffer: 0.5% bovine serum albumin plus 0.1% NaN3 in PBS.
-
12.
Recommended: BD CompBeads (anti-mouse Igκ, anti-rat Igκ, or anti-rat/hamster Igκ; BD Biosciences), for creating single-color compensation controls.
-
13.
(Optional) To reduce biohazard potential, or if samples will be stored for >24 h prior to acquisition: 1% paraformaldehyde in PBS [dilute 10% paraformaldehyde (EM Science, Gibbstown, NJ) 1:10 in PBS], or BD Stabilizing Fixative (BD Biosciences).
2.2 Equipment
-
1.
For whole blood assays, 96-well conical bottom deep-well polypropylene plates and lids. For fresh or frozen PBMC, 96-well conical bottom polypropylene plates with lids (e.g. BD Falcon, BD Biosciences, or equivalent) (see Note 1).
-
2.
12-channel aspiration manifold with 35 mm prongs for deep-well plates and 7 mm prongs for regular plates (V&P Scientific, San Diego, CA).
-
3.
Plate holders for table-top centrifuge (e.g. Sorvall Instruments, Newtown, CT).
-
4.
Polychromatic flow cytometer with digital signal processing, e.g. BD LSR II equipped with Cytometer Setup and Tracking beads and software (BD Biosciences) or Dako Cyan ADP (Dako Corporation, Fort Collins, CO).
-
5.
Optional: 96-well plate loader for flow cytometer.
3 Methods
3.1 Sample Collection
-
1.
(a)For fresh PBMC (see Note 2): Resuspend at 5 × 10⁶ to 1 × 10⁷ viable cells/mL in warm (37°C) cRPMI-10 (see Note 3).
-
(b)
For cryopreserved PBMC: Thaw briefly in a 37°C water bath, then slowly dilute up to 10 mL with warm (37°C) cRPMI-10 and centrifuge for approximately 7 min at 250 × g. Resuspend in a small volume of warm cRPMI-10, perform a viable cell count, and dilute to a concentration of about 1.5 × 10⁷ viable cells/mL for resting overnight. Incubate at 37°C for 6–18 h prior to stimulation in a conical centrifuge tube, tilted (see Note 4). Resuspend and recount cells after the rest. Using this new count, prepare the final suspension at 5 × 10⁶ to 1 × 10⁷ viable cells/mL in warm (37°C) cRPMI-10.
-
(c)
For whole blood assays: Collect whole blood in sodium heparin and store at room temperature for not more than 8 h prior to use.
-
(b)
-
2.
Add 200 μL of cell suspension per well to an appropriate 96-well plate.
-
3.
For assays using preconfigured lyophilized stimulation reagents in plates: Add 200 μL of cell suspension directly to the appropriate wells in the stimulation lyoplate, allow the cells to stand for a few minutes, and then pipet up and down thoroughly to mix. Skip to Subheading 3.2, step 6.
3.2 Cell Activation
-
1.
Prepare the secretion block reagents.
-
(a)
For assays not involving CD107 or CD154: Thaw an aliquot of 5 mg/mL of brefeldin A stock (see Note 5). Dilute 1:10 in sterile PBS to make a 50× working stock.
-
(b)
For assays measuring CD107 and/or CD154: Thaw an aliquot of 2.5 mg/mL of brefeldin A plus 2.5 mg/mL of monensin stock (see Note 5). Dilute 1:10 in sterile PBS to make a 50× working stock.
-
(a)
-
2.
Thaw and dilute peptide stock aliquots (see Note 6) in sterile PBS, if necessary, to achieve a 50× working stock that is between 50 and 100 μg/mL/peptide (when diluted 1:50, this will yield a final concentration of 1–2 μg/mL/peptide).
-
3.
For each stimulation condition, prepare a “master mix” of the 50× working stocks and costimulatory antibodies as follows:
-
(a)
4 μL/well of peptides, SEB (positive control), or PBS (negative control).
-
(b)
4 μL/well of brefeldin A or brefeldin A plus monensin.
-
(c)
4 μL/well of CD28 plus CD49d Ab stock (see Note 7).
-
(d)
Always prepare a slight excess of each master mix.
-
(a)
-
4.
Pipet 12 μL of the appropriate master mix into each well containing cells. Mix by pipetting gently.
-
5.
For assays involving CD107 and/or CD154, also add the recommended titer of the antibody conjugate(s) to each well. Minimize exposure to light, particularly for tandem dye conjugates (see Note 8).
-
6.
Cover the plate and incubate for 6–12 h at 37°C (see Notes 9 and 10).
3.3 Sample Processing
-
1.
To halt activation and detach adherent cells, add 20 μL per well of 20 mM EDTA in PBS and mix by pipetting.
-
2.
Incubate for 15 min at room temperature, then mix again by vigorous pipetting to resuspend adhered cells fully.
-
3.
For PBMC, centrifuge plate at 250 × g for 5 min. Aspirate the supernatant with the appropriate vacuum manifold for the plate (see Note 11).
-
4.
For assays using amine-reactive dye for staining nonviable cells: Resuspend the amine dye at optimum concentration in PBS (usually around 2.5 μg/mL, but this should be determined for individual lots of dye). Resuspend each well with 100 μL of this solution, incubate for 20 min at room temperature, then add 100 μL of wash buffer, and wash as in step 3 above. Amine dyes can be used with whole blood, but higher concentrations will be required because the blood is not washed into PBS prior to dye staining. Therefore, the staining intensity may be reduced.
-
5.
For assays using liquid reagents and cell-surface markers other than CD3, CD4, and CD8: Resuspend each well in 100 μL of wash buffer (for PBMC) and add optimal titers of all Abs to cell-surface markers (see Note 12). Incubate for 30–60 min at room temperature, then add 100 μL of wash buffer (for PBMC), and wash as in step 3 above.
-
(a)
For assays using preconfigured lyophilized staining reagents and cell-surface staining Abs, resuspend the appropriate wells of the surface Ab plate with 50 μL of wash buffer. Let sit for a few minutes, then pipet up and down thoroughly to mix. Transfer the solution to appropriate wells of the cell plate, incubate for 30–60 min at room temperature in the dark, then add 100 μL of wash buffer, and wash as in step 3 above.
-
(a)
-
6.
For PBMC, resuspend cell pellets with 100 μL of 1× BD FACS lysing solution per well. For whole blood, add 2 mL of room temperature 1× BD FACS lysing solution per well, pipetting up and down to mix. Incubate both types of assay at room temperature for 10 min in FACS lysing solution (see Notes 13 and 14).
-
7.
For PBMC, add 100 μL of wash buffer to each well, then centrifuge the plate at 500 × g for 5 min (see Note 15). For whole blood, simply centrifuge the plate at 500 × g. Aspirate the supernatant for both with the appropriate vacuum manifold for the plate.
-
8.
For PBMC, resuspend cell pellets with 200 μL of 1× BD FACS permeabilizing solution 2 per well. For whole blood, resuspend cell pellets in 1 mL of 1× BD FACS permeabilizing solution 2 per well. Incubate both types of assay at room temperature for 10 min (see Note 14).
-
9.
Centrifuge the plate at 500 × g for 5 min (see Note 15). Aspirate the supernatant with appropriate vacuum manifold for the plate.
-
10.
For standard plates, add 200 μL of wash buffer to each well and wash as in step 9 above. For deep-well plates, add 1.5 mL of wash buffer to each well and wash as in step 9 above.
-
11.
For standard plates, add 200 μL of wash buffer to each well and wash a second time as in step 9 above.
-
12.
For assays using liquid reagents: Resuspend the pellet in 100 μL of wash buffer and add optimal titers of all Abs to intracellular markers and surface markers not already stained. Incubate in the dark at room temperature for 60 min, mixing by pipetting or gentle agitation every 15–20 min.
-
(a)
For assays using preconfigured lyophilized intracellular staining reagents, resuspend the appropriate wells of the intracellular antibody plate with 50 μL of wash buffer. Let sit for a few minutes, then pipette up and down thoroughly to mix. Transfer the solution to the appropriate wells of the cell plate and incubate at room temperature in the dark for 60 min, mixing by pipetting or gentle agitation every 15–20 min.
-
(a)
-
13.
Wash again as in steps 10 and 11 above.
-
14.
Resuspend pellets with 150 μL of wash buffer. Store at 4°C in the dark until ready for data acquisition, which should be performed within 24 h. Optional: resuspend pellets with 150 μL of 1% paraformaldehyde in PBS or BD Stabilizing Fixative (see Note 16).
3.4 Data Acquisition and Analysis
-
1.
First determine optimal PMT settings for the instrument and reagent panel in question. Using CS&T beads and software on a BD LSR-II, start with CS&T baseline voltages and then perform the following:
-
(a)
Run single-stained compensation controls (see Note 17) and decrease PMT voltage gain, if needed, to ensure that no events are in the highest fluorescence channel. Increase PMT voltage gain, if needed, to ensure that positive peaks are at least twofold brighter in their primary detector compared to other detectors.
-
(b)
Run a fully stained positive control sample and decrease PMT voltage gain, if needed, to ensure that no events are in the highest fluorescence channel. If changes are made, repeat steps (a) and (b) until no more changes are required. Save the resulting settings as an Application Setting in FACS Diva software (BD Biosciences).
-
(a)
-
2.
Acquire the single-stained compensation controls and use the software’s automated algorithm to calculate compensation (see Note 18).
-
3.
Create a template for acquisition that displays the relevant parameters in the test samples in the form of dot plots. This template need not be the same as that used for analysis, i.e., it does not need to specify all gates or regions of interest. In fact, a simplified acquisition template will allow faster processing of data. However, the template should show any gates used to define the saved population of cells or the stopping criteria (e.g. CD3+ cells).
-
4.
Set an appropriate threshold, usually on FSC or CD45+ events, to eliminate debris and unwanted events. Set the stopping and storage criteria to obtain sufficient events for analysis. It is usually safest to store all events (rather than a gated subset) to allow for re-gating and exploration of other subsets. However, sometimes a threshold or gate on CD3+ cells may be employed in order to reduce file sizes (see Note 19).
-
5.
Record data from samples.
-
6.
Analyze data using the acquisition software or compatible third-party software. Be sure to define all regions of interest and report the desired statistics on these (see Note 20 and Fig. 1). Where possible, use a batch analysis function to analyze all samples from a given experiment or study, and export the statistical data to a spreadsheet (see Note 21).
-
7.
For large studies, it is helpful to create a database to accept the statistical output files from batch analysis. This database can then be queried to create data tables from subsets of the data, allowing rapid graphing, statistical analysis, background subtraction, conversion to absolute counts, etc.
4 Notes
-
1.
Plates versus tubes: Cells can also be stimulated in 15-mL conical polypropylene tubes, with staining in 12 × 75 mm polystyrene tubes (BD Falcon). However, plates are preferred for ease of handling multiple samples, and results for human PBMC are equivalent to those in tubes (9).
-
2.
Fresh PBMC: If PBMC are not to be cryopreserved, they should ideally be prepared on the day of blood draw and then either stimulated the same day, or rested at 37°C in cRPMI-10 overnight and stimulated the following day. Overnight resting at 37°C increases the staining intensity of cytokines, but the effect is more pronounced with cryopreserved samples. Overnight shipping of whole blood or PBMC at ambient temperatures can cause a variable decrease in cell function and should be avoided if possible, although shipping PBMC is preferable to shipping whole blood.
-
3.
Higher cell concentrations (1 × 10⁷/mL, 2 × 10⁶/well) should be used when possible, especially when response levels are low and/or there are many cell subsets to enumerate.
-
4.
Cryopreserved PBMC: If cells cannot be stimulated within 24 h of blood draw, they should be cryopreserved by a validated protocol (10). Upon thawing, recoveries of >60% and viabilities of >80% should be obtained to minimize loss of functional responses. The method of thawing is equally as important as that of cryopreservation (10). Thawed cells should be rested in cRPMI-10 for 6–18 h at 37°C to maximize cytokine staining intensity (9). Some cell loss may occur during this period, so rest the cells at a higher concentration than you will ultimately use. Recount and resuspend at the desired final concentration after resting.
-
5.
Brefeldin A versus monensin: Secretion of most cytokines of interest (IFNγ, IL-2, etc.) is best inhibited by brefeldin A at 10 μg/mL cells. However, CD107 and CD154 are transiently expressed on the cell surface. Therefore, staining Abs to CD107 and/or CD154 is added to the stimulation culture to bind the antigen(s) as soon as they are expressed. Monensin increases the intensity of staining under these conditions by preventing the acidification and degradation of lysosomal vesicles that contain the recycled CD107 and CD154. Thus, for combined cytokine and CD107 or CD154 detection, 5 μg/mL each of brefeldin A and monensin is recommended.
-
6.
Peptide mixes: Peptide mixes can be prepared and lyophilized as premixed pools of up to several hundred peptides (5). These can then be resuspended in DMSO at high concentration per peptide, avoiding DMSO toxicity. The total concentration of DMSO in the assay should be kept at <0.5%.
-
7.
Costimulatory antibodies: Antibodies to CD28 and CD49d can increase the cytokine response to protein antigens, peptides, and SEB by amplifying the signal for low-affinity T cells (11). In occasional donors, they increase cytokine production in the absence of antigen (TNFα is usually the most affected).
-
8.
Adding staining Abs during stimulation: As described in Note 5, staining Abs to CD107 and CD154 are best added during stimulation, to capture the transiently expressed antigen. Fluorochrome-conjugated Abs are sensitive to light exposure, so they should be handled in low light and, once added, the samples should be incubated in the dark. Certain tandem dyes such as APC-Cy7 and PE-Cy7 are particularly sensitive to light and temperature (7) and are not optimal choices for use in stimulation cultures.
-
9.
Stimulation time: A minimum of 5–6 h allows adequate detection of most proinflammatory cytokines such as IFNγ, TNFα, and IL-2 (12). Increasing the time of incubation (in the presence of brefeldin A) increases cytokine staining intensity, but is not recommended for CD107 or CD154. For whole proteins requiring intracellular processing, a pre-incubation of 2 h prior to adding brefeldin A and/or monensin is recommended (12). CD8 responses to whole protein antigens can sometimes be detected and are increased with longer incubation in antigen alone, but not in all donors (13).
-
10.
Automating incubation times: A programmable heat block, incubator, or water bath can be used for time activation, cooling the samples to 4–18°C at the end of a specified period at 37°C, and holding them for later processing.
-
11.
A fixed-length vacuum manifold helps achieve consistent washing without undue cell loss in microtiter plates. Because of the small wash volume, a sufficient number of washes and efficient removal of supernatant are essential.
-
12.
CD3, CD4, and CD8 can be stained either before or after fixation and permeabilization. Down-modulation of these antigens occurs to a variable degree depending upon the stimulus. Cells that have down-modulated these antigens can be better detected by intracellular staining (post-fixation and permeabilization) (5), although the overall staining intensity is usually decreased. Most other cell-surface antigens are optimally stained before fixation.
-
13.
Freezing of activated samples: Samples can be frozen at −80°C directly in FACS lysing solution (12, 14). This allows for samples to be sent to another laboratory for processing, or for longitudinal samples to be accumulated for batch processing.
-
14.
Fixation and permeabilization steps: Solutions for these steps should be stored and used at 22–25°C. FACS lysing solution simultaneously lyses erythrocytes and fixes leukocytes. While erythrocyte lysis is not required for PBMC samples, fixation is still helpful to prevent cell loss prior to permeabilization.
-
15.
Centrifugation speed: All centrifugation post-fixation should be done at higher g force (500 × g) due to increased cell buoyancy.
-
16.
Use of paraformaldehyde is only helpful when samples are stored for more than 24 h prior to acquisition, or to ensure neutralization of potentially biohazardous samples. In addition to subtle effects on cell scatter and fluorescence, storage in paraformaldehyde can cause degradation of tandem dyes such as APC-Cy7 and PE-Cy7. An alternative fixative is available that protects these tandems from degradation (BD Stabilizing Fixative), but it is not compatible with AmCyan staining.
-
17.
Compensation controls: Where possible, anti-immunoglobulin-coated capture beads (BD Biosciences) are preferred as compensation controls, because they provide a bright and homogeneous population of events stained with the antibody conjugate of interest. Ideally, the same lot of antibody should be used for compensation as is used in the experiment. In practice, however, this is only important for certain tandem conjugates, such as APC-Cy7 and PE-Cy7. The compensation controls should ideally be treated identically to the experimental samples in terms of fixation, etc., although this too is important only for the above tandem dyes.
-
18.
When to apply compensation: While compensation can be calculated and changed at any time by software packages such as FlowJo (TreeStar, Ashland, OR) or FACS Diva, it is helpful to perform compensation before sample acquisition, so that any setup problems can be more readily detected.
-
19.
Number of events to collect: Because multiparameter ICS assays tend to divide responding populations of cells into ever-smaller subsets, it is important to process and collect enough cells per sample to allow statistically significant differences between samples to be detected. The number of events required will depend upon the anticipated levels of responses and background, as well as the number of subsets of responding cells being identified. Statistical tools for sample size calculation can be found at http://maeckerlab.typepad.com.
-
20.
Gating of down-modulated cells: Be sure that gates set on CD3, CD4, and CD8 parameters include dim-positive cells, since down-modulation of these markers occurs with activation. When using dynamic gating (see Note 21), set the region size to the maximum value possible without causing inclusion of neighboring populations. Some donors have a significant population of CD4 plus CD8dim T cells. This population contains a disproportionate number of cells specific for chronic antigens such as CMV and HIV, and should be included in the CD4+ T-cell gate to avoid under-reporting of responses.
-
21.
Batch analysis: Dynamic gating tools such “Snap-To” gates in FACS Diva can be used to accommodate staining differences between samples for populations such as CD3+, CD4+, and CD8+ cells (see Fig. 1). This in turn allows the use of a single analysis template and batch analysis across multiple samples in an experiment or study. However, dynamic gates are not always useful for rare populations, and their specifications (size and movement) need to be adjusted for the data set being analyzed. Batch analysis and dynamic gating thus do not replace the need for visual inspection of all data.
References
Jung, T., Schauer, U., Heusser, C., Neumann, C., and Rieger, C. (1993) Detection of intracellular cytokines by flow cytometry, J Immunol Methods 159, 197–207.
Prussin, C. and Metcalfe, D. D. (1995) Detection of intracytoplasmic cytokine using flow cytometry and directly conjugated anti-cytokine antibodies, J Immunol Methods 188, 117–128.
Waldrop, S. L., Pitcher, C. J., Peterson, D. M., Maino, V. C., and Picker, L. J. (1997) Determination of antigen-specific memory/effector CD4+ T cell frequencies by flow cytometry: evidence for a novel, antigen-specific homeostatic mechanism in HIV-associated immunodeficiency, J Clin Invest 99, 1739–1750.
Suni, M. A., Picker, L. J., and Maino, V. C. (1998) Detection of antigen-specific T cell cytokine expression in whole blood by flow cytometry, J Immunol Methods 212, 89–98.
Maecker, H. T., Dunn, H. S., Suni, M. A., Khatamzas, E., Pitcher, C. J., Bunde, T., Persaud, N., Trigona, W., Fu, T. M., Sinclair, E., Bredt, B. M., McCune, J. M., Maino, V. C., Kern, F., and Picker, L. J. (2001) Use of overlapping peptide mixtures as antigens for cytokine flow cytometry, J Immunol Methods 255, 27–40.
Maecker, H. T. (2009) Multiparameter flow cytometry monitoring of T cell responses, Methods Mol Biol 485, 375–391.
Maecker, H. T., Frey, T., Nomura, L. E., and Trotter, J. (2004) Selecting fluorochrome conjugates for maximum sensitivity, Cytometry A 62, 169–173.
Maecker, H. T., Rinfret, A., D’Souza, P., Darden, J., Roig, E., Landry, C., Hayes, P., Birungi, J., Anzala, O., Garcia, M., Harari, A., Frank, I., Baydo, R., Baker, M., Holbrook, J., Ottinger, J., Lamoreaux, L., Epling, C. L., Sinclair, E., Suni, M. A., Punt, K., Calarota, S., El-Bahi, S., Alter, G., Maila, H., Kuta, E., Cox, J., Gray, C., Altfeld, M., Nougarede, N., Boyer, J., Tussey, L., Tobery, T., Bredt, B., Roederer, M., Koup, R., Maino, V. C., Weinhold, K., Pantaleo, G., Gilmour, J., Horton, H., and Sekaly, R. P. (2005) Standardization of cytokine flow cytometry assays, BMC Immunol 6, 13.
Suni, M. A., Dunn, H. S., Orr, P. L., deLaat, R., Sinclair, E., Ghanekar, S. A., Bredt, B. M., Dunne, J. F., Maino, V. C., and Maecker, H. T. (2003) Performance of plate-based cytokine flow cytometry with automated data analysis, BMC Immunol 4, 9.
Disis, M. L., Dela Rosa, C., Goodell, V., Kuan, L. Y., Chang, J. C., Kuus-Reichel, K., Clay, T. M., Kim Lyerly, H., Bhatia, S., Ghanekar, S. A., Maino, V. C., and Maecker, H. T. (2006) Maximizing the retention of antigen specific lymphocyte function after cryopreservation, J Immunol Methods 308, 13–18.
Waldrop, S. L., Davis, K. A., Maino, V. C., and Picker, L. J. (1998) Normal human CD4+ memory T cells display broad heterogeneity in their activation threshold for cytokine synthesis, J Immunol 161, 5284–5295.
Nomura, L. E., Walker, J. M., and Maecker, H. T. (2000) Optimization of whole blood antigen-specific cytokine assays for CD4(+) T cells, Cytometry 40, 60–68.
Maecker, H. T., Ghanekar, S. A., Suni, M. A., He, X. S., Picker, L. J., and Maino, V. C. (2001) Factors affecting the efficiency of CD8+ T cell cross-priming with exogenous antigens, J Immunol 166, 7268–7275.
Nomura, L. E., DeHaro, E. D., Martin, L. N., and Maecker, H. T. (2003) Optimal preparation of rhesus macaque blood for cytokine flow cytometric analysis, Cytometry 53A, 28–38.
Nomura, L. E., Emu, B., Hoh, R., Haaland, P., Deeks, S. G., Martin, J. N., McCune, J. M., Nixon, D. F., and Maecker, H. T. (2006) IL-2 production correlates with effector cell differentiation in HIV-specific CD8+ T cells, AIDS Res Ther 3, 18.
Acknowledgments
Details of this protocol were optimized by Laurel Nomura and Maria Suni (BD Biosciences).
Author information
Authors and Affiliations
Corresponding author
Editor information
Editors and Affiliations
Rights and permissions
Copyright information
© 2011 Springer Science+Business Media, LLC
About this protocol
Cite this protocol
Lovelace, P., Maecker, H.T. (2011). Multiparameter Intracellular Cytokine Staining. In: Hawley, T., Hawley, R. (eds) Flow Cytometry Protocols. Methods in Molecular Biology, vol 699. Humana Press. https://doi.org/10.1007/978-1-61737-950-5_8
Download citation
DOI: https://doi.org/10.1007/978-1-61737-950-5_8
Published:
Publisher Name: Humana Press
Print ISBN: 978-1-61737-949-9
Online ISBN: 978-1-61737-950-5
eBook Packages: Springer Protocols