


Abstract
Interferome v2.0 (http://interferome.its.monash.edu.au/interferome/) is an update of an earlier version of the Interferome DB published in the 2009 NAR database edition. Vastly improved computational infrastructure now enables more complex and faster queries, and supports more data sets from types I, II and III interferon (IFN)-treated cells, mice or humans. Quantitative, MIAME compliant data are collected, subjected to thorough, standardized, quantitative and statistical analyses and then significant changes in gene expression are uploaded. Comprehensive manual collection of metadata in v2.0 allows flexible, detailed search capacity including the parameters: range of -fold change, IFN type, concentration and time, and cell/tissue type. There is no limit to the number of genes that can be used to search the database in a single query. Secondary analysis such as gene ontology, regulatory factors, chromosomal location or tissue expression plots of IFN-regulated genes (IRGs) can be performed in Interferome v2.0, or data can be downloaded in convenient text formats compatible with common secondary analysis programs. Given the importance of IFN to innate immune responses in infectious, inflammatory diseases and cancer, this upgrade of the Interferome to version 2.0 will facilitate the identification of gene signatures of importance in the pathogenesis of these diseases.
INTRODUCTION
Interferon (IFN) was discovered and defined as a protein with the ability to protect cells from infection (1,2). It has been subsequently realized that there is a large family of IFN proteins that have pleiotrophic effects. There are three types of IFNs, namely type I (composed of α, β, κ, ε and ω subtypes), type II (a single IFNγ) and type III (IFNλ; also called IL28 and IL29), which are distinguished by having distinct genetic loci, amino acid sequence homology and specific cognate receptors (3). All IFNs can have numerous effects on cells, including the ability to modulate growth, differentiation, proliferation, survival/apoptosis and motility. In the immune system, these basic properties result in the ability of IFNs to regulate the development and activities of most effector cells (4,5). They can affect most cells in the body that express the cognate receptors, albeit differently. Consequently, they have wide ranging effects on homeostasis and pathology. IFNs are involved in the host response to infection, inflammation, cancer, autoimmunity and metabolic disorders. The diverse properties of IFNs have led to extensive exploration of their therapeutic potential, and they are currently used in the treatment of chronic viral infections, some cancers and multiple sclerosis (6–8).The potency of IFNs varies over 1000-fold. Because IFNs may also contribute to the pathogenesis of disease, there are clinical trials of reagents to block IFN activity in diseases such as Systemic Lupus Erythematosus (9). Administration of IFN also has side effects associated with dose-limiting toxicity (10). As a consequence, there is considerable interest in understanding the regulation of IFN signalling: how each signal transduction pathway is activated or suppressed; what biological effects are attributed to which pathways; and how they can be differentially modulated.
Once an IFN has engaged its cognate receptor, a series of events are activated to transduce signals (11). The IFN receptors are pre-associated with pairs of JAK kinases which, once activated by the ligand binding to its receptor, phosphorylate tyrosine residues on each other and on the intracellular domains of the receptors. This results in the docking of latent cytoplasmic signal transducers and activators of transcription (STAT proteins) to the activated receptor, phosphorylation, and then release from the receptor and translocation to the nucleus where they bind to the regulator regions and activate the transcription of so-called IFN-regulated genes (IRGs). Although particular STATs have been historically associated with particular types of IFNs [e.g. type I IFN signals via the ISGF3 complex (STAT1:STAT2:IRF9) binding to ISRE promoter elements, type II IFN signals through STAT1:STAT3 homo- and heterodimers binding to GAS promoter elements], the range of signals that are generated from ligated receptors is far more complex. In fact, IFNs can activate STATs 1, 2, 3, 4, 5 and 6 depending on the type of IFN and the target cell (12). In addition, there are non-STAT signalling pathways also activated including PI3 kinase, MAP kinase and others (13). The activation of these many signal transduction pathways leads to activated transcription factors binding to promoters and regulating the expression of sets of IRGs (14). It is the nature of the genes, their magnitude, duration and cellular context that will determine the outcome of the IFN response. This response will vary from cell to cell and can be beneficial or harmful to the host. IFNs are produced in a variety of circumstances (15). In recent years, there has been a revolution in understanding the innate immune system, which evolved to recognize bacteria, viruses and other pathogens, and then to mount an immediate response and sculpt the ensuing, memorized adaptive immune response. Pattern recognition receptors of the host cell can sense molecules on pathogens and stimulate the production of protective cytokines such as IFNs. Many studies have demonstrated the critical role IFNs play in the response to bacterial and viral infections (16–18). In addition, these pathways evolved to sense pathogen molecules, such as nucleic acids and are now recognized to sense and react to DNA and RNA that can be generated in different physiological and pathological circumstances, thus identifying a role for IFNs in such diverse diseases as autoimmunity, cancer, diabetes, neurodegeneration and developmental anomalies (19). It remains unclear how IFN contributes to the pathogenesis of these diseases.
The existence of genomic technologies such as microarrays has enabled the genome-wide assessment of changes in gene expression in different pathophysiological circumstances. Gene signatures are becoming commonly used in the diagnosis of disease, to analyse response to therapy, to stratify patients, as a means to understand the basis of disease, and to craft new therapeutic approaches. Given the importance of the IFN response in numerous diseases and our lack of understanding of the many signalling pathways activated, we embarked on a project to collect and annotate a comprehensive list of IFN-regulated genes, associated data and pathway predictions and established the Interferome DB (www.interferome.org) (20). Since its publication in 2009, it has received >2 million hits, has 48 citations in eminent journals and we have had considerable feedback requesting additional functionality or access; refer database statistics and (21). We herein describe an update of the Interferome DB called v2.0 (http://interferome.its.monash.edu.au/interferome/).
In summary, there has been a significant improvement in computational infrastructure enabling the support of more data sets and faster and more complex queries. All data are MIAME compliant and have now been subjected to quantitative and statistical analysis; the data is quantitative and is extensively annotated. Comprehensive metadata allows extensively improved, flexible search capacity. There is no limitation on the number of genes that might be simultaneously queried. Enhanced annotation permits a more comprehensive interpretation of results, which can be downloaded in convenient text-based formats to be compatible with common secondary analyses.
COLLECTION, CURATION AND ANNOTATION OF THE DATA
Data sourcing
For inclusion in the Interferome v2.0, microarray data sets from experiments where murine or human cells were treated with an IFN, were collected from on-line Arrayexpress and GEO databases. The data was checked for MIAME compliance and associated publications were examined to verify the experimental design and methodologies before the data was uploaded for local analysis.
Data pre-processing
For the storage, management and statistical analysis of microarray experiments from different platforms, the BioArray Software Environment (BASE) server was established (22). This processing represents a significant improvement in Interferome v2.0 compared with the original Interferome (‘v1.0’) which included only qualitative up- or down-regulation. The pre-processing of the array data was platform- and array design-specific. Raw data from Affimetrix arrays were normalized using the Robust Multi-array Averaging (RMA) method (23), which consisted of three steps: background adjustment, quantile normalization (24) and summarization (25). For some experiments, only processed data were available, and these data were only used if they had been processed and normalized using RMA, GeneChip RMA (GCRMA) or MicroArray Suite (MAS5) methods. Data from one-colour Agilent arrays were processed using functions from the Linear Models for Microarray (LIMMA) bioconductor package (LIMMA, http://bioinf.wehi.edu.au/limma). Non-uniform spots were filtered from the data set and background subtraction was performed using the Normexp function with an offset of 50. Normalization to the 75th percentile was performed to remove technical variations between individual arrays. Data from two-colour arrays were normalized applying normalizeWithinArrays and normalizeBetweenArrays (26,27). Data from any replicated probes were averaged to provide a single measure for each probe in the array. All Agilent control probes were removed. Normalized probes from both microarray platforms were filtered to remove low intensity features, which were defined as probes that did not exceed the 20th percentile in at least two microarrays across the whole experiment.
Significance testing
Responses to interferon were established by comparing gene expression in interferon-treated samples with appropriate controls. All data were log2 transformed before analysis. The statistical significance of any differences in gene expression was tested using a paired or unpaired t-test (28,29). The Welch t-test was adopted to avoid any assumption of equal variance; previous analysis had indicated that the Welch t-test tended to be more conservative and so less likely to return false than other related tests. The threshold for statistical significance in gene expression was set at P < 0.05. The fold change induced by the interferon treatment was computed for each significant gene and provided in a linear scale.
Data annotation (metadata)
A powerful design feature of the Interferome v2.0 database is the ability to search across data sets to explore biological drivers of IFN responses. To achieve this, all information supplied with the data sets and the associated publications were carefully examined to retrieve experimental metadata for annotation that would be used later to add a valuable new feature to enable selection of particular experimental features when searching the Interferome v2.0 database. The experimental factors include IFN type and subtype, treatment time and concentration, in vivo (i.e. mouse or human injection) or in vitro (e.g. cell culture) experiment, species, (organ) system (e.g. haemopoietic, cardiovascular), organ, cell, cell line and normal/abnormal and array design. The concentration is given in IU/ml, which is the most common unit used in the experiments, but it should be noted that different IFNs can vary 1000-fold in their specific activity (IU/mg protein), so these units do not signify equimolar concentrations; the importance of concentration should be interpreted cautiously. The ‘abnormal’ annotation is subdivided into: genetic variant (e.g. a human with a known genetic condition, or a transgenic or gene knockout mouse), disease state (again, this could represent a person with a disease or a mouse disease model) and pre-treatment. Explanations for all these parameters can be found in the ‘Help’ pages. Note that the default option for all database queries is set to ‘All’, meaning that every data set in all categories (all tissues, all IFNs, etc.) will be interrogated unless specific experimental factors are selected on the search page. Alternatively, search page provides the user with the option to search for gene responses to any specific combination of experimental factors.
DATABASE IMPLEMENTATION
Release v2.0 of Interferome DB uses an object oriented JAVA-based API supporting a relational MySQL database. Interferome source code and Java-API are publicly available and can be downloaded from http://code.google.com/p/interferome/. The Interferome DB is operating system independent and accessible from any standard web browser, or can be installed locally with a minimum 3Gb RAM for a web server. Interferome v2.0 was developed and tested with following software versions: Java SE 1.6× (http://www.oracle.com/technetwork/developer-tools/jdev/index.html), Tomcat6.× or above (http://tomcat.apache.org/), Java Developing IDEA—IntelliJ 10.× or Eclipse 3.2.× (http://www.eclipse.org/), Apache Ant1.8 or above (http://www.apache.org/), Struts2.× or above (http://struts.apache.org/2.x/), Spring 3.0 or above (http://www.springsource.org/), Hibernate 2.5 or above (http://www.hibernate.org/), JQuery 1.4 (http://jquery.com/), SVN 1.6 (http://subversion.apache.org/docs/release-notes/1.6.html) and MySQL5 or above (http://www.mysql.com/).
SEARCHING THE DATABASE
To interrogate the database, a mouse or human gene or a gene list can be submitted as one of three formats: a gene symbol, GenBank Accession number or Ensembl Id list. There is no limit to the number of genes submitted, which is a major advantage compared with the original Interferome DB (‘v1.0’), which was restricted to a list of 100 genes.
If search criteria are left in the default settings, then all data sets according to the descriptions given above will be queried. Alternatively one can select for data sets induced by a particular type of IFN, or subtype in the case of type I IFNs, treatment concentration (in IU/ml, not µg or molar concentrations—see above) and treatment time (Figure 1). In addition, experiments performed only in vitro in cell cultures or alternatively, only in vivo injections of either the murine or human system can be selected. The type of sample can be chosen from normal (cells or organism) or abnormal (i.e. disease, genetic variation—including gene targeted, or pre-treatment). The last selection is the range of -fold change that the user wants to interrogate. Either up- or down-regulated genes or genes changing in either direction can be selected. The default setting for -fold change is set at 2-fold because this is the most commonly used in the literature. However, one can set the cut-off high (10× or more) to find only highly regulated genes. Alternatively the cut-off can be set lower (e.g. 1.5×) in which case a larger gene set would be obtained; this may be an advantage if secondary analyses such as transcription factor binding site analysis of a gene set is to be performed. It is important to note that the database contains all data considered to be significantly different at the level of P < 0.05; so even at settings lower than 2-fold, only genes whose expression is significantly altered will be selected.
SEARCH RESULTS
Once the ‘Search’ command has been selected time (Figure 1):
‘Gene Summary’ tab will select a page that shows the details of the gene being searched (Ensembl Id, gene name, Description, Entrez GenBank and UniGene numbers).
‘Experimental Data’ tab presents one or more pages of Search Results showing the number of data entries found. These can be displayed in pages of 20–200 data points per page, sorted by: -fold change, IFN type, treatment time, Id (Ensembl or data set probe), Gene symbol or data set. The data presented on this page can be ordered according to data set, or in ascending or descending order of -fold change. The data are presented in a table with the following columns for:
Dataset which provides a link to a page which displays the original experiment with its unique identifier number for internal Interferome tracking; a list of our manually annotated Experimental Factors that comprise the metadata used for search criteria, and for which ‘View Details’ shows the original reference, Pubmed Id, and link to the original data in GEO or ArrayExpress. This section also includes a detailed list of experimental results.
Fold change is the extent of gene induction or suppression.
Interferon type, treatment time(in hours), Gene symbol and other identifiers are self-explanatory and have links to Ensembl.
Probe ID is added for extra detail because some array platforms can have multiple probes for a given gene and these can sometimes yield different results, if for example, there are different spliced gene transcripts that are differentially regulated by IFN.
The data can be downloaded as a tab delimited or other file, which is compatible with most common secondary analysis programs.
SECONDARY ANALYSES
In ‘Search’ mode, in addition to the two main data presentation formats described above, there are options for several secondary analyses (Figure 1), namely:
Ontology Analysis—displays as a word cloud whereby the gene ontologies (GO) that occur more frequently are presented in larger font. Clicking on a GO term in this cloud links to the relevant record in the GO database [http://amigo.geneontology.org/; (30)]. In addition the data are presented in a tabular format containing columns for GO accession number, term name, definition and P value to facilitate further downstream analysis.
TF Analysis—presents a linear representation of 1500 base pairs of sequence upstream (5′) of the transcription start site of the IRG, with coloured blocks depicting the predicted transcription factor (TF)-binding elements in the promoter. Predictions are based on the MATCH algorithm using TRANSFAC 2012 professional matrices applying minimum false positive cut-off. Holding the mouse cursor over each coloured block presents details of the associated transcription factor. If ‘All’ data or time points are selected in the search criteria, then the genes regulated may represent the consequence of both primary and secondary IFN signal transduction pathways regulating the expression of genes. If only IRGs targeted by of the primary IFN signalling pathways are of interest, it is recommended that the search should be limited to early time points such as 1 or perhaps 3 h.
Chromosomes—presents a drawing of the human or mouse chromosomes with the location of the IRGs plotted in red.
IFN Subtype—displays a Venn diagram representing how many genes are regulated by each type of IFN and the overlaps of genes regulated by two or all three IFN types. It should be noted that there are far fewer data sets of genes regulated by type II or type III IFNs and this may introduce bias or false negatives in regard to genes regulated by these subtypes. Thus, caution is encouraged in the interpretation of negative results from this analysis.
Basal Expression—displays a heat map of the expression of IRGs in their resting, unstimulated state, across various tissues and cells. The human and mouse expression data were obtained from the tissues and cell lines data in the BioGPS portal (31). The IRG list resulting from the search is plotted against expression in these tissues and cells, with red indicating high expression and blue low expression.
All ‘Secondary Search’ results can be downloaded in a tab delimited or other file.
FUTURE DIRECTIONS AND ONGOING CURATION
In recent years, the availability of genomics technologies and improvements in analytical methods, such as those made available in the Interferome, has highlighted the association of pathways activated by IFNs in a broad range of diseases, including influenza outbreaks (32), hepatitis (33), HIV (34), Mycobacterium tuberculosis (35), breast cancer metastases (36) and autoimmune disorders (37). Annotation of these pathways holds considerable promise for the development of refined diagnostics and new therapies and vaccines. Databases such as the Interferome with related sites together with the use of more sophisticated tools will greatly facilitate the identification of gene signatures associated with disease and the generation of hypotheses to be validated in preclinical animal models and clinical trials.
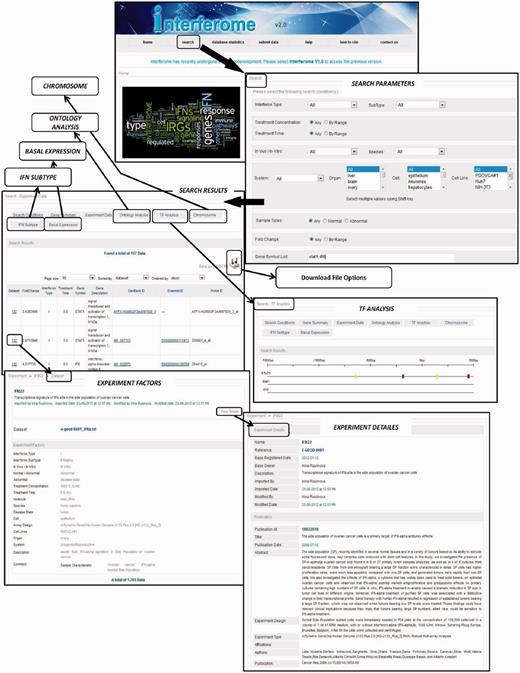
Interferome v2.0 screenshots and workflow depicting the Homepage (top) with options for selecting to search for IRGs in a data set, database statistics, help, citation, contact information as well as option for submitting data for inclusion in the Interferome v2.0. Selecting ‘Search’ brings up a page where the user can select various search parameters or leave in the default option to search all data sets. Next ‘Search Results’ pages are shown as depicted with several options for presentation, and detailed information on the data can be found by clicking on data set to reveal details of Experimental factors and thereafter further Experimental data can by obtained by selecting the ‘View Data option’. Several options for secondary analysis within Interferome v2.0 are provided, namely Transcription Factor (TF) Analysis (shown in the neighbouring box), Ontology, Chromosome plot, Basal Expression (tissue expression heat map) or IFN subtype (Venn diagrams showing how many gene are induced by each IFN type).
The Interferome v2.0 team is committed to the ongoing curation and improvement of the database. The prime activity is the continual addition of new data. Users are encouraged to submit data for inclusion in the Interferome v2.0 via the new ‘Submit data’ tab. We request that data are MIAME compliant and a form be uploaded from the link (http://www.mged.org/Workgroups/MIAME/miame.html), which is provided on the website. This will accompany the data file upload which will be reviewed by the Interferome DB administrators prior to statistical analysis using the pipeline described above. Genes and data sets that show a significant response to IFN treatments will be loaded into the database. Relevant supporting experimental data must be made available with the gene expression data to ensure that all required metadata and experimental factors are loaded into the database.
In addition we will continue to look to improve and update the programs used for secondary analysis and source these either from publicly available information or in-house developed programs. In particular we will be exploring transcription factor binding sites (TFBS), pathway and networks programs.
FUNDING
The Australian National Health and Medical Research Council; the Australian National Data Service; the Australian Research Council’s Centre of Excellence in Structural and Functional Microbial Genomics; the Université Paris Descartes; and the Victorian Government's Operational Infrastructure Support Program. Funding for open access charge: Australian National Health and Medical Research Council and Australian Research Council Centre of Excellence in Structural and Functional Microbial Genomics.
Conflict of interest statement. None declared.
REFERENCES
Author notes
The authors wish it to be known that, in their opinion, the first two authors should be regarded as joint First Authors.

Comments