Topography of cancer-associated immune cells in human solid tumors
- National Center for Tumor Diseases, University Hospital Heidelberg, Germany
- German Cancer Consortium, Germany
- German Cancer Research Center, Germany
- University Hospital RWTH Aachen, Germany
- University Medical Center Mannheim, Heidelberg University, Germany
- Centre for Cancer Research and Cell Biology, Queen’s University Belfast, United Kingdom
- University Hospital Heidelberg, Germany
- Tissue Bank of the National Center for Tumor Diseases, Germany
- German Cancer Research Center and National Center for Tumor Diseases, Germany
- German Cancer Research Centre, Germany
- University Cancer Center Hamburg, University Medical Center Hamburg-Eppendorf, Germany
Abstract
Lymphoid and myeloid cells are abundant in the tumor microenvironment, can be quantified by immunohistochemistry and shape the disease course of human solid tumors. Yet, there is no comprehensive understanding of spatial immune infiltration patterns (‘topography’) across cancer entities and across various immune cell types. In this study, we systematically measure the topography of multiple immune cell types in 965 histological tissue slides from N = 177 patients in a pan-cancer cohort. We provide a definition of inflamed (‘hot’), non-inflamed (‘cold’) and immune excluded patterns and investigate how these patterns differ between immune cell types and between cancer types. In an independent cohort of N = 287 colorectal cancer patients, we show that hot, cold and excluded topographies for effector lymphocytes (CD8) and tumor-associated macrophages (CD163) alone are not prognostic, but that a bivariate classification system can stratify patients. Our study adds evidence to consider immune topographies as biomarkers for patients with solid tumors.
https://doi.org/10.7554/eLife.36967.001Introduction
Malignant tumors growing in an immunocompetent host elicit an immune response, evident by the presence of various inflammatory/immune cell in tumor tissue (Shalapour and Karin, 2015; Mantovani et al., 2008; Bindea et al., 2013). In order to grow to a clinically relevant size, tumor cells develop specific escape mechanisms against the immune system by manipulating inflammatory cells for their benefit (de Visser et al., 2006; Dunn et al., 2002; Fridman et al., 2013). One of the key strategies is that tumor cells interfere with immune signaling, hijacking immunosuppressive cells and thereby shaping the immune infiltrate, which allows for tumor cell proliferation (Chen and Mellman, 2013; Chen and Mellman, 2017).
These mechanisms have been in the focus of oncology for several years (Kather et al., 2018a). Currently a number of immunotherapeutic drugs are available which interfere with immune cells in the tumor microenvironment in order to facilitate tumor control (Becht et al., 2016a; Galluzzi et al., 2014). However, the complex nature of immune infiltrates impairs the development of more targeted approaches. Specifically, tailored combination treatments are widely proposed as a way to more effective cancer therapy (Sharma and Allison, 2015a; Sharma and Allison, 2015b; Zitvogel et al., 2011). Systematically deciphering tumor-immune phenotypes is key to a better understanding and more effective tailoring of immunotherapies (Greenplate et al., 2016).
Analysis of solid tumor tissue slides by immunohistochemistry (IHC) is the gold standard to assess tumor immune infiltrate because it allows for exact quantification of type, density and localization of immune cells (Fridman et al., 2017; Becht et al., 2016b). For more than a decade, digital pathology has been the method of choice to reliably and reproducibly analyze large cohorts of patient samples and can provide potential biomarkers for immunotherapy (Becht et al., 2016a; Kather et al., 2016; Gurcan et al., 2009). Immune cell quantification in digitized tissue has been used to identify robust and clinically relevant biomarkers in numerous cancer entities, for example in colorectal cancer (CRC) primary tumors and liver metastases (Galon et al., 2006; Halama et al., 2011; Mlecnik et al., 2016). Histological analysis of tumor-infiltrating lymphoid cells has been proven to be a reliable and prognostically relevant marker (Galon et al., 2014; Denkert et al., 2016; International TILs Working Group 2014 et al., 2015). Antitumor immunity arises in a complex ecosystem of various cell types that closely interact with one another, such as effector lymphocytes (Li et al., 2016), macrophages (Halama et al., 2016; Biswas and Mantovani, 2010), dendritic cells (Gardner and Ruffell, 2016), granulocytes (Coffelt et al., 2016), innate lymphoid cells (Crome et al., 2017), regulatory T cells (Nishikawa and Sakaguchi, 2010), natural killer cells (Crome et al., 2013; Barrow and Colonna, 2017), myeloid-derived suppressor cells (Talmadge and Gabrilovich, 2013) and other cell types (Kather et al., 2017). In tumor tissue, T lymphocytes (T cells) and macrophages are among the most abundant immune cells and are closely related to clinical outcome (Fridman et al., 2017; Kather et al., 2017; Fridman et al., 2012; Kather et al., 2018b).
After years of detailed IHC analysis of solid tumor slides, a paradigm for the classification of tumor-immune phenotypes has emerged and three classes of tumors are generally assumed: ‘cold’ tumors (or ‘immune desert’, showing no immune cell infiltration), ‘immune-excluded’ tumors (with immune cells aggregating at the tumor boundaries) and ‘hot’ tumors (or ‘inflamed’ tumors, showing pronounced immune infiltrates in the tumor core (Chen and Mellman, 2017; Lanitis et al., 2017; Joyce and Fearon, 2015). However, although this classification is generally accepted, it is backed by surprisingly little quantitative data. Fundamental biological questions regarding this concept are essentially unanswered, such as: Do these topographies exist in all tumor entities? Is there a difference between immunotherapy-sensitive and immunotherapy-insensitive tumor types? Does the concept of cold/excluded/hot apply to lymphoid and myeloid cells, or only to one of them? Do all tumors use the same strategies for immune escape?
In the last years, several large studies have systematically investigated immune-tumor phenotypes in detail. However, most of these studies were not suitable to distinguish cold, excluded and hot tumors because they did not look at the tumor core and the invasive margin at the same time. Two recent studies of immunophenotypes in colorectal cancer (CRC) have shown that the average immune cell density is higher around the tumor than in the tumor core (Bindea et al., 2013; Mlecnik et al., 2016). Yet, the concept of cold/excluded/hot tumors was not investigated in these studies. Also, other comprehensive studies have not taken spatial patterns of immune cell phenotypes into account (Becht et al., 2016). Recent large-scale studies have looked at high-dimensional phenotypes of tumor-infiltrating immune cells, but have not specifically addressed different topographies (Newell and Davis, 2014; Wong et al., 2016; Newell and Becht, 2018; Kather et al., 2018c). Another previous study investigated spatial patterns of lymphoid and myeloid cells in human solid tumors – however, only tissue microarrays (TMA) were included in that study, precluding any possible differentiation between invasive margin and tumor core (Tsujikawa et al., 2017). Lastly, the correlation of the tumor immunophenotype to its transcription profile was investigated previously, but was lacking a spatially resolved approach (Charoentong et al., 2017).
In the present study, we have attempted to close this knowledge gap by a systematic analysis of a large cohort of various human tumors in a spatially resolved way. In particular, this included a systematic analysis of the following immune cells: CD3+ T-lymphocytes, CD8+ T-lymphocytes, PD1+ T lymphocytes, FOXP3+ T lymphocytes (which we assume to be largely ‘regulatory’, although the role of FOXP3 is more complex (Wang et al., 2007) and CD68+ and CD163+ monocytes/macrophages.
Results
Immune cell densities in major cancer entities
We measured immune cell densities (number of cells per mm², Figure 1A–B) in 965 immunostained histological tissue slides (listed in Supplementary file 3) in the pan-cancer cohort in three spatial compartments per slide (Figure 1C): outer invasive margin (0 – 500 µm outside the tumor invasion front), inner invasive margin (500 µm to the inside) and in the tumor core. In accordance with previous studies, colorectal adenocarcinoma primary tumors and liver metastases had a higher cell count in the outer invasive margin than in the tumor core (Figure 2—figure supplement 2 and Figure 2—figure supplement 3). Melanoma samples had higher cell counts in the inner tumor than outside of the tumor for all analyzed cell types. The other tumor types showed less clear-cut patterns, highlighting the need for a more detailed analysis.
Figure 1 with 1 supplement see all
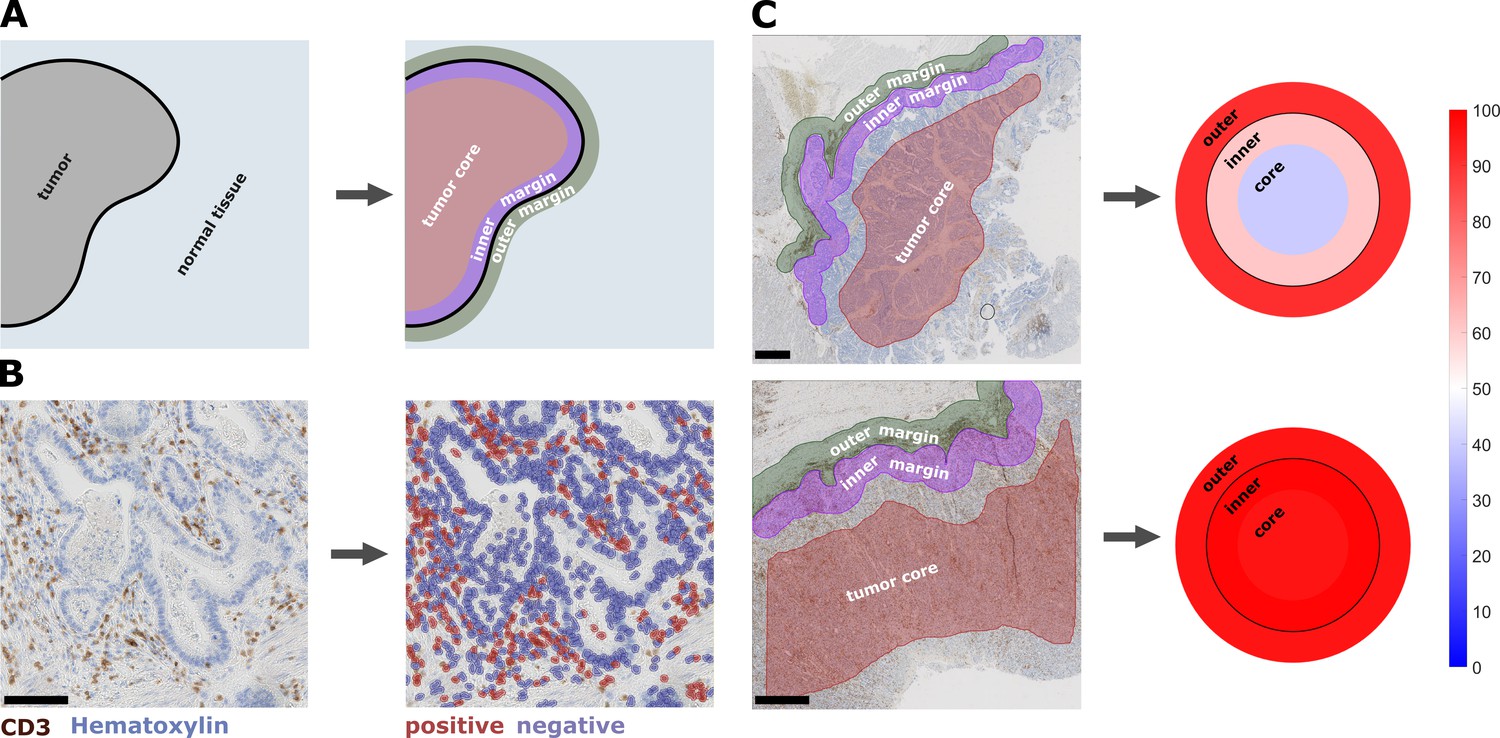
Semiautomatic image analysis defines immune cell topography.
(A) Manual delineation of three compartments: outer 500 µm invasive margin, inner 500 µm invasive margin, tumor core. (B) Example of automatic cell detection in a CD3-stained gastric carcinoma slide. Left: original image, right: after cell detection and classification. (C) Cell counts in all three compartments can be used to create a ‘target plot’ (visualization resembling a shooting target) where the color of each compartment corresponds to the percentile-normalized cell density. Here, two examples of CD3-stained gastric carcinoma tissue slides are shown. The upper sample has an immune-excluded phenotype while the lower sample has an inflamed phenotype. Unit on the color scale: percentile-normalized cell density. Scale bar in B is 100 µm, scale bars in C are 1 mm.
Unsupervised clustering of lymphocyte densities separates hot and cold tumors
As previous studies have assumed the existence of ‘hot’, ‘cold’ and ‘immune excluded’ tumors with regard to lymphocyte infiltration, we assessed our data set for evidence of this clustering. We used cell densities for CD3+ and CD8+ cells in all three spatial compartments and used multiple methods to determine the optimal number of clusters. For CD3 and CD8 separately as well as for both together, the majority of the optimization runs converged on two clusters (Figure 2—figure supplement 4), mostly representing ‘hot’ and ‘cold’ tumors. There was no strong tendency to converge on three clusters, which means that there is no strong inherent grouping into ‘hot’, ‘cold’ and ‘immune excluded’ tumors.
Conceptual definition of hot, cold and immune excluded tumors
We asked whether there is a rationale to define ‘immune excluded tumors’ as a separate group although it does not naturally emerge in unsupervised clustering methods. With three spatial compartments, each of them having either high or low cell density, there are in theory eight possible topographies. We asked whether this number could be reduced and analyzed the statistical correlation between the spatial compartments for each type of staining in all tumor types. We found that in general, there was a high correlation between ‘tumor core’ and ‘inner invasive margin’, but not between either compartment and the ‘outer invasive margin’ (Figure 2—figure supplement 5). ‘Tumor core’ and ‘inner invasive margin’ can be collapsed into one compartment because cell counts in these compartments are highly correlated. This leaves only four possible topographies that are by equivalent to three previously postulated phenotypes (Chen and Mellman, 2017): high density outside of the tumor with a low density inside the tumor can be described as ‘immune excluded’. Low density inside and outside is ‘cold’ and high density inside the tumor is ‘hot’ regardless of cell density outside of the tumor (Figure 2A–F).
Figure 2 with 5 supplements see all
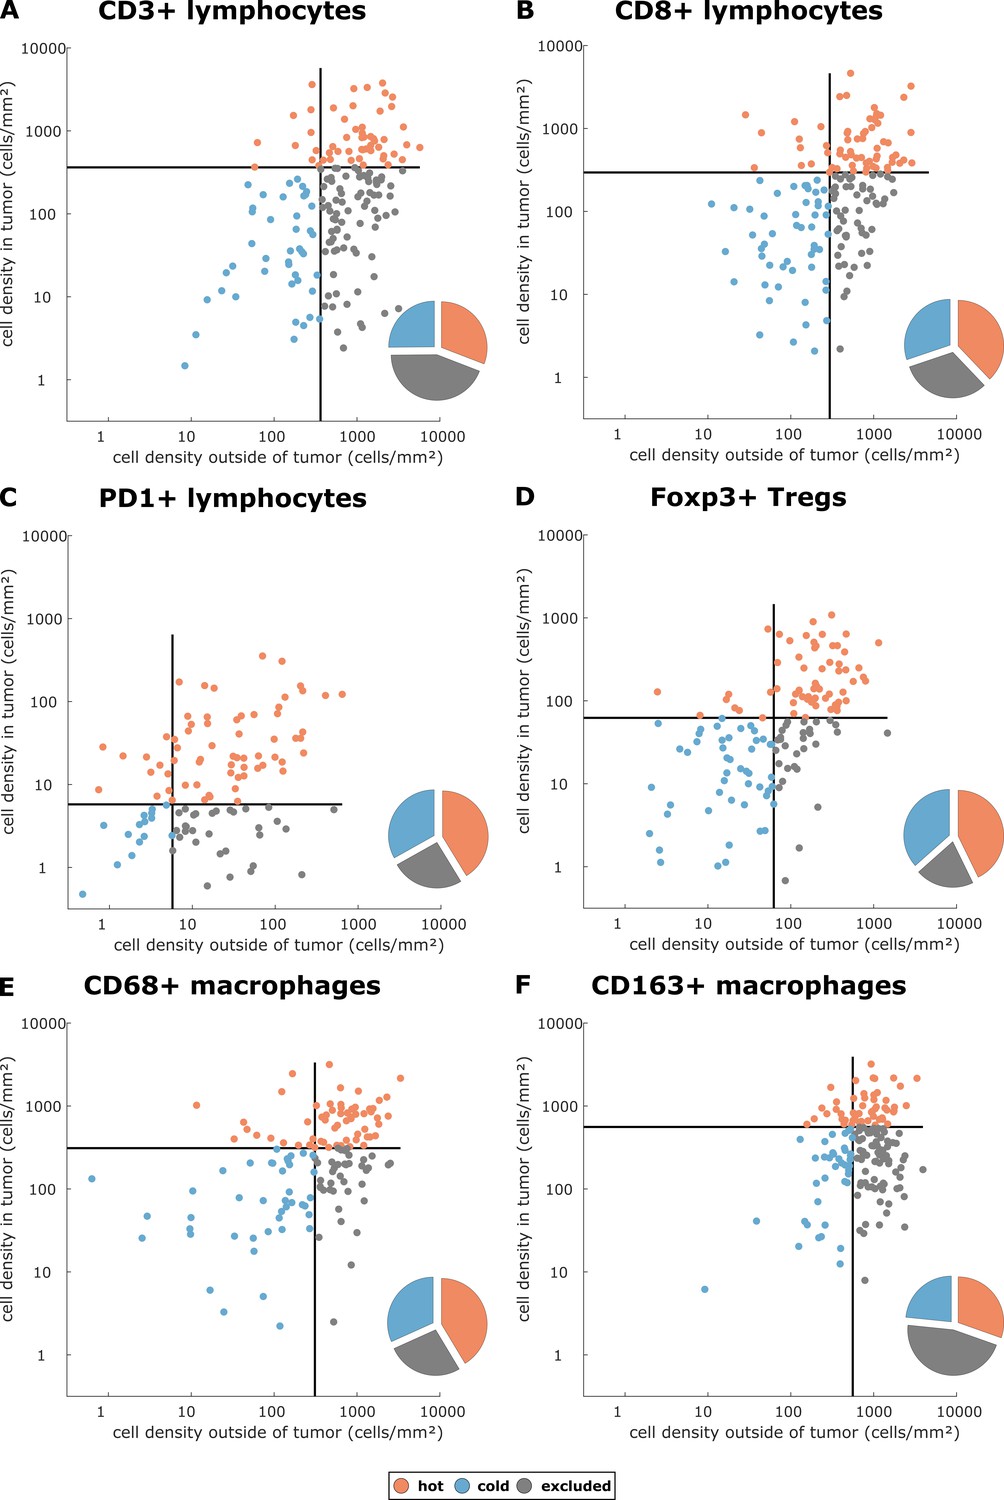
Cell densities in the tumor core and in the outer invasive margin in the pan-cancer cohort.
Raw cell densities are plotted for each cell type and both major compartments. Gray lines indicate the median density for this cell type. Split at the median, tumors can be classified as cold, hot or immune excluded for all immune cell types. However, the scatter plot shows that for all immune cell types, there is no natural clustering into these phenotypes – the phenotypes blend into each other.
Prevalence of immune topographies in different tumor types
Having operationalized these definitions of immune topographies, we next asked how they are distributed in different tumor types in the pan-cancer cohort. As a cutoff value for high versus low cell density we used the median cell density for each cell type (median number of cells per mm² in any tumor type in any compartment, listed in Supplementary file 4). Based on these definitions, different tumor types showed very different distributions of immune topographies (Figure 3A–F). Most strikingly, tumor types that are to some degree sensitive to approved cancer immunotherapies (such as melanoma (MEL), lung adeno (LUAD), lung squamous (LUSC) and head and neck squamous (HNSC) had a large proportion (approximately half) of CD3-hot, CD8-hot and PD1-hot tumors. In accordance with previous studies (Halama et al., 2011), colorectal primary (COAD-PRI) and colorectal metastatic (COAD-MET) had a very high proportion of CD3-excluded tumors (Figure 3A). Differences between tumor types were most pronounced for regulatory T-cells (Foxp3+ cells, Figure 3D) with more than half of lung adeno (LUAD), head and neck squamous (HNSC), stomach adenocarcinoma (STAD) and esophageal (ESCA) cancer samples having Foxp3-hot topographies. Also, while close to half of all analyzed COAD-PRI samples were Foxp3-hot, the vast majority of all COAD-MET samples were Foxp3-cold (Figure 3A).
Figure 3
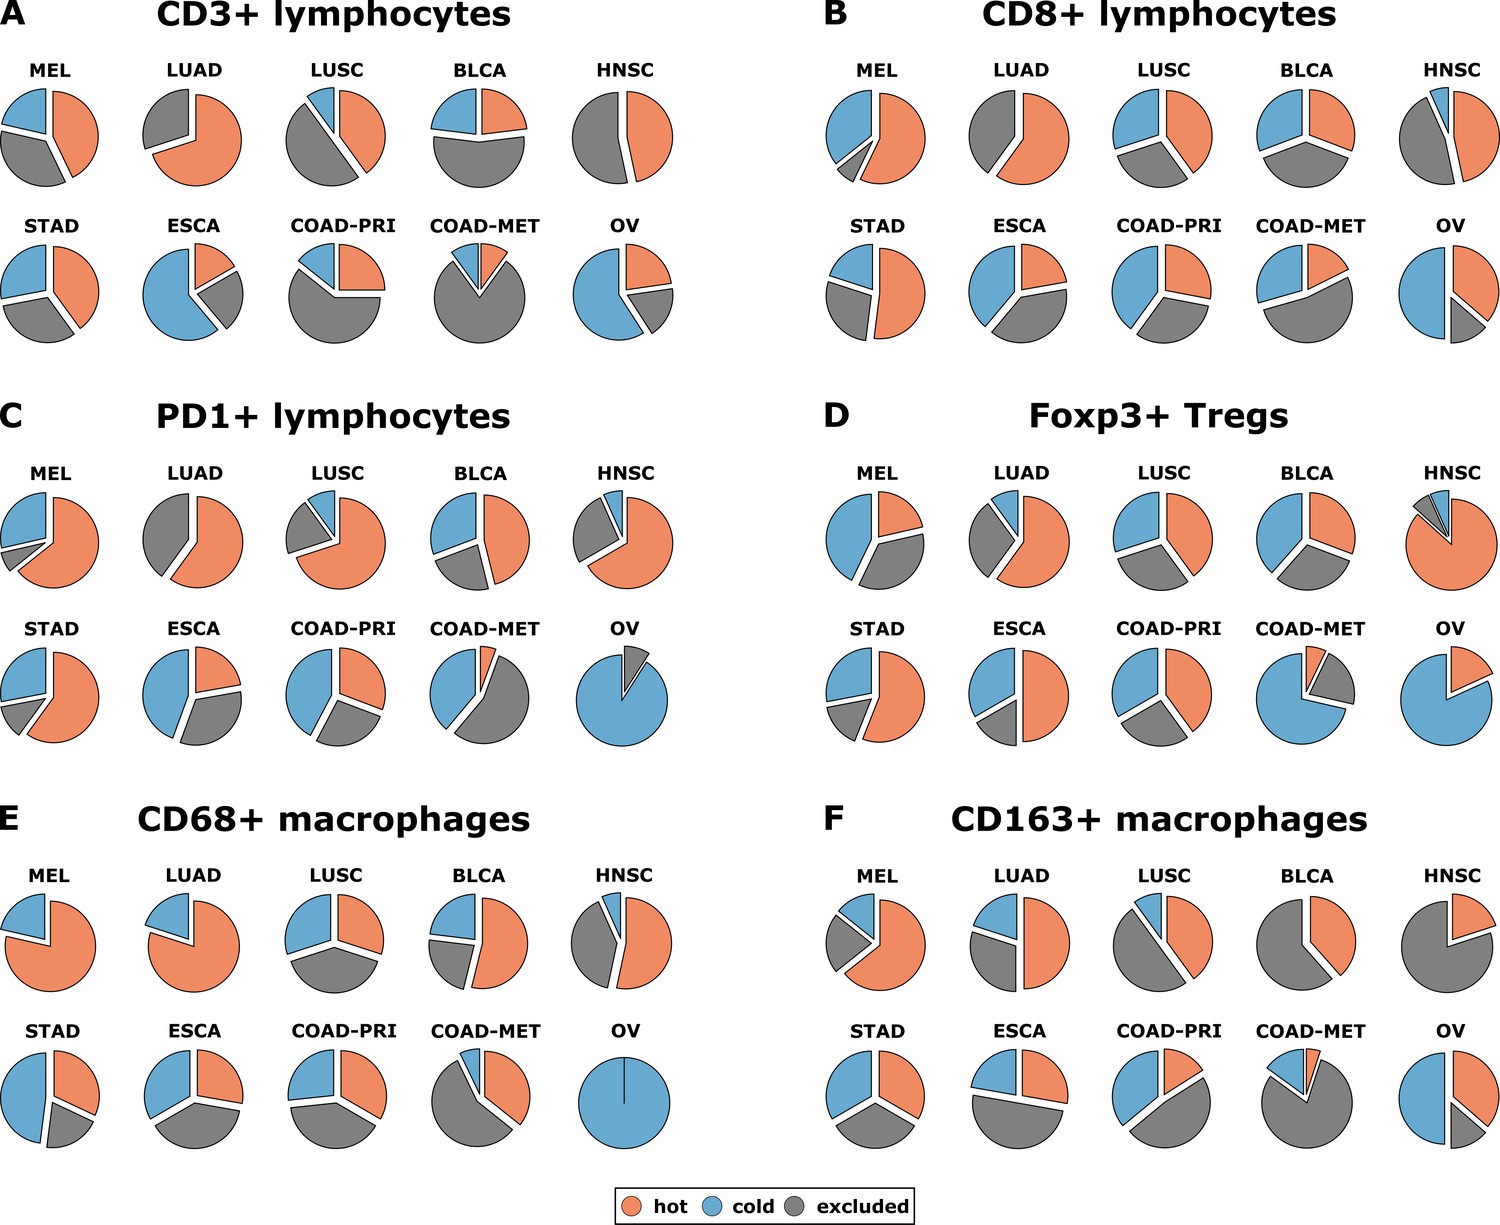
Distribution of immune topography phenotypes among different tumor types in the pan-cancer cohort.
Analysis for all six immune cell types (A–F) and for all analyzed tumor types (MEL = melanoma, LUAD = lung adeno, LUSC = lung squamous, BLCA = bladder, HNSC = head and neck squamous, STAD = stomach adeno, ESCA = esophageal squamous, COAD-PRI = colorectal primary, COAD-MET = colorectal liver metastasis, OV = ovarian). These data comprise all N = 965 tissue slides from N = 177 patients. MEL through HNSC are to some degree sensitive to approved immunotherapies and predominantly have ‘hot’ phenotypes for most immune cells. However, among these tumor types, different phenotypes for immunosuppressive immune cells (Foxp3+ regulatory T-cells [Tregs]) and CD163+ macrophages prevail.
Bivariate classification of immune topographies
Subsequently, we asked whether the topography for a given immune cell type co-occurs with the same topography for other immune cell types – or whether tumors can be ‘cold’ for one immune cell type and ‘hot’ or ‘excluded’ for another cell type at the same time. This question is important because in the clinic, immune topographies are often used as stratifying biomarkers for immunotherapy trials (Kather et al., 2018c) but it is unclear how many spatial compartments and which histological markers should be looked at.
Indeed, we saw that tumors often had different topographies for a pair of immune cell markers (Figure 4). Especially, regarding lymphocytic and myeloid markers, there was a discordance in a substantial number of cases that were lymphoid-hot and myeloid-cold (Figure 4). We further stratified this by different tumor entities (Figure 5A–E) and found pronounced differences between the tumor types. CD3 and CD8 topographies were mostly concordant (Figure 5A) as can be expected because CD8+ lymphocytes are a subset of CD3+ lymphocytes. Regarding CD8 vs. Tregs (Figure 5B), there was a notable discordance. For example, most colorectal primary tumors (COAD-PRI) that were Foxp3-excluded were CD8-cold. Analyzing tumor-associated macrophages (TAMs) labeled with CD68 (Figure 5D), we found that several melanomas (MEL) that were CD68-hot were CD8-cold which was rarely observed in other tumor types. Colorectal cancer liver metastases (COAD-MET) were mostly CD8-excluded, corresponding to a CD68-excluded or CD68-hot phenotype. This was similarly observed for CD163+ macrophages (Figure 5E). These findings suggest that tumors of different immunophenotypes require different ways of immune escape and that these mechanisms can only be distinguished when considering a two-dimensional myeloid-lymphoid classification system.
Figure 4
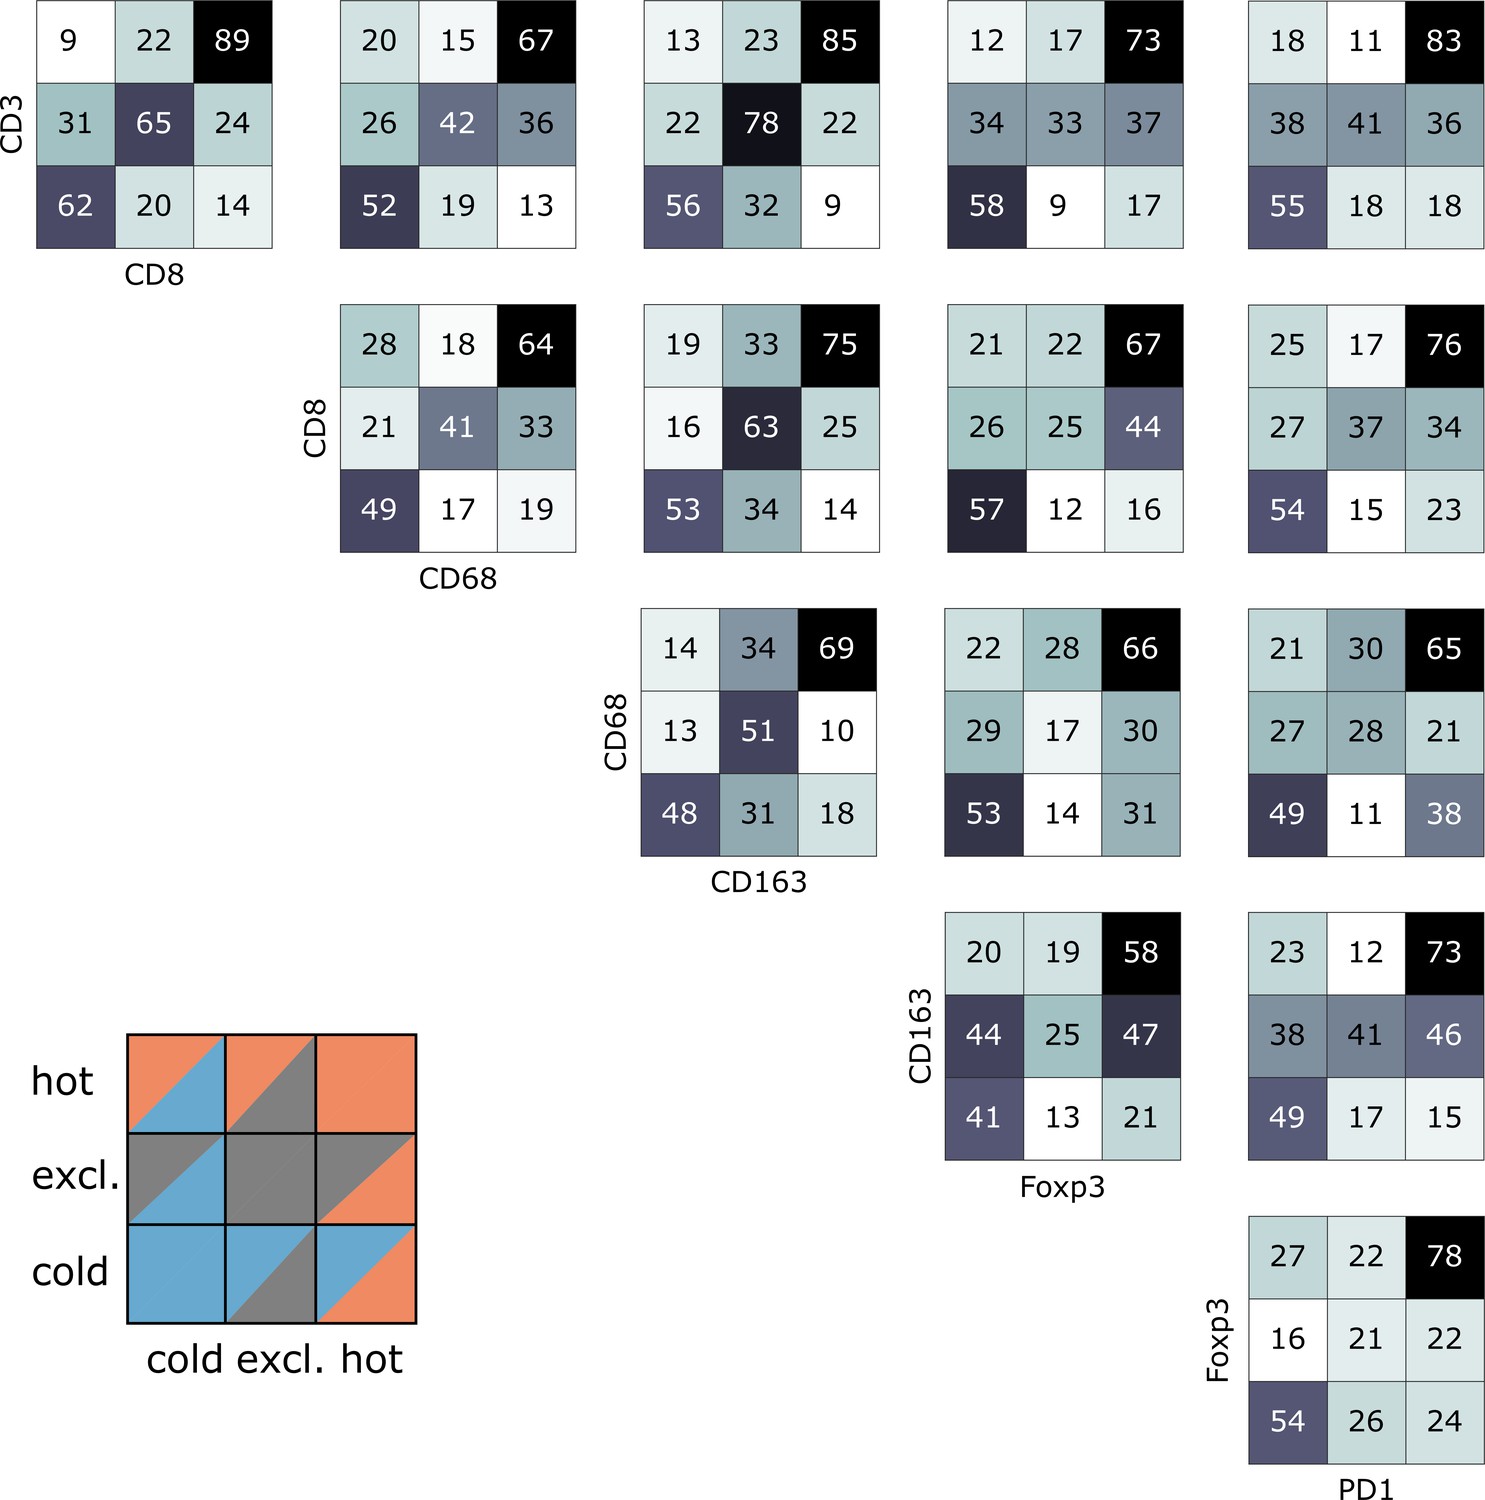
Pairwise analysis of immune phenotypes for all immune cell types in the pan-cancer cohort.
For all tissue samples in all tumor types, a pairwise classification into cold-excluded-hot was done for all immune cell types. This analysis was based on the median cutoff for high and low cell densities. Absolute numbers of tumor are given, black marks the most abundant and white the least abundant group. For some pairwise comparisons such as CD3 and CD8 cells (top left corner), there is a high concordance between the phenotypes. For other comparisons such as Foxp3 and CD163 cells, phenotypes are mostly discordant.
Figure 5
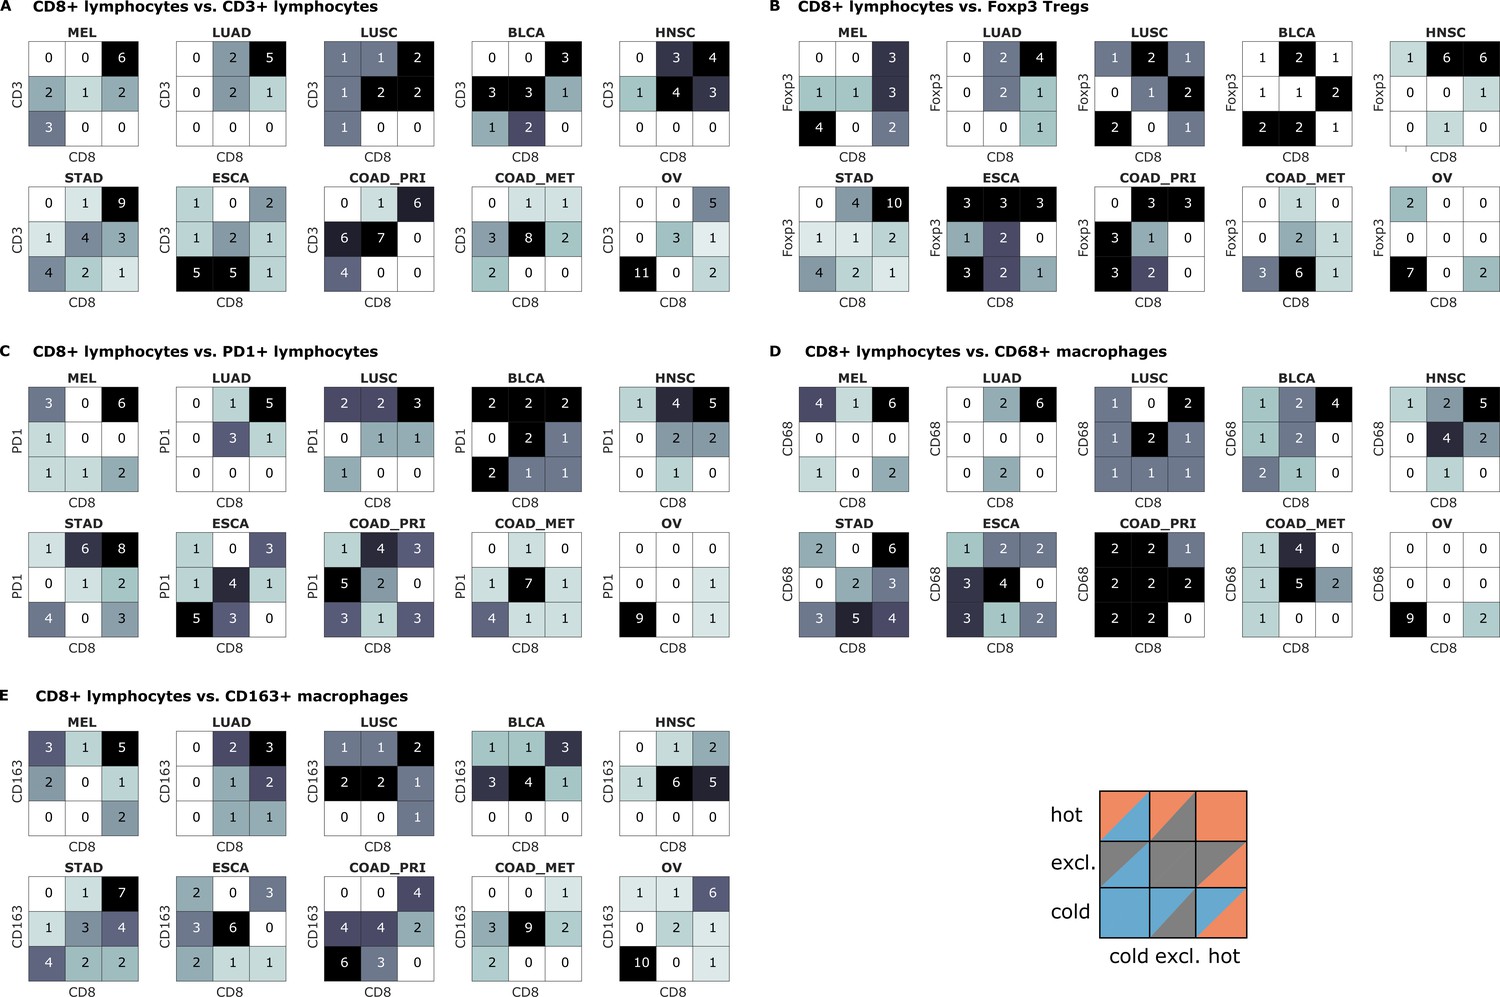
Bivariate immune phenotypes for each tumor type in the pan-cancer cohort.
We analyzed the concordance between hot-cold-excluded topographies for CD8+ lymphocytes and all other cell types for each tumor type separately. Absolute numbers of patients assigned to each of nine phenotypes are overlaid on the heat map. For some cell types and some tumor types, immune topographies are concordant. This suggests that in these settings, a detailed analysis of multiple immune cell types in biomarker studies is not necessary. On the other hand, some cell types in other tumor entities (such as CD8+ lymphocytes and CD68+ macrophages in panel (D) show a high discordance in multiple tumor types. This suggests that measuring one of these cell types only may not be informative enough for biomarker studies.
Pan-cancer similarity based on spatial immune phenotype
Using a full panel of immune cell markers (CD3, CD8, PD1, Foxp3, CD68 and CD163), we asked how similar different tumor types were in terms of immune cell spatial layout. For all 144 tumors that were stained for this full panel (Figure 6A–G, six immunostains, three compartments, 144 patients, after percentile normalization for each cell type), we used unsupervised hierarchical clustering to define similarity. We found that ovarian cancer (OV) was an outlier (Figure 6H) due to its low infiltration with almost all immune cell subsets (Figure 2—figure supplement 3). Highly immunogenic tumor types such as melanoma (MEL), stomach cancer (STAD) and non-small cell lung cancer (NSCLC: LUAD and LUSC) were close in hierarchical clustering.
Figure 6
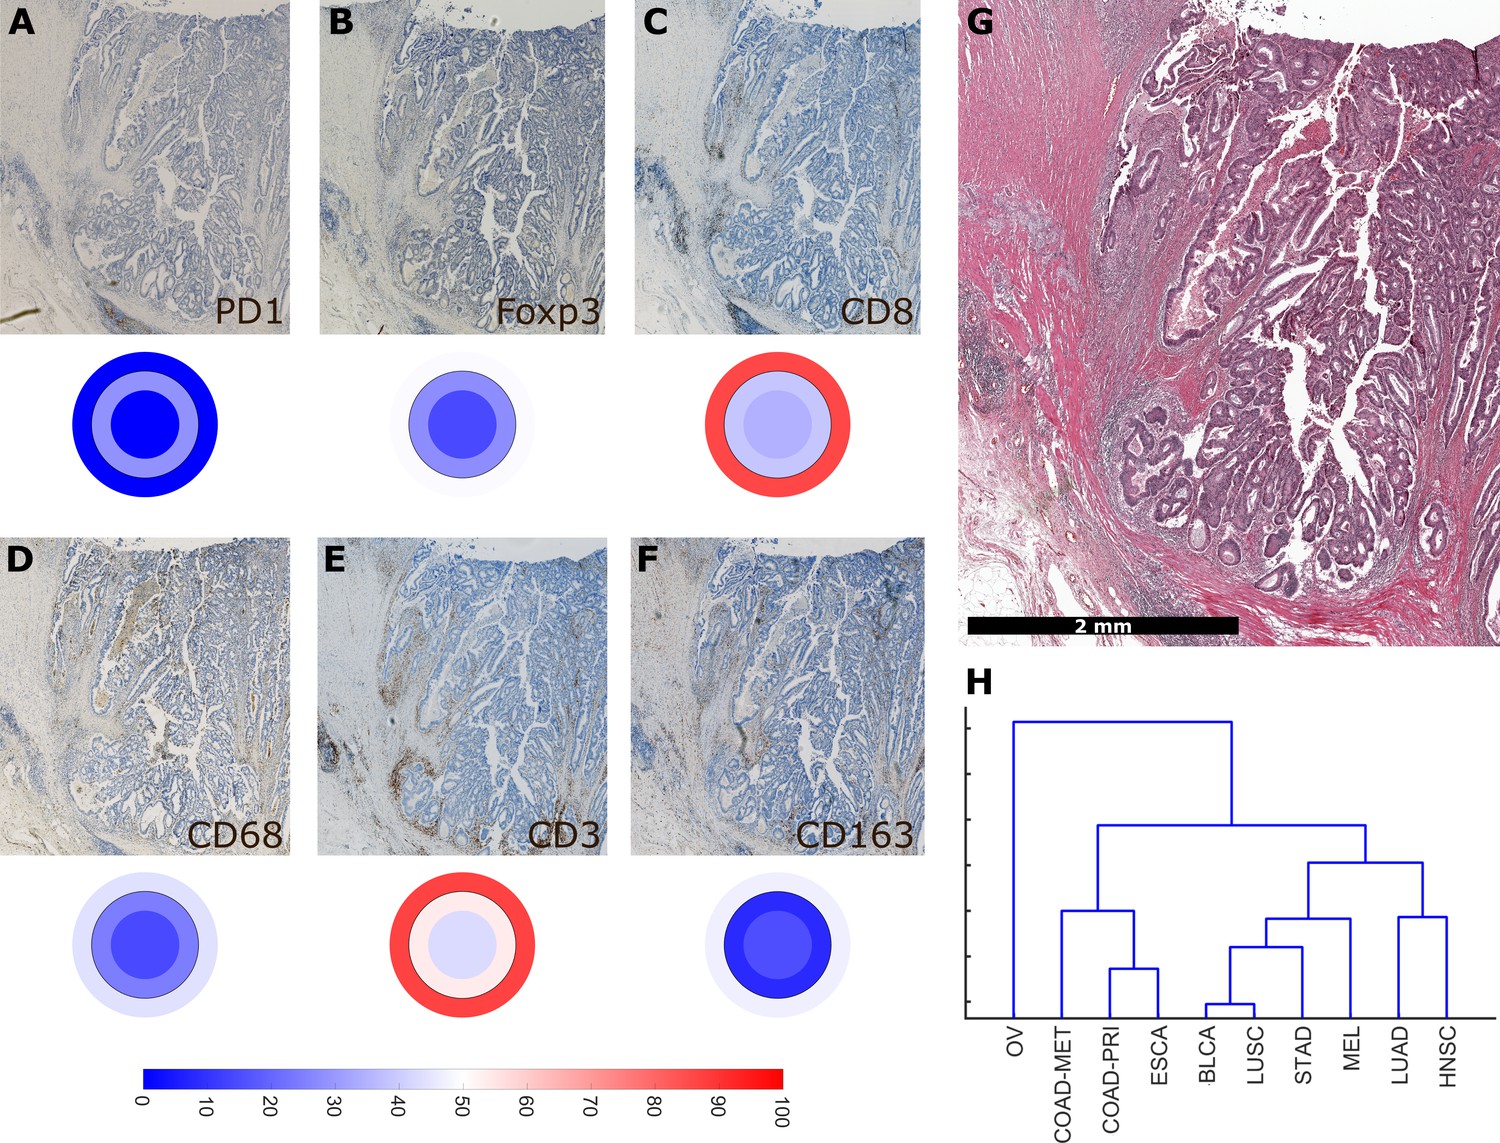
Overall similarity between tumor entities based on full immune topography.
Hierarchical clustering based on all normalized cell densities of (A) PD1+exhausted lymphocytes; (B) Foxp3+regulatory T cells; (C) CD8+cytotoxic T lymphocytes; (D) CD68+monocytes/macrophages; (E) CD3+lymphocytes and (F) CD163+pro tumor macrophages. Unit on the color scale: percentile-normalized cell density. (G) corresponding H & E image of the colorectal cancer sample used in this figure. (H) Hierarchical clustering of tumor types (N = 144 total patient samples).
Clinical utility of immune topography
Having shown that hot, cold and excluded immune patterns exist, and that these patterns vary between tumor types and immune cell types, we investigated the clinical utility of this classification system in an independent patient cohort (DACHS cohort). We analyzed the topography of CD8+ lymphocytes and CD163+ macrophages in colorectal cancer (CRC) primary tumors because these cell types have previously been linked to prognosis (Fridman et al., 2012) and showed discordant topographies in the pan-cancer cohort (COAD_PRI in Figure 5E).
We derived immune topographies for CD8 and CD163 from cell counts in the outer invasive margin and the tumor core for N = 287 patients using the median cell densities from the pan-cancer cohort as cutoff values (Figure 7A and B). As in the pan-cancer cohort, most patients were cold or immune excluded for these two cell types. The bivariate analysis showed that ‘CD8-cold, CD163-cold’ was the most prevalent category (Figure 7D).
Figure 7
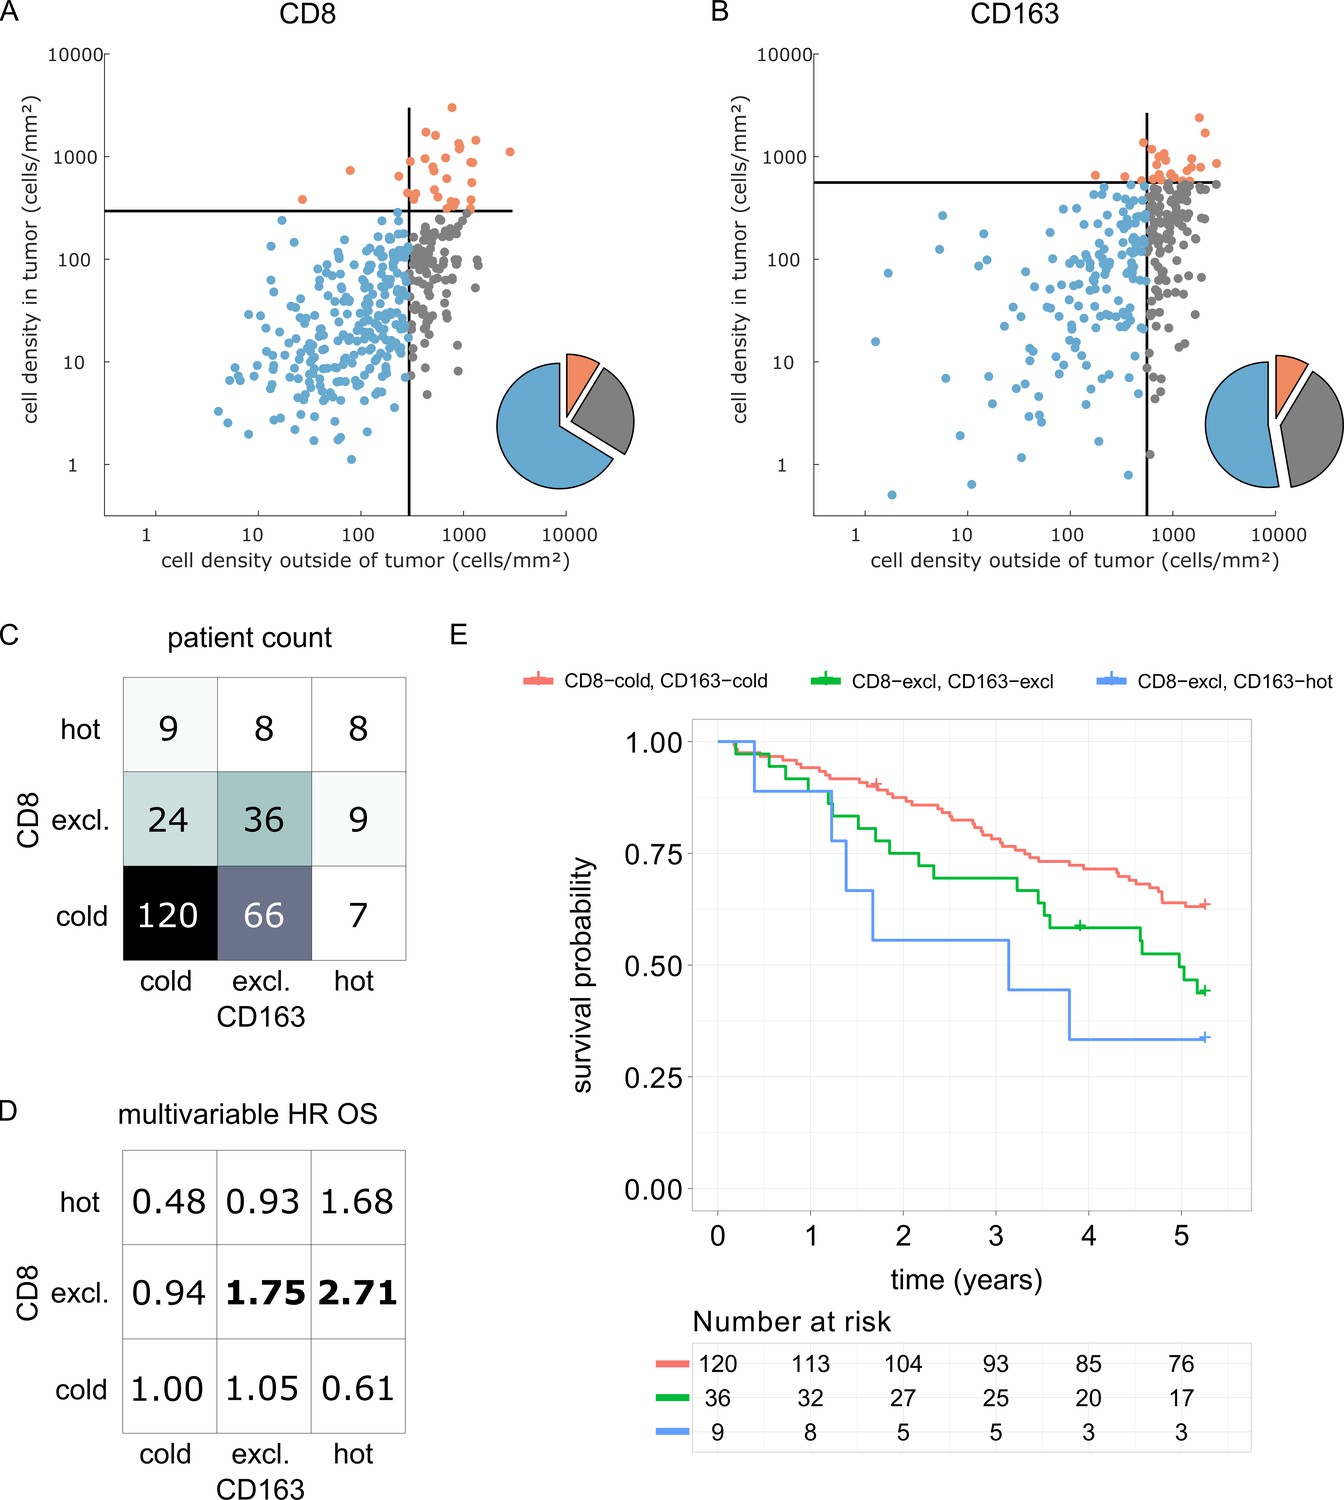
Prognostic value of the myeloid-lymphoid topography in primary colorectal cancer (CRC) in the DACHS cohort.
In a validation cohort of N = 287 colorectal cancer patients (N = 286 with follow-up data) from the DACHS study, CD8 and CD163 staining of the primary surgical sample was correlated to clinical outcome (overall survival) using the cutoffs from the pan-cancer cohort. (A) As in the CRC subgroup in the pan-cancer cohort, CD8-cold was the most prevalent phenotype, followed by CD8-excluded. (B) A similar distribution of phenotypes was observed for CD163+ macrophages. (C) In the bivariate analysis for CD8 and CD163, most patients had cold and excluded phenotypes for both antigens. (D) For each of these nine phenotypes, the hazard ratio (HR) for death of any cause (inverse overall survival, OS) was derived from a multivariable Cox proportional hazard model (covariates UICC stage, age and sex). Bold HR indicates statistically significant findings with p<0.05. Bivariate analysis of both antigens is essential for risk stratification as CD8 and CD163 phenotypes show non-trivial interaction. Raw data for panel D are shown in Supplementary file 5. (E) The Kaplan-Meier plots for the reference groups (CD8-cold CD163 cold) and the two significant groups (‘CD8-excl., CD163 excl’ and ‘CD8 excl., CD163 hot’) show significant differences in overall survival. These differences are not captured by univariate, but only by this bivariate stratification system. Log rank p-value=0.019.
We then used multivariable Cox proportional hazard models (including tumor stage, age and sex as potential confounders) to analyze the association between cell counts and cell topographies with survival. Cell densities of CD8 and CD163 in the tumor core and the outer invasive margin were not significantly correlated to overall survival (hazard ratios [HR] for death from any cause were 1.00 for both cell types in both compartments, Supplementary file 5). However, bivariate immune topographies showed significant association to overall survival: With ‘CD8-cold, CD163-cold’ as a reference cohort, the HR was 1.75 for ‘CD8-excluded, CD163 excluded’ (p=0.041) and the HR was 2.71 for ‘CD8-excluded, CD163-hot’ (p=0.025, Supplementary file 6 and Figure 7D).
Discussion
The tumor microenvironment is a highly complex, heterocellular ecosystem (Bindea et al., 2013; Tape, 2016). Multiple immune cell types are involved in this system and ultimately shift it towards a tumor-promoting or tumor-rejecting environment (Chen and Mellman, 2017; Fridman et al., 2017). Also, these immune cells determine whether a tumor will be responsive to immunotherapy (Becht et al., 2016a). However, immunotherapy outcomes vary pronouncedly between different tumor entities and also between different patients within a given entity. The biological basis for these differences has been the subject of various studies but is still not entirely clear. Most importantly, we currently lack a comprehensive classification system for multiple effector parts of the immune system.
In the present study, we have performed a large-scale systematic analysis of lymphoid and myeloid phenotypes of human solid tumors. We provide evidence for a classification of tumor-immune phenotypes into hot, cold and immune excluded spatial patterns. These patterns can be detected not only in lymphocyte infiltrates (lymphoid classification, as previously assumed by most studies) but also in macrophage infiltrates (myeloid classification). Interestingly, lymphoid and myeloid patterns are not always identical and a two-dimensional classification is needed to accommodate all possible lymphoid-myeloid phenotypes.
Addressing the biological differences and the different responses to immunotherapy across tumor entities, we systematically compared different tumor types. We analyzed ten tumor entities in the framework of this classification and showed pronounced differences, but also unexpected cross-entity similarities: We found that lymphoid-hot tumors are more prevalent in immunotherapy-responsive tumor entities such as melanoma and lung adenocarcinoma than in other entities such as colorectal cancer. Immune-excluded tumors, such as lymphoid-excluded and myeloid-excluded tumors are common in head and neck tumors (HNSC). Lastly, we show that characteristic patterns of immune evasion (via T cell exhaustion or infiltration by Tregs) are not exclusive to specific tumor-immune phenotypes but can be detected across the defined categories.
As part of this study, we present a clinical validation of the proposed classification system in the context of colorectal cancer (COAD). It has been previously shown that high density of CD8+ cells in COAD is associated with long survival (Galon et al., 2006) while high density of CD163+ cells is associated with poor survival (Fridman et al., 2012). However, some large studies have shown only a very modest impact of CD8+cell density on overall survival (Glaire et al., 2018). Likewise, in the DACHS cohort which we analyzed as part of this study, CD8+ cell density alone and CD163+ cell density alone were not clearly associated with differences in overall survival. Also, for both cell types, the immune topographies (cold, excluded, hot) were not associated with such differences. However, classifying patients according to bivariate (CD8 combined with CD163) immune topographies identified statistically significant associations to survival in a multivariable statistical model (Figure 7D). This was particularly clear for CD8-excluded tumors: in this case, CD163-cold, excluded and hot tumors had a significantly (log rank p-value 0.019) different prognosis (Figure 7E). These findings suggest that a multivariate analysis of spatial distributions of multiple immune cell types may be superior to merely quantifying a particular type of immune cells in COAD and possibly other human solid tumors.
Our study adds a systematic approach to a hitherto subjective classification of tumor-immune phenotypes. This new classification could constitute a novel framework to investigate immunotherapy responsiveness in clinical trials. Also, this classification sheds light on common immunological aspects by describing a shared immune topography across human solid tumors.
Materials and methods
Key resources table
| Reagent type (species) or resource | Designation | Source/Reference | Identifier | Additional information |
|---|---|---|---|---|
| Software, algorithm | QuPath v0.1.2 | Bankheadet al. | DOI: 10.1038/s41598-017-17204-5 | - |
| Antibody | Anti-human CD3 | Leica Novocastra | RRID:AB_563544 | Dilution 1:100 |
| Antibody | Anti-human CD8 | Leica Novocastra | RRID:AB_442068 | Dilution 1:50 |
| Antibody | Anti-human Foxp3 | eBioscience | RRID:AB_467555 | Dilution 1:100 |
| Antibody | Anti-human CD163 | BioRad | RRID:AB_2074540 | Dilution 1:500 |
| Antibody | Anti-human CD68 | Thermo Fisher Scientific | RRID:AB_720547 | Dilution 1:2000 |
| Antibody | Anti-human PD1 | Abcam | RRID:AB_881954 | Dilution 1:50 |
Ethics statement and tissue samples
Request a detailed protocolAll experiments were conducted in accordance with the Declaration of Helsinki, the International Ethical Guidelines for Biomedical Research Involving Human Subjects (CIOMS), the Belmont Report and the U.S. Common Rule. Anonymized archival tissue samples were retrieved from the tissue bank of the National Center for Tumor diseases (NCT, Heidelberg, Germany) in accordance with the regulations of the tissue bank and the approval of the ethics committee of Heidelberg University (tissue bank decision numbers 2152 and 2154, granted to NH and JNK, ovarian cancer tissues granted to SS; informed consent was obtained from all patients as part of the NCT tissue bank protocol, ethics board approval S-207/2005, renewed on 20 Dec 2017). Another set of tissue samples was provided by the pathology archive at UMM (University Medical Center Mannheim, Heidelberg University, Mannheim, Germany) after approval by the institutional ethics board (Ethics Board II at University Medical Center Mannheim, decision number 2017 – 806R-MA, granted to AM and waiving the need for informed consent for this retrospective and fully anonymized analysis of archival samples). Also, a set of melanoma samples was provided by the pathology archive at UMM after approval by the institutional ethics board (Ethics Board II at University Medical Center Mannheim, decision number 2014 – 835R-MA, granted to JU and waiving the need for informed consent for this retrospective and fully anonymized analysis of archival samples).
We analyzed tissue samples of primary esophageal carcinoma (ESCA), primary gastric cancer (STAD), primary colorectal cancer (COAD-PRI), primary lung adenocarcinoma (LUAD), primary lung squamous cell carcinoma (LUSC), primary head and neck squamous cell carcinoma (HNSC), primary bladder cancer (BLAC), ovarian cancer primary tumors (OV) as well as melanoma primary tumors (MEL) and colorectal cancer liver metastases (COAD-MET).
In addition to this pan-cancer cohort, we acquired a set of N = 287 primary surgical specimen of colorectal adenocarcinoma from the DACHS study (Hoffmeister et al., 2015; Brenner et al., 2011) which were provided by the NCT biobank under the same ethics board approval as stated above and including informed consent by all patients. Clinical data for this cohort are listed in Supplementary file 1.
Immunohistochemistry
Request a detailed protocolWe performed histological staining for CD3 (dilution 1:100 with Leica antigen retrieval ER1 solution), CD8 (1:50 with ER1), Foxp3 (1:100 with Leica antigen retrieval ER2 solution), CD163 (1:500 with ER2), CD68 (1:2000 with Leica Fast Enzyme digestion) and PD1 (1:50 with ER1) on a Leica Bond automatic staining device using a hematoxylin-diaminobenzidine (DAB) staining protocol as described previously (Halama et al., 2016). For melanoma, FastRed (Leica #DS9390) was used as a chromogen. Stained whole slide tissue sections were digitized as described previously (Halama et al., 2016). Almost all samples were stained for these six immune cell markers. In cases of insufficient tissue availability, only CD3, CD8 and CD163 staining was performed.
Image analysis
Request a detailed protocolOur image analysis pipeline was composed of several steps: First, manual annotation of three regions of interest (ROI) in each histological whole slide image (Figure 1A). The ROIs were ‘tumor core’ (TU_CORE), ‘inner invasive margin’ (MARG_500_IN) and ‘outer invasive margin’ (MARG_500_OUT). Invasive margins were 500 µm wide. Second, we automatically counted all positively stained cells using the open source software QuPath (Figure 1B) (Bankhead et al., 2017). Intensity thresholds and other parameters for cell detection and classification were set manually for each staining type and were identical for all samples in the pan-cancer cohort. All parameters are listed in Supplementary file 2. All cell detection scripts were manually checked for plausibility in all tumor entities. Examples for cell detection are shown in Figure 1—figure supplement 1. For all further analyses, cell density values were normalized by percentile within each staining type and were visualized as ‘target plots’ (Figure 1C). Staining intensity thresholds were slightly adapted for the DACHS cohort as listed in Supplementary file 2.
Reproducibility
To ensure reproducibility of our digital pathology pipeline, we randomly selected 60 tissue specimen and repeated all analysis steps. We used new tissue slides with a distance between 4 µm and 40 µm from the original slice. We stained 30 of these slides for a macrophage marker (CD163) and 30 slides for a lymphocyte marker (CD3) and a blinded observer delineated ROIs for cell quantification as before. There was a high correlation (Pearson’s correlation coefficient was >0.74, p-value<0.001) between these replicates (Figure 2—figure supplement 1).
Furthermore, two slides that served as negative controls for CD3 and CD163 staining, 231/86516 (<<0.1%) and 1/38311 (<<0.1%) cells were false positive.
Automatic determination of optimal cluster number
View detailed protocolAnalysis of all six immunostains for 177 patients in our collective yielded 965 sets of cell density counts in three spatial compartments each (2895 data points in total, missing values due to tissue availability or quality). For visualization, cell densities were subjected to percentile normalization (quantile normalization with 100 quantiles) for each staining type, across all tumor entities. For clustering and all other analyses, we used absolute cell density (cell number per mm²).
To determine the optimal number of clusters in this data set, we used three different methods for clustering: a gaussian mixture model, k-means and hierarchical clustering. For 1 up to 12 clusters, we computed three loss functions for each approach, using the Davies-Bouldin (Davies and Bouldin, 1979), the Calinski-Harabasz (CalińskiCalinski and Harabasz, 1974) or the silhouette (Rousseeuw, 1987) criteria for quality of clustering. For all optimization methods, we performed 10 technical replicates.
Implementation and data availability
Request a detailed protocolAll image analysis steps were implemented in QuPath (see key resources) and all downstream analyses were implemented in MATLAB (Mathworks, Natick, MA, USA) R2017a. All experiments were run on a standard workstation (Intel i7 Processor, 8 cores, 32 GB RAM, Microsoft Windows 10.1). We release all source codes under an open access license (Kather, 2018; copy archived at https://github.com/elifesciences-publications/immuneTopography). Also, we release all raw data from our experiments (Supplementary file 3). All survival analyses were performed in R version 3.5.1 (R-project.org) using the packages survminer, survival, ggfortify and ggplot2.
Data availability
We release all source codes under an open access license (http://dx.doi.org/10.5281/zenodo.1407435; copy archived at https://github.com/elifesciences-publications/immuneTopography). Also, we release all raw data from our experiments (Supplementary File 3).
References
-
Tailoring natural killer cell immunotherapy to the tumour microenvironmentSeminars in Immunology 31:30–36.https://doi.org/10.1016/j.smim.2017.09.001
-
Cancer immune contexture and immunotherapyCurrent Opinion in Immunology 39:7–13.https://doi.org/10.1016/j.coi.2015.11.009
-
Long-term risk of colorectal cancer after negative colonoscopyJournal of Clinical Oncology 29:3761–3767.https://doi.org/10.1200/JCO.2011.35.9307
-
A dendrite method for cluster analysisCommunications in Statistics - Theory and Methods 3:1–27.https://doi.org/10.1080/03610927408827101
-
Neutrophils in cancer: neutral no moreNature Reviews Cancer 16:431–446.https://doi.org/10.1038/nrc.2016.52
-
Natural killer cells regulate diverse T cell responsesTrends in Immunology 34:342–349.https://doi.org/10.1016/j.it.2013.03.002
-
A cluster separation measureIEEE Transactions on Pattern Analysis and Machine Intelligence PAMI-1:224–227.https://doi.org/10.1109/TPAMI.1979.4766909
-
Paradoxical roles of the immune system during cancer developmentNature Reviews Cancer 6:24–37.https://doi.org/10.1038/nrc1782
-
Cancer immunoediting: from immunosurveillance to tumor escapeNature Immunology 3:991–998.https://doi.org/10.1038/ni1102-991
-
The immune microenvironment of human tumors: general significance and clinical impactCancer Microenvironment 6:117–122.https://doi.org/10.1007/s12307-012-0124-9
-
The immune contexture in human tumours: impact on clinical outcomeNature Reviews Cancer 12:298–306.https://doi.org/10.1038/nrc3245
-
The immune contexture in cancer prognosis and treatmentNature Reviews Clinical Oncology 14:717–734.https://doi.org/10.1038/nrclinonc.2017.101
-
Classification of current anticancer immunotherapiesOncotarget 5:12472–12508.https://doi.org/10.18632/oncotarget.2998
-
Towards the introduction of the 'Immunoscore' in the classification of malignant tumoursThe Journal of Pathology 232:199–209.https://doi.org/10.1002/path.4287
-
Dendritic cells and cancer immunityTrends in Immunology 37:855–865.https://doi.org/10.1016/j.it.2016.09.006
-
Tumour-infiltrating CD8 + lymphocytes as a prognostic marker in colorectal cancer: A retrospective, pooled analysis of the QUASAR2 and VICTOR trials.Journal of Clinical Oncology : Official Journal of the American Society of Clinical Oncology 36:3515.https://doi.org/10.1200/JCO.2018.36.15_suppl.3515
-
Systems immune monitoring in cancer therapyEuropean Journal of Cancer 61:77–84.https://doi.org/10.1016/j.ejca.2016.03.085
-
Histopathological image analysis: a reviewIEEE Reviews in Biomedical Engineering 2:147–171.https://doi.org/10.1109/RBME.2009.2034865
-
Statin use and survival after colorectal cancer: the importance of comprehensive confounder adjustmentJNCI: Journal of the National Cancer Institute 107:djv045.https://doi.org/10.1093/jnci/djv045
-
Mechanisms regulating T-cell infiltration and activity in solid tumorsAnnals of Oncology 28:xii18–xii32.https://doi.org/10.1093/annonc/mdx238
-
Landscape of tumor-infiltrating T cell repertoire of human cancersNature Genetics 48:725–732.https://doi.org/10.1038/ng.3581
-
Beyond model antigens: high-dimensional methods for the analysis of antigen-specific T cellsNature Biotechnology 32:149–157.https://doi.org/10.1038/nbt.2783
-
Regulatory T cells in tumor immunityInternational Journal of Cancer 127:759–767.https://doi.org/10.1002/ijc.25429
-
Silhouettes: a graphical aid to the interpretation and validation of cluster analysisJournal of Computational and Applied Mathematics 20:53–65.https://doi.org/10.1016/0377-0427(87)90125-7
-
Immunity, inflammation, and cancer: an eternal fight between good and evilJournal of Clinical Investigation 125:3347–3355.https://doi.org/10.1172/JCI80007
-
History of myeloid-derived suppressor cellsNature reviews. Cancer 13:739–752.https://doi.org/10.1038/nrc3581
-
Systems biology analysis of heterocellular signalingTrends in Biotechnology 34:627–637.https://doi.org/10.1016/j.tibtech.2016.02.016
-
Transient expression of FOXP3 in human activated nonregulatory CD4+ T cellsEuropean Journal of Immunology 37:129–138.https://doi.org/10.1002/eji.200636435
-
Immune parameters affecting the efficacy of chemotherapeutic regimensNature Reviews Clinical Oncology 8:151–160.https://doi.org/10.1038/nrclinonc.2010.223
Article and author information
Author details
Jakob Nikolas Kather

Funding
Heidelberg School of Oncology
- Jakob Nikolas Kather
Bundesministerium für Bildung und Forschung
- Alexander Marx
The funders had no role in study design, data collection and interpretation, or the decision to submit the work for publication.
Acknowledgements
The authors would like to thank Rosa Eurich and Jana Wolf (National Center for Tumor Diseases, Heidelberg, Germany), Katrin Wolk (University Medical Center Mannheim, Mannheim, Germany) and Nina Wilhelm (NCT Biobank, National Center for Tumor diseases, Heidelberg, Germany) for expert technical assistance. The authors are grateful to the participants of the DACHS study, the cooperating clinics which recruited patients for this study, and the Institute of Pathology, University of Heidelberg, for providing tissue samples for this study.
Ethics
Human subjects: All experiments were conducted in accordance with the Declaration of Helsinki, the International Ethical Guidelines for Biomedical Research Involving Human Subjects (CIOMS), the Belmont Report and the U.S. Common Rule. Anonymized archival tissue samples were retrieved from the tissue bank of the National Center for Tumor diseases (NCT, Heidelberg, Germany) in accordance with the regulations of the tissue bank and the approval of the ethics committee of Heidelberg University (tissue bank decision numbers 2152 and 2154, granted to NH and JNK, ovarian cancer tissues granted to SS; informed consent was obtained from the patients as part of the NCT tissue bank protocol). Another set of tissue samples was provided by the pathology archive at UMM (University Medical Center Mannheim, Heidelberg University, Mannheim, Germany) after approval by the institutional ethics board (Ethics Board II at University Medical Center Mannheim, decision number 2017-806R-MA, granted to AM and waiving the need for informed consent for this retrospective and fully anonymized analysis of archival samples). Also, a set of melanoma samples was provided by the pathology archive at UMM after approval by the institutional ethics board (Ethics Board II at University Medical Center Mannheim, decision number 2014-835R-MA, granted to JU and waiving the need for informed consent for this retrospective and fully anonymized analysis of archival samples). In addition to this pan-cancer cohort, we acquired a set of N=287 primary surgical specimen of colorectal adenocarcinoma from the DACHS study which were provided by the NCT biobank under the same ethics board approval as stated above and including informed consent by all patients.
Version history
- Received: March 27, 2018
- Accepted: August 30, 2018
- Accepted Manuscript published: September 4, 2018 (version 1)
- Version of Record published: September 11, 2018 (version 2)
Copyright
© 2018, Kather et al.
This article is distributed under the terms of the Creative Commons Attribution License, which permits unrestricted use and redistribution provided that the original author and source are credited.
Metrics
-
- 9,235
- views
-
- 1,683
- downloads
-
- 184
- citations
Views, downloads and citations are aggregated across all versions of this paper published by eLife.
Download links
A two-part list of links to download the article, or parts of the article, in various formats.
Downloads (link to download the article as PDF)
Open citations (links to open the citations from this article in various online reference manager services)
Cite this article (links to download the citations from this article in formats compatible with various reference manager tools)
Topography of cancer-associated immune cells in human solid tumors
eLife 7:e36967.
https://doi.org/10.7554/eLife.36967
Further reading
-
- Cancer Biology
- Cell Biology
Rapid recovery of proteasome activity may contribute to intrinsic and acquired resistance to FDA-approved proteasome inhibitors. Previous studies have demonstrated that the expression of proteasome genes in cells treated with sub-lethal concentrations of proteasome inhibitors is upregulated by the transcription factor Nrf1 (NFE2L1), which is activated by a DDI2 protease. Here, we demonstrate that the recovery of proteasome activity is DDI2-independent and occurs before transcription of proteasomal genes is upregulated but requires protein translation. Thus, mammalian cells possess an additional DDI2 and transcription-independent pathway for the rapid recovery of proteasome activity after proteasome inhibition.
-
- Cancer Biology
- Cell Biology
Collective cell migration is fundamental for the development of organisms and in the adult, for tissue regeneration and in pathological conditions such as cancer. Migration as a coherent group requires the maintenance of cell-cell interactions, while contact inhibition of locomotion (CIL), a local repulsive force, can propel the group forward. Here we show that the cell-cell interaction molecule, N-cadherin, regulates both adhesion and repulsion processes during rat Schwann cell (SC) collective migration, which is required for peripheral nerve regeneration. However, distinct from its role in cell-cell adhesion, the repulsion process is independent of N-cadherin trans-homodimerisation and the associated adherens junction complex. Rather, the extracellular domain of N-cadherin is required to present the repulsive Slit2/Slit3 signal at the cell-surface. Inhibiting Slit2/Slit3 signalling inhibits CIL and subsequently collective Schwann cell migration, resulting in adherent, nonmigratory cell clusters. Moreover, analysis of ex vivo explants from mice following sciatic nerve injury showed that inhibition of Slit2 decreased Schwann cell collective migration and increased clustering of Schwann cells within the nerve bridge. These findings provide insight into how opposing signals can mediate collective cell migration and how CIL pathways are promising targets for inhibiting pathological cell migration.


