Article Text

Abstract
Background Interferon-α (IFN-α) plays a pivotal role in host antitumor immunity, and the evasion of IFN-α signaling pathway can lead to IFN-α resistance during the treatment of cancer. Although the interplay between IFN-α and tumor cells has been extensively investigated in differentiated tumor cells, much less attention has been directed to tumor-repopulating cells (TRCs).
Methods Three-dimentional soft fibrin matrix was used to select and grow highly malignant and tumorigenic melanoma TRCs. The regulation of integrin β3 (ITGB3)-c-SRC-STAT signaling pathway in melanoma TRCs was investigated both in vitro and in vivo. The relevant mRNA and protein expression levels were analyzed by qRT-PCR and western blot analysis. Immunoprecipitation and chromatin immunoprecipitation (ChIP) followed by qPCR (ChIP-qPCR) assays were performed to detect protein-protein and protein-DNA interactions. The clinical impacts of retinoic acid inducible gene-I (RIG-I) were assessed in melanoma datasets obtained from The Cancer Genome Atlas and Gene Expression Omnibus profiles.
Results IFN-α-induced apoptosis was decreased in melanoma TRCs. Compared with conventional flask-cultured cells, IFN-α-mediated STAT1 activation was diminished in melanoma TRCs. Decreased expression of RIG-I in melanoma TRCs led to diminished activation of STAT1 via enhancing the interaction between Src homology region 2 domain-containing phosphatase-1 and STAT1. In addition, low expression levels of RIG-I correlated with poor prognosis in patients with melanoma. STAT3 was highly phosphorylated in TRCs and knockdown of STAT3 reversed the downregulation of RIG-I in TRCs. Knockdown of STAT3 resulted in STAT1 activation and increased expression of the pro-apoptosis genes in IFN-α-treated TRCs. Combined treatment of STAT3 inhibitor and IFN-α increased the apoptosis rate of TRCs. Disruption of ITGB3/c-SRC/STAT3 signaling pathway significantly elevated the efficiency of IFN-α-induced apoptosis of TRCs.
Conclusions In melanoma TRCs, ITGB3-c-SRC-STAT3 pathway caused RIG-I repression and then affect STAT1 activation to cause resistance to IFN-α-induced apoptosis. RIG-I is a prognostic marker in patients with melanoma. Combination of STAT3 inhibitor and IFN-α could enhance the efficacy of melanoma treatment. Our findings may provide a new concept of combinatorial treatment for future immunotherapy.
- tumours
- immunology
- medicine
This is an open access article distributed in accordance with the Creative Commons Attribution Non Commercial (CC BY-NC 4.0) license, which permits others to distribute, remix, adapt, build upon this work non-commercially, and license their derivative works on different terms, provided the original work is properly cited, appropriate credit is given, any changes made indicated, and the use is non-commercial. See http://creativecommons.org/licenses/by-nc/4.0/.
Statistics from Altmetric.com
Background
Interferons (IFNs), which have been used as immune enhancers against tumors for decades, mainly exert antitumor effects via modulating the immune microenvironment through enhancing antigen-presenting cell activity or modulating T cell function.1 2 IFNs may also directly act on tumor cells inducing cellular growth arrest or apoptosis.2 3 Among IFNs, IFN-α is the most widely used in current tumor therapy to treat various kinds of tumors, such as melanoma, hepatocellular carcinoma, kidney cancer, myriad hematological malignancies and many other types of cancers.4–6 Although IFN-α has been widely used in clinical treatment and IFN-α treatment has a good outcome in some types of tumors, resistance to IFN-α usually develops.4 Specifically speaking, 80% of patients with melanoma showed intrinsic or acquired resistance toward IFN-α treatment.7 IFN-α exerts its effects via binding to IFN-α cell surface receptors and activating the downstream Janus kinase (JAK)-signal transducer and the activator of transcription (STAT) signaling cascade, usually STAT1 and STAT2 will be phosphorylated and form a heterodimer which then induces the transcription of a set of genes called IFN-stimulated genes (ISGs) that mediate the biological effects of IFN-α,3 like inducing apoptosis, cell cycle arrest or antiviral activity. Meanwhile, other members of STAT family including STAT3–6 will also be phosphorylated and activated while the biological effect remain elusive and cell type dependent.2 IFN-α signal pathway is tightly regulated mainly by Src homology phosphatase (SHP) including SHP1 or SHP2 or suppressor of cytokine signaling (SOCS) including SOCS1–3 that mainly exert biological effect via controlling the stability of important transducer in the pathway.8 Mouse models and clinical data have demonstrated that dysregulated IFN-α-JAK-STAT signaling pathway could lead to insensitivity or resistance toward IFN-α, which is mainly mediated by mutation or decreased expression of key transducers like IFNAR, STAT1 or STAT2.9–13 On the other hand, like resistance to drugs induced by tumor heterogeneity, different subpopulations of tumor cells might also play an important role in composing resistance toward immune factor, including IFN-α.14 To date, the interplay between IFN-α and tumorigenic cells that can repopulate tumors (tumor-repopulating cells (TRCs)) remain to be elucidated. Such TRCs are a self-renewing, highly tumorigenic subpopulation of cancer cells that play crucial roles in the initiation, promotion and progression of tumorigenesis.15 Previously, the highly malignant and tumorigenic TRCs have been screened and grown by culturing single cancer cells in three-dimensional (3D) soft fibrin matrices.16–18 Those TRCs grew into spheroid-like morphological shapes and resembled stem-like cells. Remarkably, as few as 10 TRCs are able to grow tumors in the lungs of immunocompetent mice after intravenous injection via the tail vein.16 These functionally defined TRCs are distinct from the cancer stem cells (CSC) that are isolated using conventional cell surface markers and are unreliable.19 20 We reasoned that elucidating the response of TRCs to IFN-α therapy and underlying mechanisms could provide effective therapeutic strategies in the clinic.
In this study, by using fibrin to select TRCs from different origin including melanoma (A375, B16), multiple myeloma (RPMI 8226) and hepatoma (HepG2), which were treated with IFN-α in clinical practice, we found TRCs exhibited resistance to IFN-α treatment. We also identified a previously unrecognized mechanism by which TRCs downregulated the expression of retinoic acid inducible gene-I (RIG-I) through an integrin β3 (ITGB3)-c-SRC-STAT3-dependent pathway. Decreased RIG-I expression may lead to diminished activation of STAT1, which subsequently attenuated the effect of IFN-α on TRCs. Specifically, disruption of ITGB3/c-SRC/STAT3 signaling sensitized cells to IFN-α, leading to apoptotic cell death of TRCs. Moreover, by using a tumor-bearing mouse model derived from B16, we also found that combining IFN-α with STAT3 or ITGB3 inhibitor could be a better treatment option in vivo.
Methods
Animals and cell lines
Female C57BL/6 mice (aged 4–6 weeks) were purchased from HFK Bio-Technology (Beijing, China). For all animal work, sample size (n=4–6) mice were randomized and included in each experimental group according to the previous experience, and all mice used were included in the analysis. Animal studies were blinded during data analysis. To build tumor-bearing mice, 1×10⁵ B16 cells were subcutaneously injected. The tumors usually grew to 5×5 mm in size around 10 days. When the tumors reached 5×5 mm in size, we started to give treatments, and the treatments were usually given consecutively and intratumorally and we calibrated the tumor size on every day since the treatment. Subcutaneous tumor growth was monitored by measuring the length (L) and width (W) of tumors using Vernier calipers, and the volume (V) of the tumor was calculated by formula V=(L×W2)/2. Mouse melanoma cancer cell lines B16 and human tumor cell lines A375 (melanoma), RPMI 8226 (multiple myeloma), HepG2 (hepatocellular cancer) and human embryonic kidney cell line HEK 293T were purchased from the China Center for Type Culture Collection (Beijing, China) and cultured in RPMI 1640 medium (Gibco, USA) with 10% fetal bovine serum (FBS) and penicillin-streptomycin.
Murine primary tumor cells isolation
B16 tumor tissue was removed from mice and cut into pieces within 1 mm3 and digested with collagenase I and IV for 1 hour. After grinding with semi-frosted slides and lysis of red blood cells, the dissociated cells were filtered with 70 μm cell strainer and spun down at 100 g for 1 min and then incubated for 1 hour to get rid of adhesive cells that were mainly made up by monocytes. The suspended cells were collected, spun down at 500 g for 3 min and stained with anti-CD45 and anti-CD133 or anti-ITGB3 antibody at room temperature for 30 min. After washing, these cells were filtered through a 40 µm cell strainer to obtain single cell suspension and were further analyzed on flow cytometer (BD Biosciences, San Jose, California, USA).
Three-dimensional fibrin gel cell culture of tumor cells
TRC culture was performed according to our previously described method.16 In brief, fibrinogen was dissolved with distilled water at 0°C–4°C overnight and was further aliquoted once completely dissolved. To make the 3D culture mixture, fibrinogen was diluted into 2 mg/mL with T7 buffer (pH 7.4, 50 mM Tris, 150 mM NaCl). Then the diluted fibrinogen solution was mixed with an equal volume of cell suspension and to be cooled on ice. Then the precooled mixture of fibrinogen and cell solution was seeded into a precooled 24-well plate with 5 µL thrombin (0.1 U/µL) to catalyze the fibrinogen to form very homogenous 3D fibrin gels and the total volume of fibrin and cell mixture per well is around 250 μL. After 30 min of incubation at 37°C, these cells were supplemented with 1 mL completed culture medium. For collecting cells for further analysis, first, we removed the culture medium from the culture well, then we minced the gel with the tips on the pipette and added 500 µL/well dispase II (1 U/mL) with calcium for digestion. Then we put the 24-well plate into incubator and digested in 37°C for 10 min. Next, we terminated the digestion by adding equal volume fresh 10% FBS 1640 medium and spun down the cell at 500 g for 5 min. The cell pellet can be used for further analysis.
Plasmids and reagents
Human RIG-I complementary DNA (cDNA) was purchased from Sino-Biological; the cDNA was amplified and clone into viral vector Plvx-IRES-Puro (Clontech). The clustered regularly interspaced short palindromic repeats (CRISPR)-related plasmid PX458 and lentivirus packaging plasmids Pspax2 and PMD2.G were purchased from Addgene. Fibrinogen and thrombin were purchased from Searun Holdings. Methotrexate (MTX) and paclitaxel (PAX) were purchased from Selleck. STAT3 inhibitor Stattic, c-SRC inhibitor dasatinib and ITGB3 inhibitor cilengitide were purchased from MedChemExpress. Puromycin and Lipofectamine 2000 were purchased from Invitrogen (California, USA). Murine and human IFNA were purchased from Novoprotein. Polybrene, collagenase I and collagenase IV were purchased from Sigma.
Lentivirus packaging and stable cell line construction
Stable RIG-I expressing cell lines were generated by lentiviral transduction and selected by antibiotics. Briefly, Pspax2, pVSV-G and constructed Plvx-IRES-Puro or empty vector were transfected into HEK 293 T cells using Lipofectamine 2000 transfection reagent. The supernatants containing viruses were added in A375 cells with multiplicity of infection (MOI) at 5:1 and with the concentration of Polybrene at 5 μg/mL and the infection lasted for 12 hours. Twenty-four hours after infection, puromycin was added to A375 cells and the cells were treated with concentration at 2 μg/mL. The treatment lasted for 3 days and the cells were kept in puromycin in half of the concentration for stable selection.
Construction of CRISPR stable knockout cell line
To construct stable RIG-I knockout A375 or B16 cell lines, A375 or B16 cells were transfected with PX458 that was constructed by SGRNA targeting human and murine RIG-I or green fluorescent protein (GFP). The following primers were used to construct: SGGFP, CACCGGGGCGAGGAGCTGTTCACCG (sense) and AAACCGGTGAACAGCTC CTCGCCCC (antisense); human RIG-I-SGRNA1, CACCGCAGGATGTAGGTAGGGTCCA (sense) and AAACTGGACCCTACCTACATCCTGC (antisense); human RIG-I-SGRNA2, CACCGCATGGCCCCCTGGTTTAGGG (sense) and AAACCCCTAAACCAGGGGGCCATGC (antisense); murine RIG-I-SGRNA1, CACCGCGAGCCAGGAACTCATGTAG (sense) and AAACCTACATGAGTTCCTGGCTCGC (antisense); murine RIG-I-SGRNA2, CACCGGCCAGGAACTCATGTAGCTG (sense) and AAACCAGCTACATGAGTTCCTGGCC (antisense). Twenty-four hours after the cells were transfected with the indicated plasmid, GFP-positive cells were isolated via flow cytometry, then the GFP-positive cells were seeded in 96-well to conduct colony selection. After 2 weeks, the colonies were identified via western blot analysis and the stable knockout cells were kept for further analysis.
RNA interference
TRCs were collected from fibrin gel and seeded onto dishes precoated with fibrin gels. After attachment, cells were transfected with small interfering RNA (siRNA) using Lipofectamine 2000 (Invitrogen) following the guidance of the manufacturer. Twelve hours later, the transfected cells were trypsinized, collected and seeded in the 3D fibrin gel. siRNA for the genes in the text were: STAT3:siRNA1: UCACAUGCCACUUUGGUGUdTdT; siRNA2: CUUCAGACCCGUCAACAAAdTdT. Both the gene silence RNAs and the corresponding scramble control oligonucleotides were purchased from RiboBio, and the knockdown efficiency was checked by real-time PCR.
RT-qPCR
Total RNA was extracted from cells using TRIzol (Invitrogen) and was transcribed to cDNA by using a high-capacity cDNA reverse transcription kit (Applied Biosystems, California, USA). Real-time PCR was performed using ABI StepOnePlus (Applied Biosystems, Massachusetts, USA). Values are mean±SEM from three independent experiments which were performed in duplicate. Statistical comparisons among groups were performed using two-tailed Student’s t-test to analyze the differences. Values of all parameters were considered statistically significant difference at a value of p<0.05. The sequences for all the primers are provided in online supplementary table S1.
Supplemental material
Chromatin immunoprecipitation followed by qPCR
Chromatin immunoprecipitation (ChIP) followed by qPCR (ChIP-qPCR) was performed by using MAGnify Chromatin Immunoprecipitation System (Invitrogen) according to the manufacturer’s protocol. In brief, cells were collected and fixed. Chromatin was crosslinked, extracted and sheared. Immunoprecipitation was performed by using anti-STAT1 (Cell Signaling Technology) and the primer sequences used for ChIP-qPCR are provided as followings: Human PML, GGCTGCGTGTGGCTCATCT (sense) and AGGAAGTGAGACAGAAGCTGGG (antisense); Murine PML, TGACTACTTCCCAAACTGGCTCT (sense) and TCCTCTTTGAGAGAGCCTCCCA (antisense); Human TRAIL, CCATTGCACCACTGCACTCCA (sense) and ACCCTCAGATTCAGGACCCAG (antisense); Murine TRAIL, TCAGAGCGCTGGATCTAGGCT (sense) and GCAGCCCAGCAGCAGTGC (antisense); Human OAS1, GGCTGCTTGTTGCTGGCTAA (sense) and TGGCAACAGAACTGCCTCCC (antisense); Murine OAS1, GCCTGTACTTCACCCTTGG (sense) and GAACAGCACCTCCCCAGG (antisense). The results were from three independent experiments followed by normalization to input signals and showed as mean±SEM.
Western blot analysis
The whole cell lysates were derived from RIPA lyzed cells which were sonicated. The cytosol and nuclear fraction samples were derived from cells collected, lyzed and separated different components according to the cytonuclear fraction kit from Beyotime (China). The protein concentrations were determined by the BCA kit (Beyotime). Then, the protein was run on an SDS-PAGE gel and transferred to nitrocellulose. Nitrocellulose membranes were blocked in 5% bovine serum albumin (BSA) and probed with antibodies overnight: anti-β-actin, F-caspase 3, F-caspase 7, caspase 7, caspase 3, Histone 3, RIG-I, P-SRC, SRC, P-JAK1, JAK1SHP1, SHP2, PIAS1, SOCS1, P-STAT3, P-STAT1, STAT1, STAT2 and STAT3 were purchased from Cell Signaling Technology; P-STAT2 was purchased from Abcam; P-TYK2 and TYK2 were purchased from Invitrogen. Secondary antibodies conjugated to horseradish peroxidase were followed by enhanced chemiluminescence (Thermo Fisher Scientific, Waltham, Massachusetts, USA). Results were confirmed by at least three independent experiments.
Immunofluorescence
Collected cells were spun down onto a coverslip, fixed in 4% paraformaldehyde and permeabilized with 0.2% Triton X-100. Fixed cells were blocked in 5% BSA and probed with anti-STAT1 (Cell Signaling Technology) antibody in 5% BSA, followed by Alexa Fluor 594-conjugated chicken anti-rabbit (Invitrogen) and the slides were further counterstained with 4′,6-diamidino-2-phenylindole (DAPI) and mounted for confocal analysis and the fluorescent image was observed under a two-photon fluorescent microscope.
Cell apoptosis assay
Cell apoptosis was detected by using the annexin V–APC Apoptosis Kit (BD Biosciences). Briefly, cells were stained with annexin V–fluorescein isothiocyanate and 7-aminoactinomycin D (7-AAD) according to the manufacturer’s instruction. After incubation in the dark for 15 min at room temperature, stained cells were then analyzed by flow cytometer (BD Biosciences).
Statistics analysis
All experiments were performed at least three times. Results are expressed as mean±SEM and analyzed by two-tailed Student’s t-test. The p value <0.05 was considered to be statistically significant. All data meet the assumptions of the tests. The analysis was conducted using the GraphPad V.6.0 software.
Results
TRCs exhibit resistance to IFN-α treatment
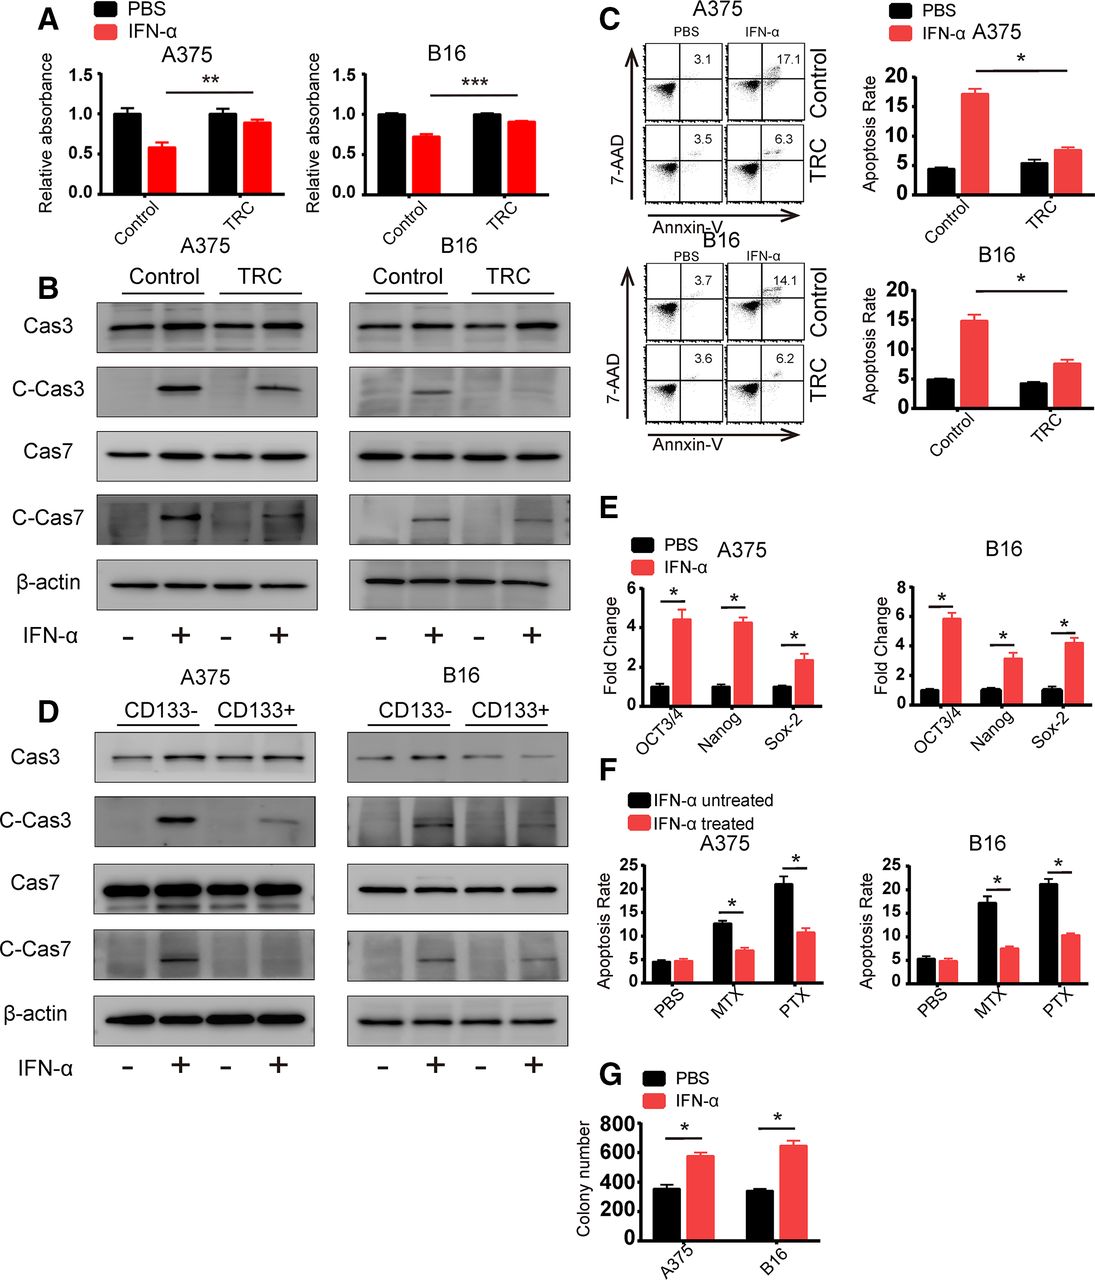
Previous studies have demonstrated that different populations of heterogeneous tumor cells respond differently to chemotherapy or cytokines.14 21 So, we hypothesized that TRCs play an important role in mediating IFN-α resistance. To test this hypothesis, we analyzed the inhibition rate of IFN-α on murine B16 melanoma TRCs and human A375 melanoma TRCs via MTT assay. As expected, we found that IFN-α showed greater inhibition effect on flask-cultured normal cells compared with TRCs (figure 1A). To further explore the mechanism of insensitivity of TRC to IFN-α, we detected apoptosis as well as cell cycle changes after IFN-α treatment. We found that IFN-α induced much less apoptosis in TRCs than control melanoma cells (figure 1B,C). Although IFN-α could induce slight cell cycle arrest, the changes showed no differences between TRCs and flask-cultured cells (online supplementary figure S1a). These results indicated that the different effect of IFN-α on TRCs and flask-cultured cells was mainly due to changes in apoptosis-related pathway. We also observed similar phenomenon in the HepG2 human hepatocellular cancer cell line and the RPMI 8226 human multiple myeloma cell line (online supplementary figure S1b,c). To further confirm that stem cell-like tumor cells respond insensitively toward IFN-α than more differentiated tumor cells, we used a well-recognized stem cell marker, CD133. CD133-positive and CD133-negative tumor cells from B16 and A375 cells were isolated by flow cytometry and treated with IFN-α. After 24 hours, we analyzed apoptosis by western blot analysis and found that CD133-positive A375 cells showed less apoptosis than their CD133-negative counterparts (figure 1D). These results indicated that TRCs (or stem cell-like tumor cells) are resistant to IFN-α-induced apoptosis. To further confirm this finding, we determined the response of bulk B16 and A375 tumor cells to IFN-α. We found that B16 and A375 tumor cells treated with IFN-α exhibited increased expression of the stem cell-related key transcription factors (Oct3/4, Nanog and Sox-2) and increased resistance to the chemotherapeutic drugs MTX and PAX (figure 1E,F). Moreover, treatment of B16 and A375 tumor cells with IFN-α resulted in an increase in the number of spheroids of TRCs (figure 1G). To exclude the possibility that IFN-α might directly induce increased stemness in melanoma cells, we treated the TRCs with IFN-α and analyzed the expression of stem cell-related genes and performed spheres formation assay. We found that IFN-α treatment did not induce upregulation in these stem cell-related genes nor did any changes in spheres formation assay (online supplementary figure S1d,e). This expected result might be due to the apoptosis of differentiated tumor cells, resulting in more TRCs enrichment in the population. Taken together, these data suggest that TRCs exhibit resistance to IFN-α treatment.

Tumor-repopulating cells (TRCs) exhibit resistance to interferon-α (IFN-α) treatment. (A) B16 or A375 cells were seeded by 2×10⁴ cells/well in fibrin three-dimensional (3D) culture and 2×10⁴ cells/well in 24-well plate. After 24 hours, we treated the cells with IFN-α and the treatment lasted for 48 hours and we trypsinized the 24-well cultured cells and isolated the 3D culture cells. Then the isolated cells were seeded in 96-well plate and 2 hours later MTT assay was conducted. (B) B16 TRCs and A375 TRCs were treated with 1000 U/mL human recombinant IFN-α or 200 ng/mL murine recombinant IFN-α for 48 hours. Cell lysates were collected, and caspase 3, caspase 7 and their cleaved forms were analyzed by immunoblotting. Flask-cultured tumor cells were used as control. (C) B16 TRCs and A375 TRCs were treated with 1000 U/mL human recombinant IFN-α or 200 ng/mL murine recombinant IFN-α for 48 hours. Cells were isolated, stained with annexin V and 7-AAD and analyzed by flow cytometry. Flask-cultured tumor cells were used as control. Columns indicate three independent replicate experiments. (D) Isolated CD133 high and CD133 low A375 and B16 cells were treated with 1000 U/mL human recombinant IFN-α or 200 ng/mL murine recombinant IFN-α for 48 hours. Cell lysates were collected, and caspase 3, caspase 7 and their cleaved forms were analyzed by immunoblotting. (E) A375 and B16 cells were treated with 1000 U/mL human recombinant IFN-α or 200 ng/mL murine recombinant IFN-α for 48 hours. Total RNA was extracted and reverse transcribed, and gene expression was analyzed by RT-qPCR. (F) A375 and B16 cells were treated with 1000 U/mL human recombinant IFN-α or 200 ng/mL murine recombinant IFN-α for 48 hours. Apoptotic cells were washed away, and the remaining cells were treated with methotrexate (5 µg/mL) or paclitaxel (1 µM) for 24 hours. The cells were then isolated, stained with annexin V and 7-AAD and analyzed by flow cytometry. Columns indicate three independent replicate experiments. (G) A375 and B16 cells were treated with 1000 U/mL human recombinant IFN-α or 200 ng/mL murine recombinant IFN-α for 48 hours and seeded into 3D fibrin gel. The colony numbers were counted after 3 days. The data shown are representative of three independent experiments and represent the mean±SEM (indicated by error bars). *P<0.05, **p<0.01,***p<0.001.
STAT1 activation is hampered in TRCs treated with IFN-α
Next, we sought to discover the mechanism mediating the resistance of TRCs toward IFN-α. As previously reported, IFN-α exerts its effects through the induction of ISGs, among which tumor necrosis factor-related apoptosis-inducing ligand (TRAIL), promyelocytic leukemia (PML) and 2’5’A oligoadenylate synthetase 1 (OAS1) can lead to apoptosis.2 To that end, we analyzed the expression of these apoptosis-related genes in different time points after IFN-α treatment and found that IFN-α induced these genes expression in as early as 2 hours, meanwhile, we also found that B16 or A375 TRCs showed decreased expression of all these genes, in all time points we tested, compared with control cells (figure 2A). This decrease in expression was also observed in HepG2 and RPMI 8226 cells (online supplementary figure S2a), which is consistent with previous results. Expression of ISGs stimulated by IFN-α is mainly induced through the IFNAR-JAK-STAT pathway, which contains mainly IFNAR, JAK1, TYK2, STAT1 and STAT2.3 Decreased expression or diminished activation of these genes hampers IFN-α signal transduction and influences the expression of ISGs. We analyzed the expression of IFNAR, JAK1, TYK2, STAT1 and STAT2 as well as the activation of JAK1, TYK2, STAT1 and STAT2 in TRCs by flow cytometry and western blot analysis and found no significant difference in protein levels or the activation of JAK1, TYK2 and STAT2 between TRCs and control tumor cells (online supplementary figure S1b,c). However, activation of STAT1 was diminished in TRCs compared with bulk tumor cells (figure 2B). Activation of the transcription factor STAT1 is mediated by its phosphorylation, which promotes the nuclear translocation and enhanced transcription of downstream genes. We therefore treated TRCs and their counterparts with IFN-α for 24 hours and analyzed the distribution of STAT1 in cells by immunofluorescence and also treated the cells with IFN-α for several early time point for nuclear-cytosol fractionation, these results showed that nuclear translocation was largely hampered in TRCs (figure 2C,D), which is consistent with previous results. To further confirm that STAT1 directly influences the expression of apoptosis-related genes, we analyzed the binding of STAT1 to TRAIL, PML and OAS1 promoter by ChIP-qPCR. STAT1 binding was largely diminished in TRCs compared with that in control tumor cells (figure 2E). Taken together, these data suggested that STAT1 activation is diminished in TRCs and mediates resistance to IFN-α treatment.

STAT1 activation is inhibited in tumor-repopulating cells (TRCs) following interferon-α (IFN-α) treatment. (A) A375 TRCs and B16 TRCs were treated with 1000 U/mL human recombinant IFN-α or 200 ng/mL murine recombinant IFN-α for 2 hours, 4 hours or 6 hours. Total RNA was extracted and reverse transcribed, and gene expression was analyzed by RT-qPCR with specific primers for promyelocytic leukemia (PML), tumor necrosis factor-related apoptosis-inducing ligand (TRAIL) and 2’5’A oligoadenylate synthetase 1 (OAS1). Untreated Flask-cultured tumor cells were used as control to be normalized. (B) A375 TRCs and B16 TRCs were treated with 1000 U/mL human recombinant IFN-α or 200 ng/mL murine recombinant IFN-α for 15 min, 30 min or 1 hour. Cell lysates were collected and analyzed by immunoblotting. Flask-cultured tumor cells were used as control. (C) A375 TRCs and B16 TRCs were treated with 1000 U/mL human recombinant IFN-α or 200 ng/mL murine recombinant IFN-α for 12 hours, isolated, spun and attached to slides. The cells were fixed, stained with the indicated antibody and assessed by confocal microscopy. Scale bar: 10 µm.60 cells per group were randomly selected for nuclear fluorescence analyzing. (D) A375 TRCs and B16 TRCs were treated with 1000 U/mL human recombinant IFN-α or 200 ng/mL murine recombinant IFN-α for 15 min,30min or 1 hour, and their nuclear components were isolated and analyzed by immunoblotting. Flask-cultured tumor cells were used as control. (E) A375 TRCs and B16 TRCs were treated with 1000 U/mL human recombinant IFN-α or 200 ng/mL murine recombinant IFN-α for 24 hours. Cells were collected for ChIP-qPCR with anti-STAT1 antibody and specific primers for PML, TRAIL and OAS1. Flask-cultured tumor cells were used as control. The data shown are representative of three independent experiments and represent the mean±SE (indicated by error bars). *P<0.05, **p<0.01,***p<0.001.
Diminished activation of STAT1 is mediated by the downregulation of RIG-I
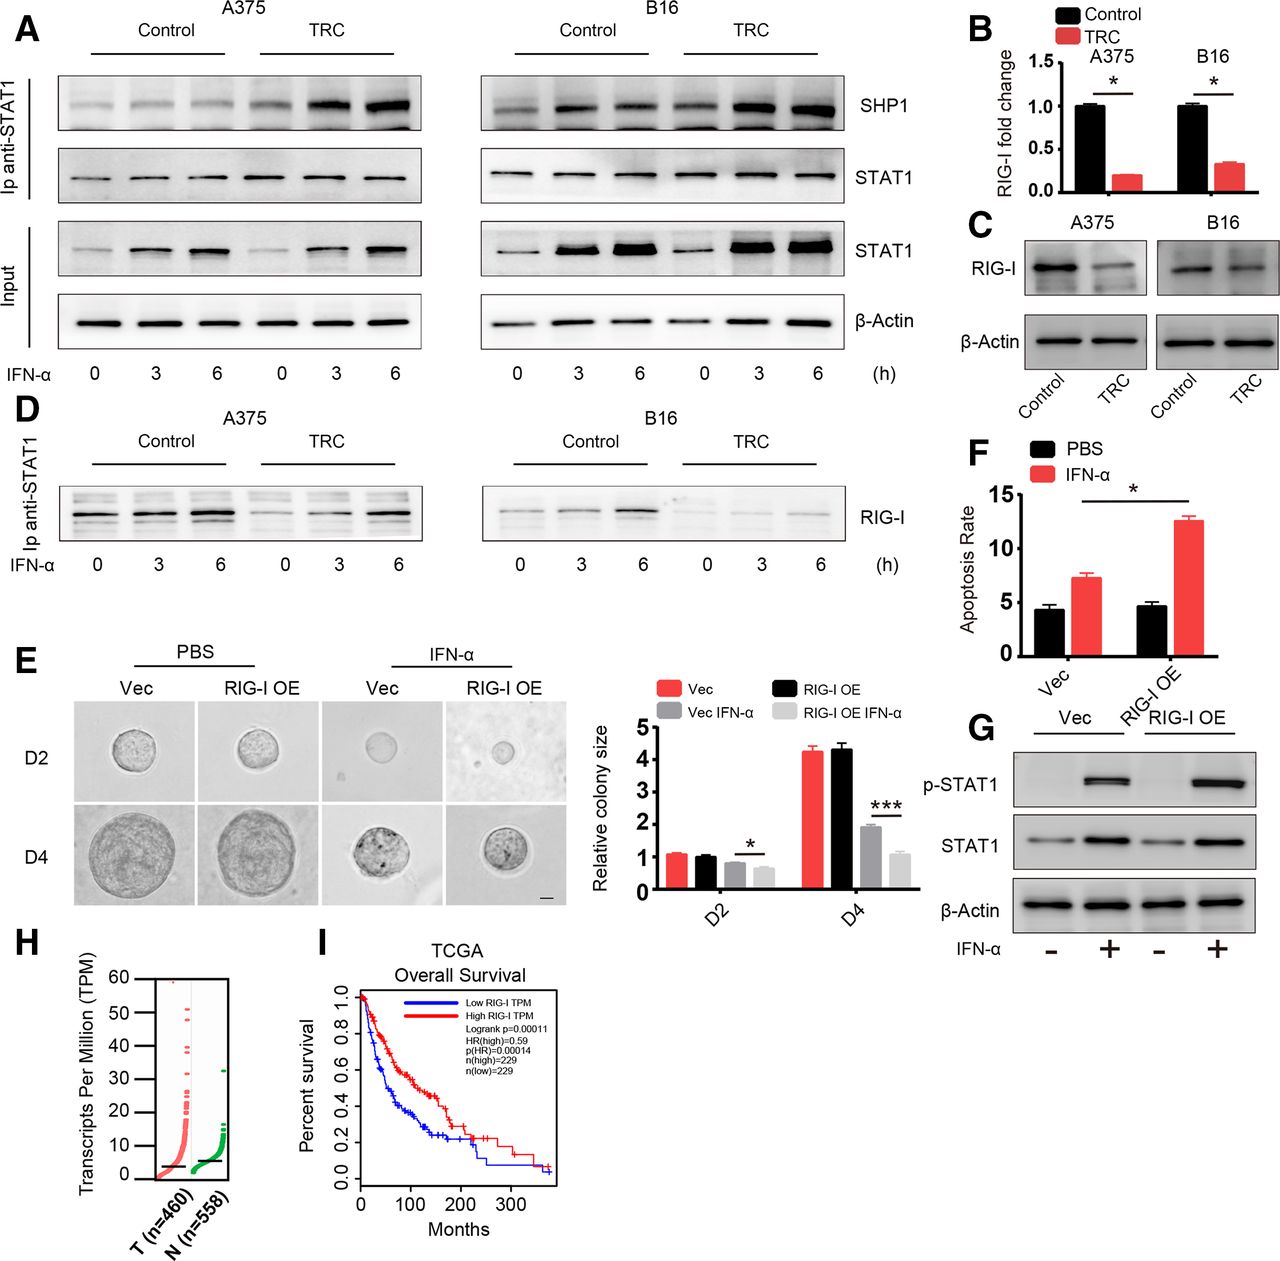
Next, we sought to uncover the mechanism behind the diminished activation of STAT1. Activation of STAT1 is induced by STAT1 phosphorylation mediated by TYK2 and JAK1, which can be inhibited by negative regulators of the JAK-STAT signaling pathway including SHP1, SHP2, SOCS1 and PIAS1.8 We screened the expression of these negative regulators via western blot analysis and found no difference between their levels in TRCs and control melanoma cells (online supplementary figure S3a). These negative regulators exert their effects through directly interacting with STAT1 and inducing its dephosphorylation. Therefore, we assessed the binding between STAT1 and these three negative regulatory genes via immunoprecipitation. SHP1 binding with STAT1 was significantly enhanced in TRCs with and without IFN-α treatment in different time points (figure 3A), while SHP2, SOCS1 and PIAS1 binding was no different (online supplementary figure S3b). Previous studies have reported that the binding of SHP1 and STAT1 can be influenced by PARK7 and RIG-I.22 23 We next determined the expression of genes that can influence the interaction between SHP1 and STAT1 via RT-PCR and found that PARK7 expression was no different between TRCs and control tumor cells, while RIG-I expression was significantly lower in TRCs (figure 3B,C and online supplementary figure S3c). Previous studies have reported that RIG-I plays an important role in diminishing the interaction between SHP1 and STAT1, which is consistent with our results, and we also confirmed that RIG-I and STAT1 interact with each other with or without IFN-α via immunoprecipitation (figure 3D). To further confirm the role of RIG-I, an ISG, in TRCs, we constructed a RIG-I-overexpressing A375 cell line with lentivirus as well as RIG-I KO B16 and A375 cell lines by the CRISPR technique (online supplementary figure S3d,e). Then, we seeded vector control cells (Vec) and RIG-I-overexpressing cells into 3D gels and treated them with IFN-α for 48 hours. Compared with Vec cells, RIG-I-overexpressing TRCs grew much smaller colonies (figure 3E) and showed enhanced apoptosis (figure 3F), which is consistent with previous results. To further confirm this RIG-I-mediated effect, we treated control cells (SG-GFP) and RIG-I KO tumor cells culture in rigid dish with IFN-α and found that RIG-I KO cells showed diminished apoptosis compared with control cells (online supplementary figure S3f). Furthermore, we evaluated the activation status of STAT1 in RIG-I-overexpressing and Vec TRCs and found that activation of STAT1 was enhanced in RIG-I-overexpressing TRCs (figure 3G). Then, we analyzed the expression of these apoptosis-related genes. As expected, expression of the TRAIL, PML and OAS1 genes was enhanced in RIG-I-overexpressing tumor cells (online supplementary figure S3g). Furthermore, RIG-I expression, indicated by TCGA was lower in melanoma tumor tissue than in adjacent normal tissue (figure 3H). Meanwhile, through gene profile and clinical data by TCGA and another two studies,24–27 we found that higher expression of RIG-I was correlated with better survival in patients with melanoma (figure 3H and online supplementary figure S3h). Taken together, these data suggested that TRCs inhibit STAT1 activation and mediate resistance to IFN-α through downregulated RIG-I expression and that RIG-I is a prognostic marker in patients with melanoma.

Diminished activation of STAT1 is mediated by the downregulation of retinoic acid inducible gene-I (RIG-I). (A) A375 TRCs and B16 TRCs were treated with 1000 U/mL human recombinant interferon-α (IFN-α) or 200 ng/mL murine recombinant IFN-α for 3 or 6 hours. Cell lysates were collected for immunoprecipitation with anti-STAT1 antibody, and protein interactions were analyzed by immunoblotting with the indicated antibodies. Flask-cultured tumor cells were used as control. (B) Total RNA from tumor-repopulating cells (TRCs) of A375 or B16 and flask-cultured control tumor cells was extracted and RIG-I expression was analyzed by RT-qPCR. (C) Cell lysates from TRCs of A375 or B16 and flask-cultured control tumor cells were analyzed by immunoblotting with anti-RIG-I antibody. (D)Same batch of samples collected and immunoprecipitated in panel A were further analyzed by immunoblot with RIG-I antibody. (E) A375 RIG-I-overexpressing cells (RIG-I-OE) and vector control cells (Vec) were seeded in three-dimensional (3D) fibrin gel, and after 2 days, the cells were treated with IFN-α for another 4 days. The colonies size were analyzed. Scale bar: 25 µm. (F) TRCs of RIG-I-OE and Vec were treated with 1000 U/mL human recombinant IFN-α for 48 hours. The apoptosis of the cells were analyzed. (G) TRCs of RIG-I-OE and Vec were treated with 1000 U/mL human recombinant IFN-α for 6 hours, and cell lysates were collected and analyzed by western blot analysis. (H) RIG-I expression in human melanoma tissues (558 normal adjacent tissues and 460 tumor specimens) from the The Cancer Genome Atlas (TCGA). The data were derived from the public Gene Expression Profiling Interactive Analysis (GEPIA) data portal (http:// gepia.cancer-pku.cn/). (I) Correlation between RIG-I expression and melanoma patient survival. Clinical data from the NIH TCGA were analyzed via Kaplan-Meier survival analysis. The data shown are representative of three independent experiments and represent the mean±SEM (indicated by error bars). *P<0.05, ***p<0.001.
Enhanced activation of STAT3 in TRCs leads to the downregulation of RIG-I
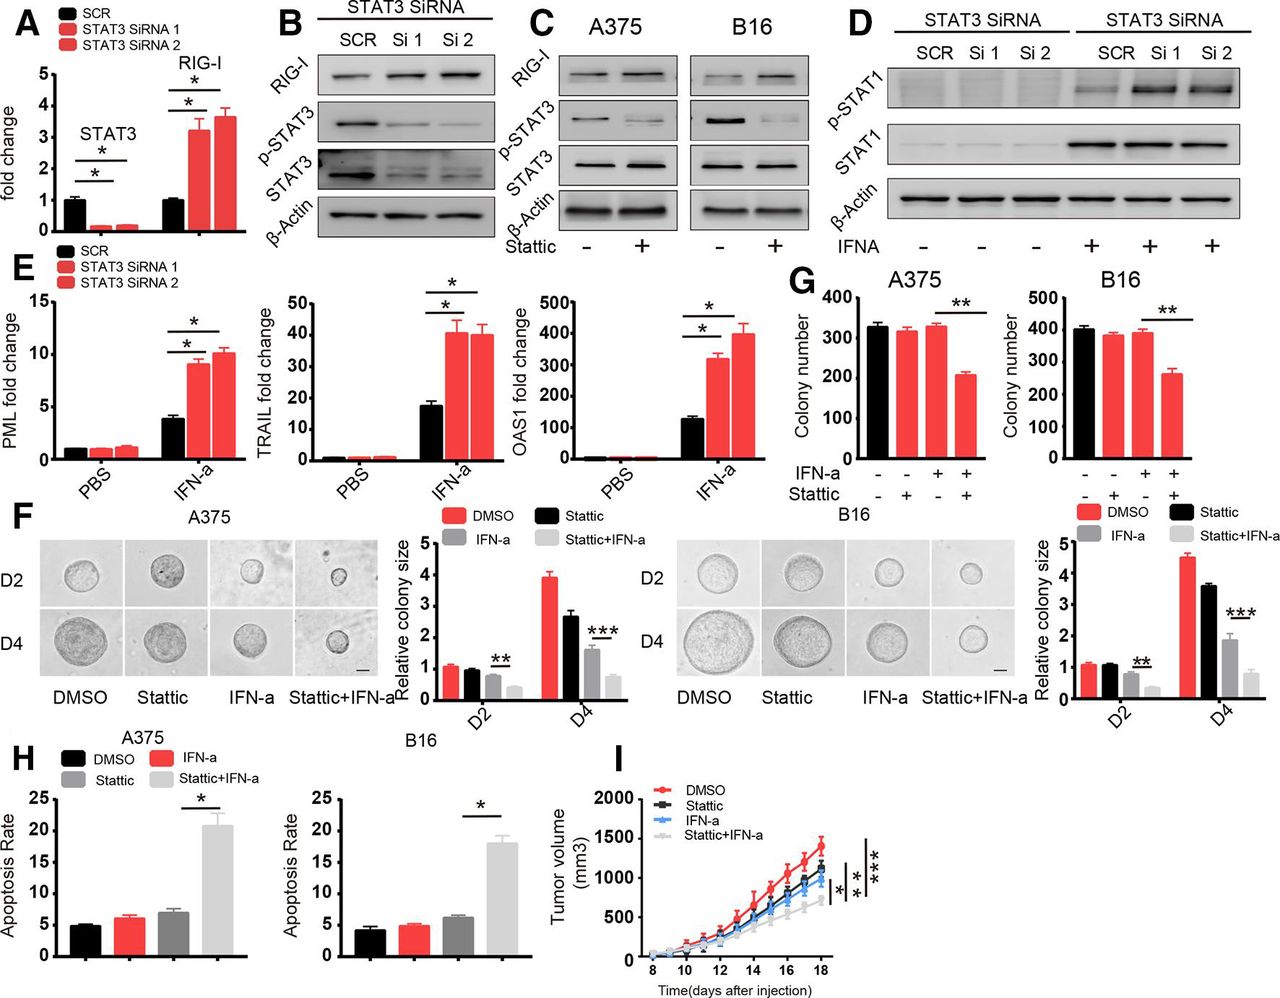
Next, we sought to discover the mechanism underlying RIG-I regulation. RIG-I is an RNA sensor in the innate immune system and is downregulated in TRCs via a transcription-based mechanism. It has been shown that STAT3-mediated signaling pathway modulated immune response to IFNs in TRCs.28 We therefore hypothesized that STAT3 signaling pathway play a role in regulating RIG-I expression. We found that STAT3 was highly phosphorylated in TRCs compared with control cells and knockdown of STAT3 reversed the downregulation of RIG-I in TRCs (figure 4A,B and online supplementary figure S4a). We further confirmed this effect of STAT3 through the STAT3 inhibitor stattic (figure 4C). Furthermore, we also found enhanced STAT1 activation and increased expression of the apoptosis-related genes OAS1, PML and TRAIL, in TRCs in which STAT3 was knocked down that were treated with IFN-α (figure 4D,E), and this effect was verified via treatment with the STAT3 inhibitor (online supplementary figure S4b,c). Consistent with this finding, combined treatment with the STAT3 inhibitor and IFN-α decreased colony size and colony number and enhanced apoptosis in TRCs compared with treatment with IFN-α alone (figure 4F–H). To investigate whether STAT3 inhibition can synergistically enhance the efficacy of IFN-α treatment in vivo, we subcutaneously injected B16 cells into the flanks of C57BL/6 mice. When melanoma tumors were palpable (3×3 mm), we intratumorally administered treatment. After 14 days of treatment, we found that STAT3 inhibition together with IFN-α treatment was more efficacious than either treatment alone (figure 4I). Previous literature has also demonstrated that STAT3 plays an important role in counteracting IFN-α antiviral and antitumor effects, and our data provide a novel mechanism by which STAT3 and the RIG-I pathway mediate this effect. Taken together, these data suggest that RIG-I expression is regulated by STAT3 and that combination treatment with IFN-α and a STAT3 inhibitor can further enhance TRC apoptosis.

Enhanced activation of STAT3 in tumor-repopulating cells (TRCs) leads to the downregulation of retinoic acid inducible gene-I (RIG-I). (A, B) A375 cells were transfected with Scramble and STAT3 small interfering RNA (siRNA). After 24 hours, the cells were seeded into fibrin. (A) After 72 hours, the expression of STAT3 and RIG-I were analyzed by RT-qPCR. (b) Cell lysates were extracted and analyzed via immunoblotting with the indicated antibodies. (C) A375 TRCs and B16 TRCs were treated with stattic (1 µM) for 18 hours. Cell lysates were extracted and analyzed by immunoblotting with the indicated antibodies. (D) A375 cells were transfected with Scramble and STAT3 siRNA. After 24 hours, the cells were seeded into fibrin gel and cultured for 72 hours to select TRCs. Then, the TRCs were treated with 1000 U/mL human recombinant interferon-α (IFN-α) for 6 hours, and cell lysates were extracted and analyzed by immunoblotting. (E) A375 cells were transfected with Scramble and STAT3 siRNA. After 24 hours, the cells were seeded into fibrin gel and cultured for 72 hours to select TRCs. Then, the TRCs were treated with 1000 U/mL human recombinant IFN-α for 24 hours. The expression of promyelocytic leukemia (PML), tumor necrosis factor-related apoptosis-inducing ligand (TRAIL) and 2’5’A oligoadenylate synthetase 1 (OAS1) were analyzed by RT-qPCR. (F, G) A375 and B16 cells were seeded in fibrin, and after 48 hours, the cells were treated with stattic (1 µM), IFN-α (1000 U/mL for A375 cells, 200 ng/mL for B16 cells) or both for 96 hours (F). The size of the colonies was determined. Scale bar: 25 µm. (G) The number of colonies were counted at 96 hours. (H) A375 TRCs and B16 TRCs were pretreated with stattic (1 µM) for 12 hours and then treated with human recombinant IFN-α (1000 U/mL) and murine recombinant IFN-α (200 ng/mL) for 24 hours. The apoptosis was analyzed. (I) Mice (n=6) were subcutaneously inoculated with 1×10⁵ B16 cells. When tumors grew to be 5×5 mm in size, the mice were given DMSO, stattic (5 mg/kg), IFN-α (10 µg/kg) or stattic/IFN-α for 5 days. Tumor volumes were measured. The data shown are representative of three independent experiments and represent the mean±SEM (indicated by error bars). *P<0.05, **p<0.01, ***p<0.001.
The integrin β3-SRC pathway leads to enhanced STAT3 activation and decreased RIG-I
Next, we sought to uncover the mechanism by which STAT3 activation is enhanced. Previous studies have reported that STAT3 can be activated via kinases such as JAK or c-SRC29 30 and that the JAK-STAT3 pathways are mediated mainly by IL6 family members such as IL6, IL11, LIF or GM-SCF secreted by myeloid cells or other immune cells rarely derived from epithelial cancer cells.29 However, IL6 is also secreted by epithelial tumor cells and promotes tumor progression via the activation of STAT3.31 Therefore, we assessed the expression of IL6 and the activation of c-SRC in TRCs and flask-cultured cells; IL6 was barely expressed in A375 or B16 cells, and there was no difference in IL6 levels between TRCs and control cells (online supplementary figure S5a). The activation of c-SRC was enhanced in TRCs compared with control cells (figure 5A). Furthermore, we determined the effect of SRC on STAT3 activation via treating TRCs with the c-SRC inhibitor dasatinib; the activation of STAT3 was diminished by c-SRC inhibition as well as enhanced RIG-I expression verified via RT-PCR and western blot analysis (figure 5B and online supplementary figure S5b). Furthermore, we tested STAT1 activation under c-SRC inhibition conditions, and as expected, the inhibition of c-SRC could enhance STAT1 activation and increase the expression of apoptosis-related genes (figure 5C and online supplementary figure S5c). Consistent with this finding, we also found that colony size and number were decreased, and the apoptosis of TRCs was enhanced by the combination of IFN-α and a c-SRC inhibitor (figure 5D and online supplementary figure S5d,e). We further explored the mechanism of STAT3 activation in TRCs. TRCs were generated from soft fibrin, which is a ligand of ITGB3 that can lead to ITGB3 clustering and activate downstream signaling. ITGB3 also plays an important role in promoting and maintaining tumor cell stemness.32 Previous studies have reported that ITGB3 clustering can induce the accumulation of c-SRC at the cytoplasmic tail of ITGB3, leading to auto-phosphorylation and the activation of c-SRC.33 Therefore, we treated TRCs with the ITGB3 inhibitor cilengitide and found that the inhibition of ITGB3 led to decreased activation of c-SRC and STAT3 as well as the increased expression of RIG-I (figure 5E and online supplementary figure S5f). Consistent with this finding, the activation of STAT1 and the expression of apoptosis-related genes were enhanced via the inhibition of ITGB3, as shown by western blot analysis and RT-PCR (figure 5F and online supplementary figure S5g). We also found that treating TRCs with IFN-α combined with an ITGB3 inhibitor further decreased the size and number of TRC colonies while increasing TRC apoptosis (figure 5G and online supplementary figure S5h,i). To further confirm the synergistic effect of combination with IFN-α and cilengitide, we sorted ITGB3-negative and ITGB3-positive cells or ITGB3-high and ITGB3-low cells via flow cytometry (online supplementary figure S5j), and treated the cells with IFN-α, cilengitide or combined. We found that IFN-α could induce more apoptosis and enhanced activation of STAT1 in ITGB3-negative or ITGB3-low cells, while the combination of cilengitide was more effective in ITGB3-positive or ITGB3-high cells (online supplementary figure S5k–m). Next, we sought to observe this effect of ITGB3 in vivo. To confirm this effect of ITGB3 in vivo, we treated B16 tumor-bearing mice with IFN-α and found that IFN-α treatment led to increased number of ITGB3-high cells (figure 5H,I), and the ITGB3-high subpopulation might confer insensitivity to IFN-α treatment among the tumor mass. Therefore, we further treated B16-bearing mice with IFN-α, ITGB3 inhibitor or both and analyzed the efficacy by analyzing apoptosis via flow cytometry and calibration of tumor mass. We found that combination treatment largely increased apoptosis rates in ITGB3-high tumor cells (figure 5J), and the efficacy of tumor sequestration compared with that following treatment with either moiety alone (figure 5K). Taken together, these data suggest that ITGB3 can be activated by the extracellular matrix, induce c-SRC activation and mediate enhanced STAT3 activation, leading to TRC resistance to IFN-α treatment.
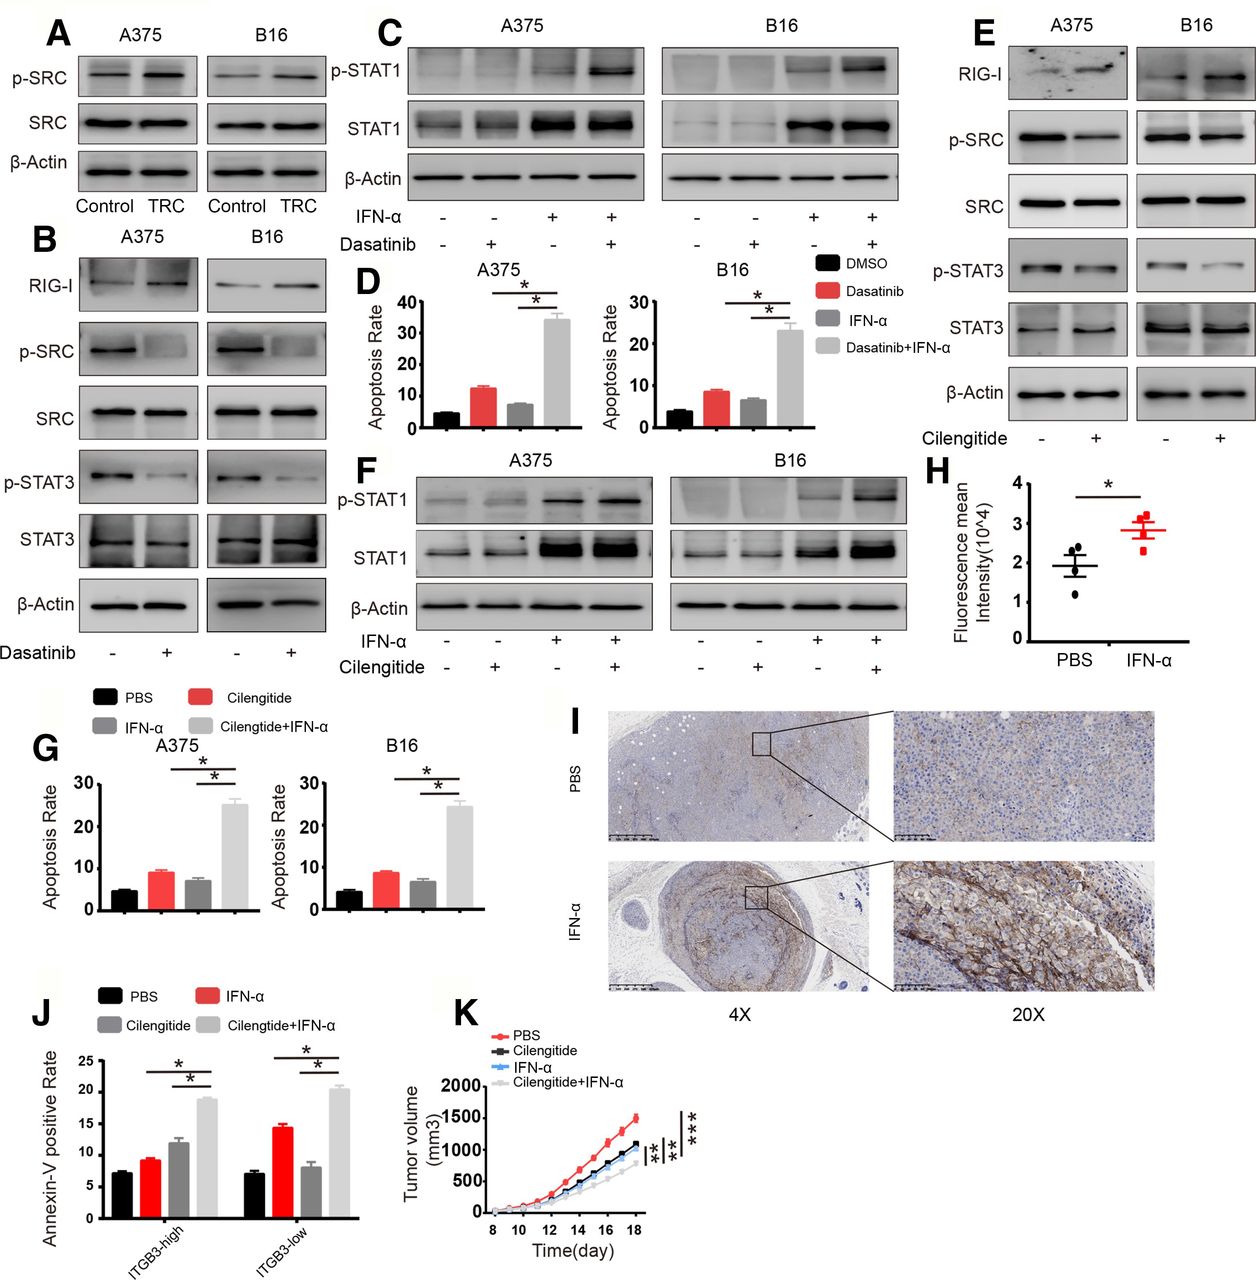
The integrin β3 (ITGB3)-SRC pathway leads to enhanced STAT3 activation and decreased retinoic acid inducible gene-I (RIG-I) levels. (A) Cell lysates from A375 tumor-repopulating cells (TRCs) and B16 TRCs were extracted and analyzed via immunoblotting with the indicated antibodies. (B) A375 TRCs and B16 TRCs were treated with dasatinib (1 µM) for 12 hours, and cell lysates were extracted and analyzed via immunoblotting with the indicated antibodies. (C, D) A375 TRCs and B16 TRCs were pretreated with dasatinib (1 µM) for 12 hours and then treated with 1000 U/mL human recombinant interferon-α (IFN-α) or 200 ng/mL murine recombinant IFN-α for different time points. (C) Cell lysates were extracted (6 hours) and analyzed via immunoblotting with the indicated antibodies. (d)The apoptosis of the cells was analyzed (24 hours). (E) A375 TRCs and B16 TRCs were treated with cilengitide (1 µM) for 12 hours, and cell lysates were extracted and analyzed via immunoblotting with the indicated antibodies. (F, G) A375 TRCs and B16 TRCs were pretreated with cilengitide (1 µM) for 12 hours. Then, the cells were treated with 1000 U/mL human recombinant IFN-α or 200 ng/mL murine recombinant IFN-α for different time points. (F) Cell lysates were extracted (6 hours) and analyzed via immunoblotting with the indicated antibodies. (G) The apoptosis of the cells was anaylzed (24 hours). (H) C57BL/6 mice (n=4) with B16 cell tumors 5×5 mm in size were treated with IFN-α (10 µg/kg) once per day for 3 days. The tumors were digested, and the ITGB3 intensity in CD45-negative cells was analyzed by flow cytometry. (I) Mice (n=4) were subcutaneously inoculated with 1×10⁵ B16 cells. When the tumors were 5×5 mm in size, the mice were given phosphate buffered saline (PBS) or IFN-α (10 µg/kg) on every 2 days for 6 days, then the mice were executed and the tumors were collected, fixed and immunohistochemistry staining was conducted for ITGB3. Representative images were selected. (J) Mice (n=4) were subcutaneously inoculated with 1×10⁵ B16 cells. When the tumors were 5×5 mm in size, the mice were given PBS, cilengitide (10 mg/kg), IFN-α (10 µg/kg) or cilengitide/IFN-α for 3 days. Then the mice were executed and the tumors were collected, digested. Single cell suspension was used for flow cytometry analysis. Cells were stained with CD45, ITGB3 and annexin V and were analyzed by gating CD45 negative. (K) Mice (n=6) were subcutaneously inoculated with 1×10⁵ B16 cells. When the tumors were 5×5 mm in size, the mice were given PBS, cilengitide (10 mg/kg), IFN-α (10 µg/kg) or cilengitide/IFN-α for 5 days. Tumor volumes were measured. The data shown are representative of three independent experiments and represent the mean±SEM. Differences in the results of animal experiments on each day were statistically analyzed. *P<0.05, **p<0.01, ***p<0.001.
Discussion
Escape from immune surveillance is an intrinsic characteristic of tumors, and resistance to IFNs and the loss of downstream signal functioning in tumor cells have been postulated as some of the main mechanisms of this escape. Recent studies on the elements and mechanisms that determine the response and prognosis following immune checkpoint inhibition have revealed that the integrity of IFNs and their downstream signaling pathways in tumor cells are critical factors that determine the treatment outcome. Here, we show that the inhibition of ITGB3 and downstream SRC and STAT3 activation can sensitize TRCs to the effects of IFN-α and enhance the overall efficacy of tumor treatment; this strategy may be another unrecognized mechanism by which tumor cells acquire resistance to IFNs and immune system surveillance.
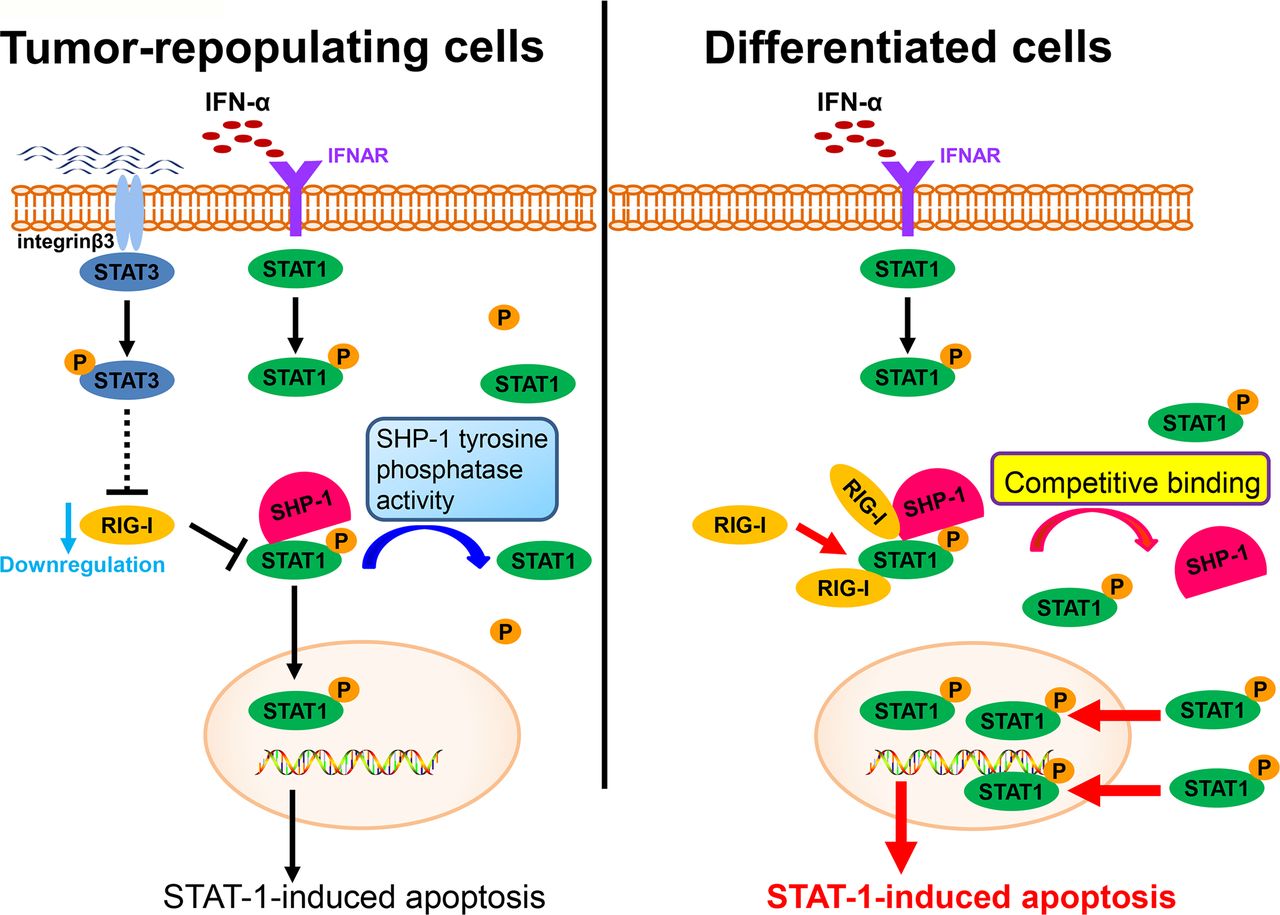
RIG-I, an intracellular viral RNA sensor, participates in inducing the innate antiviral response.34 Type I IFNs can also be induced by RIG-I. Recent studies have also reported that RIG-I participates in host antitumor responses to various tumors.35 In this study, we found that RIG-I is downregulated in TRCs, mediates immune escape from the effector cytokine IFN-α and contributes to enhancing resistance to IFN-α treatment (figure 6). This effect of RIG-I is consistent with the results of previous studies. Moreover, we found that the downregulation of RIG-I can be mediated by STAT3, an important transcription factor that contributes to tumor progression in various ways. Previous studies have reported that IFNs can also activate STAT3.36 37 The role of STAT3 in the effects of IFNs remains to be further elucidated. We and other groups have reported that the activation of STAT3 can decrease the effect of IFNs on the apoptosis of cells and attenuate the antiviral effect of IFNs.38 39 STAT1 is a key transcription factor that mediates the antitumor effect of IFNs.40 While the interplay between STAT3 and STAT1 has long been considered important, the mechanism linking this interplay remains elusive. In this study, we showed that STAT3 can inhibit the activation of STAT1 via RIG-I and decrease the effect of IFN-α on tumor cells. This finding also provides a new vision of the role of STAT3 in regulating signals in the JAK-STAT pathway and provides evidence that STAT3 plays a role in mediating immune suppression.

A schematic shows the evasion of interferon-α (IFN-α)-mediated signaling in tumor-repopulating cells (TRCs).
Fibrin is derived from soluble plasma protein fibrinogen. Fibrinogen can be converted to fibrin by chemical reaction catalyzed by thrombin present in the stroma of malignant tumors.41 It has been shown that fibrin and fibrinogen promote the survival and metastatic potential of circulating tumor cells.42 43 Specifically, fibrin might be a fundamental extracellular matrix (ECM) component that is profoundly involved in tumorigenesis and the 3D fibrin gels might be a very unique natural biomaterial that is capable of regulating either TRC growth, instead of artificial biomaterials. Fibrin uses integrin αvβ3 to transduce a weaker force to cells.44 Integrin signals have been implicated in enhancing tumor cell stemness and promoting metastasis and extracellular matrix-mediated drug resistance.45 ITGB3 is a representative integrin, and previous studies have demonstrated that ITGB3 is a marker of CSCs in various tumors.45 46 Little work to demonstrate the role of ITGB3 in immune escape has been performed. However, recent work showed that host expression of ITGB3 enhances immune function via mediating the differentiation of tumor-associated macrophages.47 The data here show the effect of ITGB3 expression on tumor cells. The net effect of ITGB3 was enhanced cancer cell stemness, which results in enhanced immune escape, supporting our notion. The canonical pathway that mediates the ITGB3 signal is through enhanced focal adhesion-related signals such as fak and cdc42, which can activate c-SRC.48 Activation of c-SRC can promote tumor progression and initiation, as verified in various studies. In our study, we observed the increased activation of c-SRC and enhanced activation of its downstream substrates in TRCs. Our study provides new insights into ITGB3 in the immune system.
Conclusions
In summary, the data presented in this study clearly showed that TRCs downregulated the expression of RIG-I through an ITGB3-c-SRC-STAT3-dependent pathway. Decreased RIG-I expression may lead to diminished activation of STAT1, resulting in the attenuated effect of IFN-α on TRCs. Interruption of ITGB3/c-SRC/STAT3 signaling pathway sensitized cells to IFN-α. Our study verified that matrix-derived signals can contribute to immune escape and provides a new concept of combinatorial treatment for future immunotherapy.
Acknowledgments
Special thanks to Professor Bo Huang' laboratory for their material and technical assistance.
References
Footnotes
YL and YS contributed equally.
Contributors JL and FC supervised the study and revised the manuscript. YL, YS, PL and ML conceived and performed analyses and wrote the manuscript. TX, XY, YY, YT, LX, RD, HW and XZ performed experiments. LG performed bioinformatics analysis. XW, PC, XW and XC provided expertise. All authors read and approved the final manuscript.
Funding This work was supported by National Basic Research Program of China (973program, 2015CB932600), National Natural Science Foundation of China (81702767 and 81801066), Hubei Provincial Natural Science Foundation of China (2018CFC874), Funds from the Wuhan University (2042019kf0206), Funds from the Renmin Hospital, Hubei University of Medicine (YL, 03328),Beijing Medical and Health Foundation (YWJKJJHKYJJ-B17241-Q1).
Competing interests None declared.
Patient consent for publication Not required.
Ethics approval All procedures involving mice and experimental protocols were approved by the Animal Care and Use Committee of Tongji Medical College, Huazhong University of Science and Technology (Wuhan, China).
Provenance and peer review Not commissioned; externally peer reviewed.
Data availability statement All data relevant to the study are included in the article or uploaded as supplementary information.