Article Text

Abstract
Background Assessment of the immune status of muscle-invasive bladder cancer (MIBC) has previously shown to be prognostically relevant after treatment with curative intent. We conducted this study to develop a clinically applicable immune gene expression assay to predict prognosis and adjuvant chemotherapy benefit.
Patients and methods Gene expression of CD3Z, CD8A and CXCL9, immune cell (IC) populations including stromal tumor infiltrating lymphocytes (sTILs), T-cells, natural killer cells (NK-cells), macrophages, Programmed cell death protein 1 positive (PD-1) IC and tumor subtypes (MD Anderson Cancer Center/MDACC-approach) were assessed in 187 MIBC patients (Comprehensive Cancer Center Erlangen-EMN/CCC-EMN-cohort). A gene expression signature was derived by hierarchical-clustering and validated in The Cancer Genome Atlas (TCGA)-cohort. IC populations in the TCGA cohort were assessed via CIBERSORT. Benefit of platinum-containing adjuvant chemotherapy was assessed in a pooled cohort of 125 patients. Outcome measurements were disease specific survival, disease-free survival and overall survival.
Results The gene expression signature of CXCL9, CD3Z and CD8A correlates with quantitative amounts of specific IC populations and sTILs (CCC-EMN: ρ-range: 0.44–0.74; TCGA: ρ-range: 0.56–0.82) and allows stratification of three different inflammation levels (inflamed high, inflamed low, uninflamed). Highly inflamed tumors are preferentially basal subtype and show favorable 5-year survival rates of 67.3% (HR=0.27; CCC-EMN) and 55% (HR=0.41; TCGA). Uninflamed tumors are predominantly luminal subtypes and show low 5-year survival rates of 28% (CCC-EMN) and 36% (TCGA). Inflamed tumors exhibit higher levels of PD-1 and Programmed cell death 1 ligand 1 (PD-L1). Patients undergoing adjuvant platinum-based chemotherapy with ‘inflamed high’ tumors showed a favorable 5-year survival rate of 64% (HR=0.27; merged CCC-EMN and TCGA cohort).
Conclusion The gene expression signature of CD3Z, CD8A and CXCL9 can assess the immune status of MIBC and stratify the survival of MIBC patients undergoing surgery and adjuvant platinum-based chemotherapy. Furthermore, the assay can identify patients with immunological hot tumors with particular high expression of PD-L1 potentially suitable for immunotherapy.
- immunology
- pathology
- urology
This is an open access article distributed in accordance with the Creative Commons Attribution Non Commercial (CC BY-NC 4.0) license, which permits others to distribute, remix, adapt, build upon this work non-commercially, and license their derivative works on different terms, provided the original work is properly cited, appropriate credit is given, any changes made indicated, and the use is non-commercial. See http://creativecommons.org/licenses/by-nc/4.0/.
Statistics from Altmetric.com
Introduction
Urothelial bladder cancer is the ninth most common cancer worldwide.1 Thirty per cent accounts for muscle-invasive bladder cancer (MIBC).2 Current treatment of MIBC in curative intent includes radical cystectomy with bilateral lymphadenectomy accompanied with a perioperative platinum-based chemotherapy dependent on the clinical situation.3
Transcriptional profiling of MIBC has led to the discovery of specific molecular subtypes, which are broadly categorized into luminal, basal and neuroendocrine-like gene expression patterns.4–7 While consensus classification efforts are still ongoing,8 recent studies demonstrated the prognostic,4–7 and predictive value of the major tumor subtype lineages.7 9 10 Although immunotherapeutic approaches emerged in the past years and are currently being investigated in clinical settings,11–16 research is ongoing to determine the immunological influence within the tumor immune microenvironment (TIME) of MIBC. Recent publications showed significant differences in the TIME of MIBC including specific immune phenotypes correlating with tumor subtypes, for example, high or low inflammation levels with basal or luminal tumors, respectively.10 17 18 Previously, we demonstrated that significantly prolonged disease specific survival (DSS) of MIBC patients was dependent on high stromal tumor infiltrating lymphocyte (sTIL) amounts and the spatial distribution of immune cell (IC) infiltrates.18 Despite the relevance of our comprehensive findings, this present study sought to simplify how this knowledge could be implemented into the daily clinical practice by establishing a diagnostic test.18 We present a new reverse transcriptase quantitative polymerase chain reaction (RT-qPCR) assay we developed called ImmuneTyper, which applies a gene expression signature of three T-cell inflammation related and cytotoxic T-cell genes, CD3Z, CD8A and CXCL9, to assess MIBC inflammation and stratify survival of patients with MIBC undergoing surgery and adjuvant platinum-based chemotherapy with curative intent. Testing a total of 594 MIBC we found that CD3Z, CD8A and CXCL9 gene expression levels correlates with total amounts of IC infiltrates representing inflammation levels, tumor subtypes, and patient survival including patients who, underwent platinum-based adjuvant chemotherapy. We propose that the ImmuneTyper-signature can be implemented as a diagnostic tool to assess the TIME and stratify survival of patients with MIBC.
Material and methods
Patient populations
Two independent MIBC cancer cohorts (online supplementary table S1) were investigated and described previously: (1) the Comprehensive Cancer Center Erlangen- EMN cohort (CCC-EMN; n=187)18–21; and (2) The Cancer Genome Atlas cohort of bladder cancer (TCGA BLCA; n=407).5 18 In detail, the CCC-EMN cohort consisted of 187 consecutively collected MIBC cases of which 56 received adjuvant platinum-based chemotherapy. The TCGA BLCA cohort analyzed in the present study consisted of all 407 cases of the TCGA BLCA cohort with available RNAseq data. Clinical, pathological and molecular data of the TCGA cohort were updated accordingly.5 According to the clinical information of TCGA 69 patients of this cohort received platinum-based adjuvant chemotherapy without further details on the chemotherapy regimen.
Supplemental material
The pooled adjuvant platinum-based chemotherapy cohort consisted of 56 patients from the CCC-EMN cohort (n=48: Cis-Platinum+Gemcitabine; n=8 Carbo-Platinum +Gemcitabine) and 69 patients from the TCGA BLCA cohort (no detailed information about the platinum-containing regime available). Detailed clinical-pathological data are depicted in online supplementary table S1.
Composition and validation of the ImmuneTyper RT-qPCR assay
The ImmuneTyper panel consists of three important genes related to interferon gamma induced T-cell driven antitumoral immunity: (1) CD3Z (CD247) codes for the zeta-chain of the T-cell receptor (TCR), (2) CD8A codes for the alpha subunit of the cytotoxic T-cell co-receptor where both genes represent stable markers for overall T-cell (CD3Z) and cytotoxic T-cell infiltration (CD8A) in MIBC as shown previously.18 22 23 Lastly (3) CXCL9 codes for a T-cell chemoattractant significantly induced by interferon gamma. CXCL9 not only correlates with interferon gamma induced T-cell driven antitumoral immune responses but also with an improved response to immune checkpoint inhibition in MIBC.5 11 18 22 23 The gene panel showed a comparable performance reflecting the general level of antitumoral inflammation compared with a T-cell-related inflammation signature consisting of 59 immune genes.18 To further validate the representativeness of the ImmuneTyper, correlational analyzes with stromal tumor infiltrating ICs (general immune infiltration marker; sTILs), specific IC populations (CD3+ T-cells, CD8+ cytotoxic T-cells, macrophages and NK-cells) and expression values of each specific gene were carried out in the CCC-EMN and the TCGA cohort.
Assessments of sTILs sTILs were analyzed on HE-stained whole mount sections in both cohorts by two independent observers as described previously according to a standard methodology of the International working group on TILs.18 24–27 sTIL assessment has been shown to reflect the overall immune infiltration status of several solid cancer entities.18 24–27
Tissue microarray construction
Spatially designed tissue microarrays (TMAs) covering the invasion front and the tumor center were prepared as described previously.18–20
CCC-EMN: immunohistochemistry and PD-L1 assessment
Immunohistochemical stains were performed on 4 µm TMA tissue sections on a Ventana Benchmark Ultra autostainer (Ventana) for the following proteins: CD3 (F7.2.38, monoclonal mouse, ThermoFisher-Scientific, dilution 1:50), CD8 (C8/144B, mouse monoclonal, ThermoFisher-Scientific, dilution 1:50), CD68 (PG-M1, mouse monoclonal, ThermoFisher-Scientific, dilution 1:60), PD-1 (NAT105, mouse monoclonal; Ventana) and CD56 (MRQ-42, monoclonal mouse, CELL MARQUE, dilution 1:50) and PD-L1 (SP263 assay, Ventana).
PD-L1+ ICs and tumor cells (TCs) were scored by two pathologists (AH, ME) according to the distributor’s PD-L1 scoring algorithm.19 20 Positivity of TC was scored as a percentage of positive TC in relation to TC area. Number of ICs was scored as the percentage ratio of the area occupied by positive ICs per tumor area.19
Automated image analysis by Definiens developer software
Tumor, normal and stroma tissue as well as empty spaces were assessed as described previously.18 CD3+, CD8+, CD68+, PD-1+ and CD56+ IC were quantified (counts per mm2) and log2-transformed for further analysis.
Molecular tumor subtyping using Nanostring
RNA was isolated and purified as described previously.18 We selected 21 genes according to the MDDACC subtyping approach, where these genes are known to represent specific differentiation markers identifying (1) luminal tumors expressing KRT20, KRT7, GATA3, FGFR3, CYP2J2, ERBB2, ERBB3 and CDH1 as well as (2) luminal ECM-like/‘p53-like’ tumors expressing MYH11, ACTG2, CNN1, MFAP4, VIM and (3) basal tumors expressing KRT5, KRT6A-C, SNAI2, CDH3, CD44. Thus, using these 21 genes we were able to classify our tumor samples into the two major MIBC subtypes (basal and luminal).6 7 18 Gene counts were normalized using two reference genes (SDHA, HPRT1) and log2-transformed for further analysis with the nSolver 4.0 software. Selected genes are depicted in online supplementary table S2.
Supplemental material
CCC-EMN: reverse transcription quantitative polymerase chain reaction (RT-qPCR)
RNA was extracted based on a magnetic bead technology approach (RNXtract, STRATIFYER, Germany) as described previously.18 20 CD3Z (CD247), CD8A and CXCL9 expression was assessed in triplicates on a Versant qPCR system (Siemens, Erlangen, Germany). Data were normalized, using three housekeeping genes (RPL37A, B2M, CALM2) according to MIQE guidelines.28 Final values were generated using ΔCT from the total number of cycles to ensure that normalized gene expression obtained is proportional to the corresponding mRNA expression levels (40- ΔCT).
TCGA: IC population by CIBERSORT-algorithm
Relative fraction of IC populations based on the complete TCGA RNAseq data set were calculated using the CIBERSORT algorithm (https://cibersort.stanford.edu/) with 1000 permutations.29
Statistical analysis
Survival curves were estimated by Kaplan-Meier regression. Median potential follow-up was calculated by reverse Kaplan-Meier analysis. Patients at risk at various time points are shown below each survival plot. Statistical comparisons of subgroups included nonparametric Wilcoxon rank-sum test for continuous variables, Pearson's chi-square test for nominal variables and log rank test for time-to-event outcomes. Multivariable survival analyzes were conducted using Cox proportional hazards regression modeling, to assess the magnitude of impact (the HR) of the ImmuneTyper-signature, while adjusting for clinical-pathological variables (pT-Stage, pN-Stage, lymphovascular invasion (L), age, gender, presence of distant metastasis and tumor grading (WHO2016 and WHO1973). Overall survival (OS) was defined as survival time until death by any reason (disease related, non-disease related; OS). DSS was defined as survival time until DSS. Disease-free survival was defined as survival time until local or distant disease recurrence (DFS). Variables for final multivariable models were selected by stepwise back and forward selection which is depicted in detail in online supplementary table S3. All p values were two sided and a p<0.05 was considered statistically significant. Cluster analysis was performed by unsupervised hierarchical clustering based on average link algorithm (WPGMA, weighted pair-group method using arithmetic averages) using Euclidean distance as metric scale. All statistical analyzes were performed by GraphPad Prism V.7.2 (GraphPad Software, La Jolla, California, USA) and JMP SAS V.13.2 (SAS).
Supplemental material
Results
Correlation of cytotoxic IC gene expression with IC populations
We tested whether expression of a minimum of three genes, CD3Z, CD8A and CXCL9, involved in cytotoxic activity of T-cells correlated with distinct amounts of IC populations within the TIME. Results showed strong correlations of CXCL9 (Spearman r: 0.51–0.66; figure 1A), CD3Z (Spearman r: 0.43–0.56; figure 1B) and CD8A gene expression (Spearman r: 0.44–0.64; figure 1C) with amounts of CD3+ and CD8+ T-lymphocytes, macrophages (CD68+) and NK-cells (CD56+; figure 1D) as well as with sTILs (Spearman r: 0.63–0.74; figure 1E) a biomarker for overall IC infiltration in MIBC.18 These findings indicate that levels of anti-tumor activity within the TIME can be accurately assessed by gene and cell surface protein marker expression of lymphocytes and macrophages. Intergene correlations of CD3Z (CD247), CD8A and CXCL9 are depicted in online supplementary table S4.
Supplemental material

Correlations of gene expression with immune cell (IC) populations: Spearman rank correlations of CXCL9 (A), CD3Z (B) and CD8A (C) gene expression with CD3+, CD8+, CD68+ (macrophages) and CD56+ (NK-cells) IC infiltrates detected by immunohistochemistry. (D) Representative images of IC populations. (E) Spearman rank correlations of CXCL9, CD3Z and CD8A gene expression with stromal tumor infiltrating lymphocytes (sTILs).
Unsupervised hierarchical clustering of CD3Z, CD8A and CXCL9 revealed three clusters (figure 2A): cluster A (‘inflamed: high’; median sTILs 40%), cluster B (inflamed: Low’; median sTILs 15%) and cluster C (‘uninflamed’; median sTILs 5%). Total amounts of CD3+ and CD8+ T-cells as well as of NK-cells and macrophages were highest in cluster A and second highest in cluster B (eg, median log2 value of CD8+-T-Cells in Cluster A 9.21 vs 8.29 in Cluster B vs 6.52 in Cluster C; p<0.0001; figure 2B). Tumors within cluster A (‘inflamed: high’) showed a predominance of basal subtype (69.0%) while tumors with lower inflammation levels were predominantly luminal (eg, 59.6% of cluster C/‘uninflamed’; figure 2A). In addition, expression of PD-L1 on IC and TC, as well as of PD-1 on IC was significantly higher in ‘inflamed: high’ and ‘inflamed: low tumors’ compared with ‘uninflamed’ tumors (figure 2C).
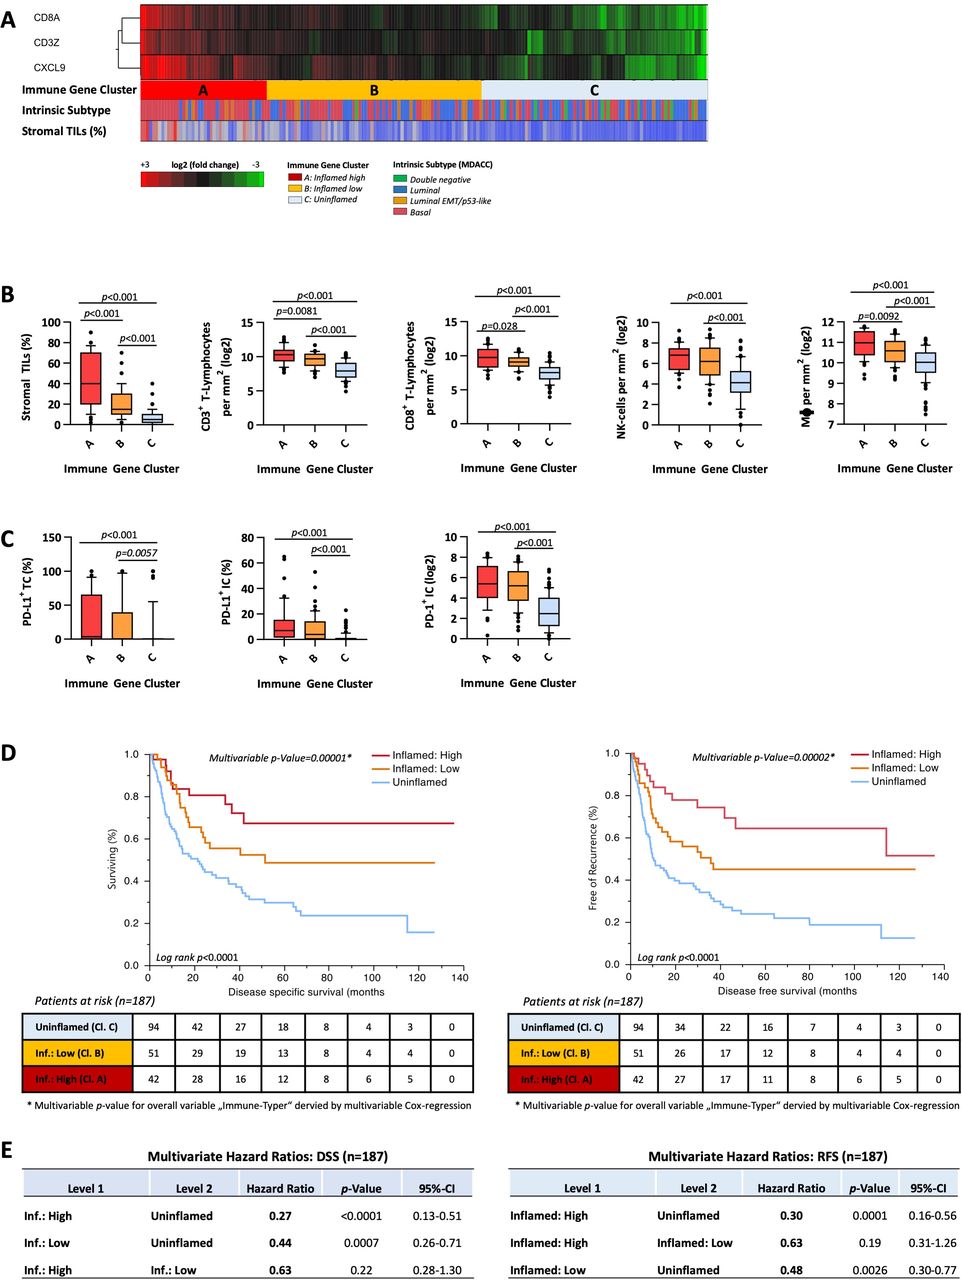
CCC-EMN cohort—immune gene clusters: (A) unsupervised hierarchical cluster analysis (average-linkage algorithm) of CD8A, CD3Z and CXCL9 gene expression: cluster A=inflamed high, cluster B=inflamed low, cluster C=uninflamed. Distribution of intrinsic subtypes and sTILs (%) are depicted below in h-bar plots. (B) Correlations of immune gene clusters A, B and C with sTILs, CD3+, CD8+, CD68+ (macrophages) and CD56+ (NK-cells). (C) Correlations of immune gene clusters A, B and C with total amount of PD-1+ IC and protein expression of PD-L1 on IC and tumor cells. P values are derived by Mann-Whitney U test. (D) Kaplan-Meier regression of disease specific (DSS) and disease-free survival (DFS) based on immune gene clusters. Univariable log-rank p value is depicted in the lower left corner of the survival plots. Multivariable p value for the entire indicator ‘immune gene clusters’ derived by multivariable Cox regression is depicted above the survival curves. Table shows number of patients at risk in 20 months increments. (E) Multivariable HRs of immune gene clusters for DSS and DFS. IC, immune cell; sTILs, stromal tumor infiltrating lymphocytes.
Prognostic impact of cytotoxic IC gene expression
Patients within cluster A and cluster B showed significantly longer 5 years DSS (cluster A: 67.3% (95% CI 48.2% to 82.1%); cluster B: 47.9% (95% CI 33.3% to 62.9%) and DFS (cluster A: 64.5% (95% CI 45.2% to 79.9%); cluster B: 45.1% (95% CI 31.0% to 60.0%)) compared with uninflamed tumors with lowest 5 years DSS (29.1%, 95% CI 20.1% to 40.1%) and DFS (23.9%, 95% CI 15.7% to 34.7%) rates (figure 2D). Multivariable Cox-regression analyzes revealed clusters A and B as independent predictors for improved DSS (multivariable p value 0.00001) and DFS (multivariable p value 0.00002; figure 2E; online supplementary table S3).
TCGA BLCA: validation cohort
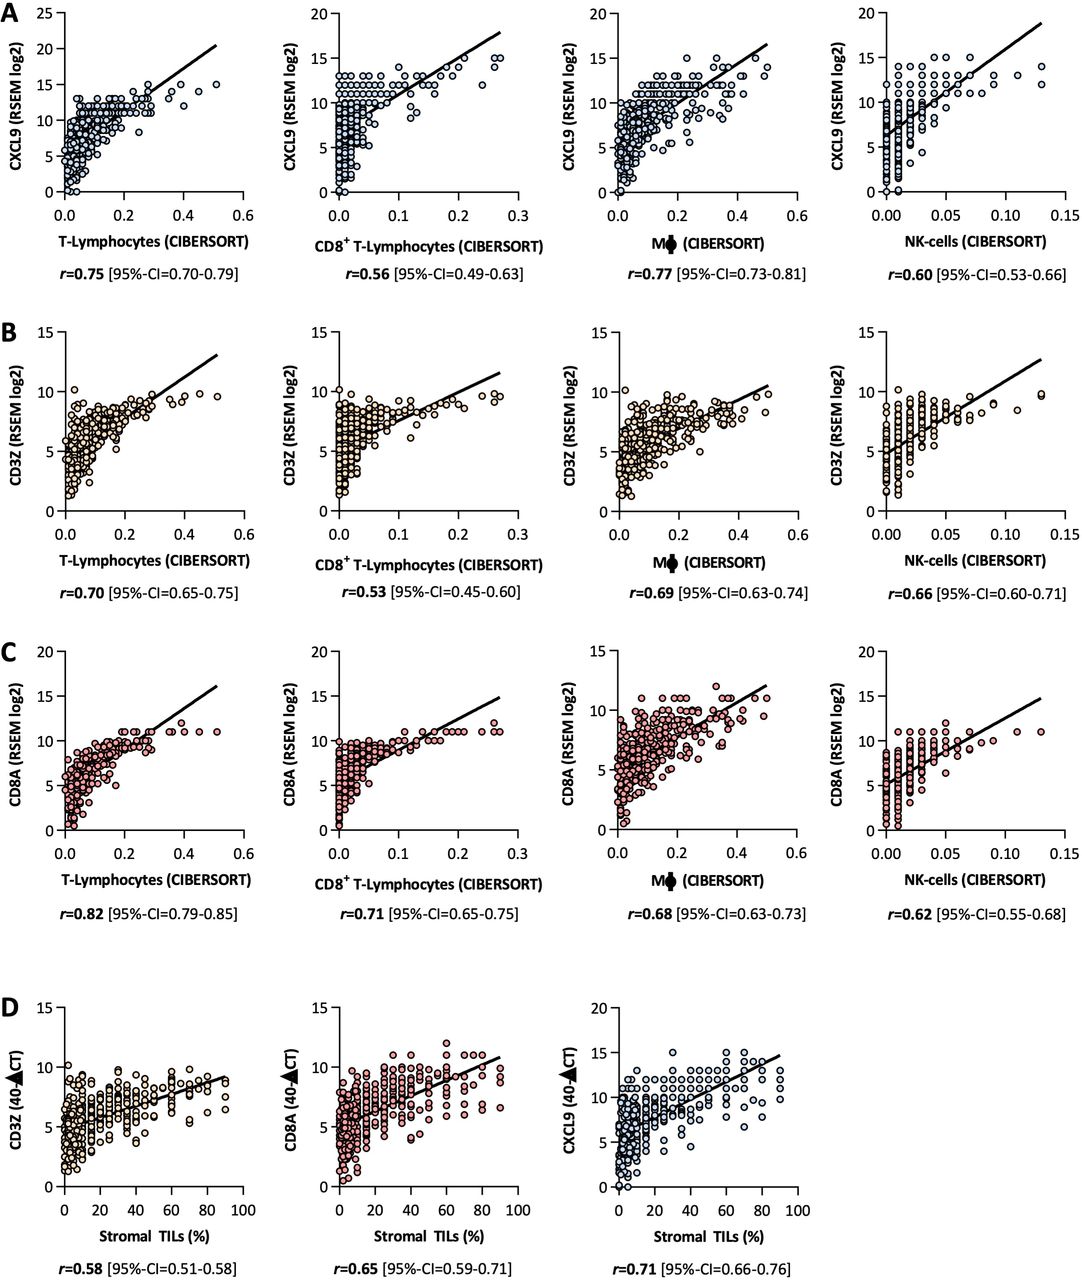
We employed gene expression data of 407 MIBC out of the TCGA data set to validate our findings.5 Gene expression of the three genes, CXCL9 (Spearman r: 0.56–0.75; figure 3A), CD3Z (Spearman r: 0.53–0.70; figure 3B) and CD8A (Spearman r: 0.62–0.82; figure 3C), correlated with IC populations derived by the CIBERSORT-algorithm. Furthermore, expression of these three signature genes significantly associated with sTILs (Spearman r: 0.58–0.71; figure 3D).

TCGA BLCA cohort—correlations of gene expression with CIBERSORT IC populations: Spearman rank correlations of CXCL9 (A), CD3Z (B) and CD8A (C) gene expression with T-lymphocytes, CD8+-lymphocytes, macrophages and NK-cells derived by CIBERSORT. (D) Spearman rank correlations of CXCL9, CD3Z and CD8A gene expression with stromal tumor infiltrating lymphocytes (sTILs). TCGA BLCA, The Cancer Genome Atlas cohort of bladder cancer. RSEM = RNA-Seq by Expectation Maximization
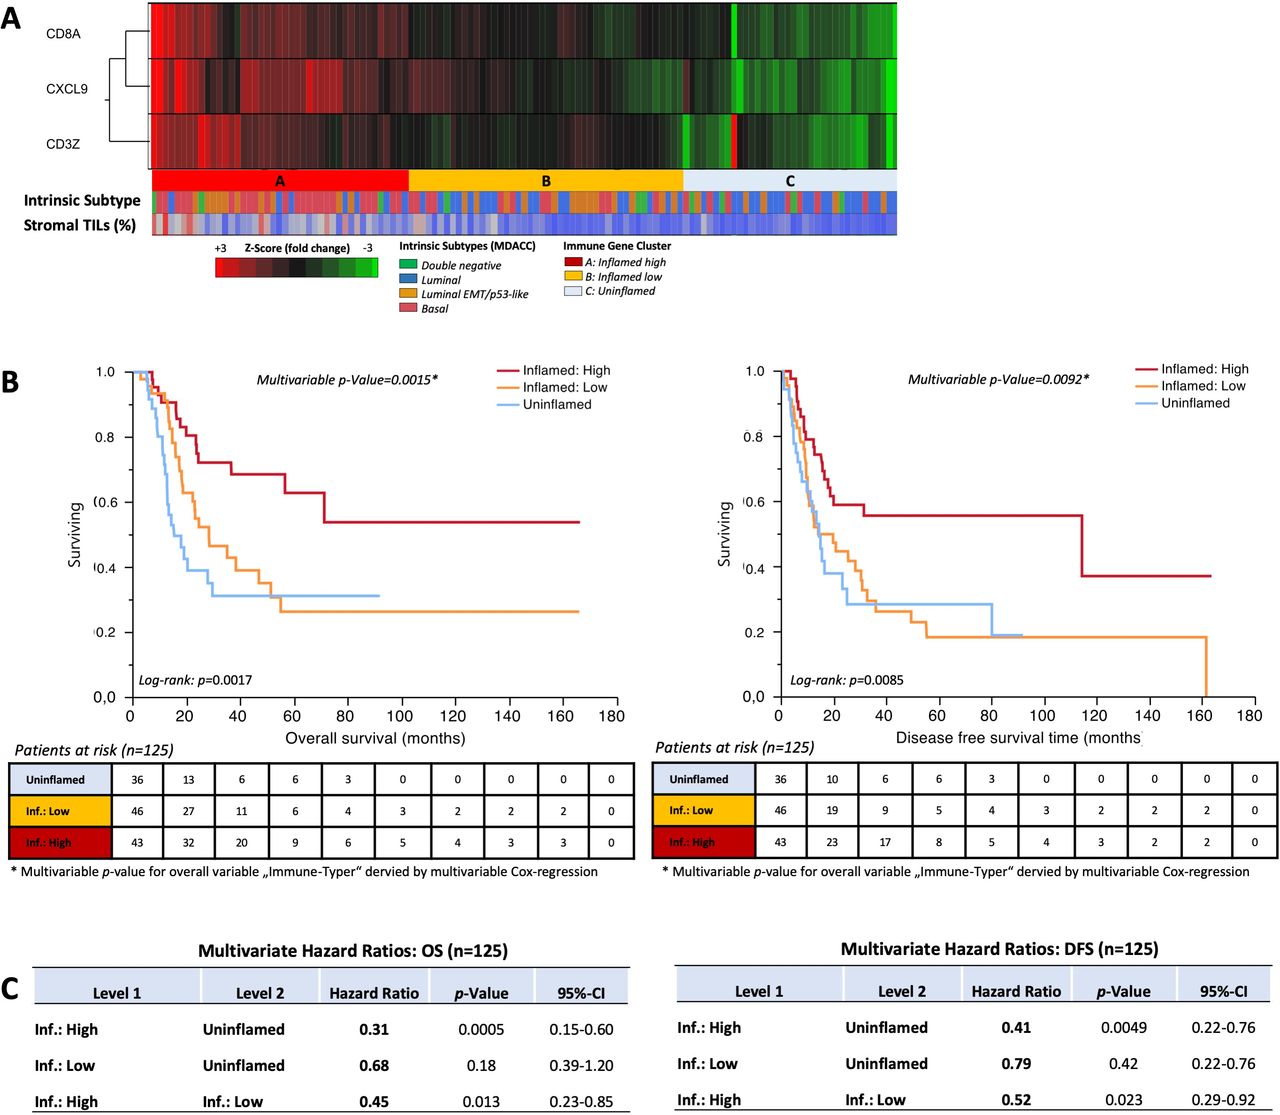
Unsupervised hierarchical clustering of CD3Z, CD8A and CXCL9 revealed three clusters (figure 4A): cluster A (‘inflamed: high’; median sTILs 40%), cluster B (‘inflamed: low’; median sTILs 15%) and cluster C (‘uninflamed’; median sTILs 5%). Total amounts of CD3+ and CD8+ T-cells as well as of NK-cells and macrophages were distributed in the same manner as our CCC-EMN cohort with highest numbers in cluster A and second highest in cluster B (figure 4B). Distribution of tumor subtypes regarding the different inflammation clusters was comparable to our CCC-EMN cohort: cluster A/‘inflamed high’ showed a predominance of basal squamous tumors (61.6%) while lowly inflamed tumors were predominantly luminal (79.7% of cluster C/‘uninflamed’; figure 4A). Highly (cluster A) and lowly (cluster B) inflamed tumors exhibited significantly higher levels of the immune checkpoint genes PD-L1 and PD-1 (PDCD-1) compared with uninflamed tumors (cluster C; figure 4C).

TCGA BLCA cohort—immune gene clusters: (A) unsupervised hierarchical cluster analysis (average-linkage algorithm) of CD8A, CD3Z and CXCL9 gene expression: cluster A=inflamed high, cluster B=inflamed low, cluster C=uninflamed. distribution of intrinsic subtypes and sTILs (%) are depicted below in h-bar plots. (B) Correlations of immune gene clusters A (inflamed high), B (inflamed low) and C (uninflamed) with sTILs, T-lymphocytes, CD8+-lymphocytes, macrophages and NK-cells. P values are derived by Mann-Whitney U test. (C) Correlations of immune gene clusters A, B and C with gene expression of PDCD-1 (PD-1) IC and PD-L1 (CD274). (D) Kaplan-Meier regression of overall survival (OS) and DFS based on immune gene clusters. Univariable log-rank p value is depicted in the lower left corner of the survival plots. Multivariable p value for the entire indicator ‘immune gene clusters’ derived by multivariable Cox-regression is depicted above the survival curves. Table shows number of patients at risk in 20 months increments. (E) Multivariable HRs of immune gene clusters for OS and DFS. DSS, disease-specific survival; TCGA BLCA, The Cancer Genome Atlas cohort of bladder cancer; TILs, tumor infiltrating lymphocytes.
Congruent with the above described observations, we found that patients with highly inflamed tumors (cluster A) had significantly prolonged OS and DFS (figure 4C). Different to the CCC-EMN cohort, lowly inflamed tumors (cluster B) showed no superior outcome measures than uninflamed tumors (figure 4C). Furthermore, high inflammation (cluster A) emerged as an independent prognostic factor for better OS (multivariable p value 0.0006) and DFS (multivariable p value 0.007) in a multivariable Cox-regression model compared with lowly and uninflamed tumors (figure 4D;online supplementary table S3).
Prediction of improved outcome after adjuvant platinum-based chemotherapy
To investigate whether patients treated with platinum-based adjuvant chemotherapy show a dependency on inflammation levels, we combined 69 patients from the TCGA and 56 patients from the CCC-EMN cohorts (online supplementary table S1). We also found three cluster groups (Cluster A–C; figure 5A) with comparable distributions of tumor subtypes as described above: cluster A: 53.5% basal tumors (luminal tumors 39.6%); cCluster B 69.5% luminal tumors (basal tumors 23.9%), cluster C 69.5% luminal tumors (basal tumors 19.4%).
Adjuvant chemotherapy cohort (TCGA +CCC EMN): (A) unsupervised hierarchical cluster analysis (Average-linkage algorithm) of CD8A, CD3Z and CXCL9 gene expression: cluster A=inflamed high, cluster B=inflamed low, cluster C=uninflamed. distribution of intrinsic subtypes and TILs (%) are depicted above in h-bar plots. (B) Kaplan-Meier regression of OS and DFS based on immune gene clusters. Univariable log-rank p value is depicted in the lower left corner of the survival plots. Multivariable p value for the entire indicator ‘immune gene clusters’ derived by multivariable Cox-regression is depicted above the survival curves. Table shows number of patients at risk in 20 months increments. (C) Multivariable HRs of immune gene clusters for OS and DFS. TCGA, The Cancer Genome Atlas; TILs, tumor infiltrating lymphocytes.
Patients within cluster A (‘inflamed high’) showed significantly prolonged OS (multivariable p=0.0015; multivariable HR=0.27 (Cl. A vs Cl. B)) and prolonged DFS after adjuvant platinum-based chemotherapy in multivariable Cox proportional hazard analyzes (multivariable p=0.0092; multivariable HR=0.41 (Cl. A vs Cl. B);figure 5B,C; online supplementary table S3).
Discussion
In a prior study, we showed that high numbers of T-cells, B-cells and NK-cells correlate with an inflammatory response targeting MIBC cells where the spatial distribution and amounts of IC infiltrates predicted improved survival after standard patient treatment.18 Since a comprehensive analysis is time consuming and expensive, we conducted this present study to develop a simpler and less expensive standardized RT-qPCR-based gene expression test to assess the TIME of MIBC for the daily laboratory practice. This test can be performed with RNA isolated from routine formalin fixed paraffin embedded (FFPE) tissue and has a turnover time of approximately 2 days. In order to design a routine applicable test which is able to sufficiently assess the grade of antitumoral inflammation we chose three genes associating with T-cell driven antitumoral inflammation: CD3Z, CD8A and CXCL9. CD3Z encodes the TCR ζ-chain which plays a crucial role in TCR signal transduction after antigen-mediated T-Cell activation through antigen presenting cells.30 Although it has been shown that ζ-chain downregulation is a common mechanism of adaptive immune regulation, and that TCs can evade the immune system by induction of ζ-chain downregulation,30 31 CD3Z has been validated as stable marker for general T-cell infiltration in MIBC.18 22 23 CD8A encodes the alpha-subunit of the T-cell co-receptor of cytotoxic T-cells which represents the most important cell population in inducing immunogenic cell death beside NK cells and has been proposed to be the central cell population in interferon gamma mediated antitumoral immune responses.32 To reflect the previously shown interferon gamma dependency of antitumoral responses against MIBC,18 22 23 we further included CXCL9, which encodes an interferon gamma-induced T-cell chemoattractant, which and has been associated with interferon gamma induced T-cell driven antitumoral immune responses as well as improved response to immune checkpoint inhibition in MIBC.5 11 18 22 23 The three gene panel showed a comparable performance in reflecting the general level of antitumoral inflammation compared with a T-cell-related inflammation signature consisting of 59 immune genes as reported previously.18 In additional correlational analyzes, we could validate that our present ImmuneTyper-signature can accurately determine different stages of tumor inflammation in two independent MIBC cohorts, the CCC-EMN cohort,18 20 and the TCGA BLCA cohort.5 Inflammation gene expression levels using this assay correlate with different IC populations such as CD3+-cells and CD8+-T-cells, NK cells, macrophages and sTILs, which is an established biomarker for overall IC infiltration in solid tumors.25 27 33 These findings indicate that using this gene expression signature results in a valid assessment of the TIME in MIBC samples. In line with prior studies, tumors with high inflammation levels showed a predominance of basal differentiation while lowly inflamed tumors were predominantly luminal differentiated.5 18 34 Although the association of immune infiltration with specific tumor subtypes has been shown previously as well as validated by this study, our present results indicate that additional assessment of the TIME of basal and luminal bladder tumors is necessary to clearly identify immune cold and immune hot tumors.5 18 This is underlined by the fact that tumor inflammation represented an independent predictor for prolonged DSS, OS and DFS after cystectomy of patients with high IC infiltrates regardless of clinicopathological variables and tumor subtypes (basal/luminal).10 17 18 34 Furthermore, these findings are important for MIBC patients receiving perioperative platinum-based chemotherapy regimens. Recent studies showed IC infiltrates to be an indicator for a favorable outcome after chemotherapy in breast cancer,25 35 in metastatic MIBC36 and after cystectomy in MIBC,18 as well as after trimodal bladder sparing treatment.10 Congruent with these findings, our results show that a minimum expression of three key inflammation genes also allows risk stratification of patients receiving adjuvant platinum-based chemotherapy in 125 MIBC patients. Although, the majority of those patients benefitting from adjuvant chemotherapy had a basal MIBC subtype, luminal tumors were significantly less inflamed and showed a worse outcome after adjuvant platinum-based chemotherapy. Our results highlight that the overall tumor inflammation determined by the gene expression panel represented an independent predictor for improved OS and DFS regardless of basal or luminal subtype. Stemming from the above findings, the predominance of immune hot tumors in the basal subtype might be an explanation why patients with basal MIBC have a higher likelihood to respond to platinum-based chemotherapy regimens than patients with luminal tumors.9 On the other hand, our data also show that patients with luminal tumors benefit from adjuvant platinum-based chemotherapy in the presence of high immune infiltrates. This is further supported by data from Efstathiou et al which clearly demonstrated that the grade of tumor inflammation is a more reliable biomarker to predict the response to trimodal bladder sparing treatment than subtype assignments.10 Similar relations have been shown for breast cancer patients undergoing neoadjuvant chemotherapy where patients with higher sTIL had the highest response rates and the best OS.24 37 38
In the forefront of ongoing clinical trials investigating the efficacy of checkpoint inhibition in curatively intended neoadjuvant and adjuvant setting39 (NCT03387761; NCT03421652; NCT02845323; NCT03732677; NCT02450331; NCT02632409), assessment of TIME status gains special importance. High expression of PD-1, PD-L1 and other immune checkpoints can be an adaptive immunoregulatory response in the TIME of MIBC indicating a sufficient anti-tumoral immune response correlating with improved survival,18 40 41 but also an indicator for MIBC with constitutive PD-L1 expression on TCs as determined by immunohistochemistry.18 41 We found that patients with high IC infiltrates as determined by the gene expression signature have improved survival, but also increased levels of PD-1+ on IC and PD-L1+ on both IC and/or TC and thus might be suitable for immunotherapy. Additional PD-L1 testing by immunohistochemistry could further facilitate to identify tumors with high constitutive PD-L1 TC expression which are associated with adverse outcome as shown previously by our group.18 A regimented inhibition of immune checkpoints with immunotherapy in the TIME could help to improve response rates in the neoadjuvant setting of such patients by unleashing antitumoral activity,39 including clearance of circulating TC or tumor remnants in an adjuvant setting. Since T-cell infiltrates are necessary for mediating antitumoral immune responses via checkpoint inhibition,40 uninflamed tumors which are mostly luminal differentiated could be ideal candidates for currently clinically investigated epigenetic therapies (NCT01928576, NCT02959437, NCT02816021, NCT03019003) or a new approach stimulating a checkpoint activator OX-40 to override the tumor mediated immune inhibition and reignite antitumoral immune responses in different solid tumors.42–44
In conclusion, we propose that the presented gene expression signature test is reliable to assess the inflammation status of MIBC and to stratify the survival of MIBC patients undergoing treatment in curative intent. The derived immune status classification revealed to be an independent predictor for improved overall, disease specific and disease-free survival in two independent MIBC cystectomy cohorts (CCC-EMN and TCGA) as well as in a pooled cohort of 125 patients treated with adjuvant platinum-based chemotherapy. The immune status classification can be further enhanced by PD-L1 testing to improve selection of patients with high response likelihood to immune checkpoint blockade. This can help to further enhance the favorable prognosis of patients with highly inflamed tumors as well as to identify actively immune evading tumors with constitutive PD-L1 TC expression which show an aggressive intrinsic behavior.18 Regarding uninflamed tumors, it will be important to investigate and implement other therapy strategies to reignite the anti-tumoral immune response to make it approachable for immunotherapy.
Limitations
A limitation of the present study is the use of OS data to calculate survival analyzes of the TCGA cohort and the merged adjuvant chemotherapy cohort. In the TCGA cohort, age was the most adverse risk factor for poor OS (death by any cause), which is most likely the cause for frequent, non-tumor specific deaths in elderly patients, and could have biased the survival analyzes in a relevant manner. However, all multivariable analyzes in the present study were adjusted for age and other available demographic characteristics which are known to influence OS. Upcoming studies are needed to prospectively validate the prognostic value as well as the predictive value in patients treated with neoadjuvant chemotherapy and/or immune checkpoint inhibition.
Acknowledgments
The authors thank Elke Veltrup, Silke Claas, Susanne Scharff, Christa Winkelmann, Verena Popp and Christine Huben for excellent technical assistance.
References
Footnotes
Twitter @Markuseckstein3
Contributors RW, PE, CB, WO, MB, AH and BW conducted the present study. The study was supervised by AH, BW, MB and CB. The cohort was collected by ME, VW, CP, AW, DS, BK and FL. RT-qPCR experiments, RNA extraction and analysis were carried out by ME, AW, PS, RS, VW and RW. sTILs were scored by AH, ME and CP. Digital analysis of immune cells was carried out by NF, CIG, ME, CP and VW. TCGA data were analyzed by ME, FL, VW and AH. Statistical analysis was carried out by ME, DS, SW, BK, HT and WO. The manuscript was written by ME, PS and DS. All authors critically revised the manuscript and approved it for final submission.
Funding The present study was funded in part by a German Cancer Aid grant (grant number: 110541) to RW, MB, WO and AH, and by the general scientific pool of each participating institution.
Competing interests RW is founder and CEO of STRATIFYER Molecular pathology.
Patient consent for publication Not required.
Ethics approval This present study was approved by the ethical review board of the Friedrich-Alexander-University Erlangen-Nürnberg (approval number: No. 3755 and 329_16B) in accordance with the Declaration of Helsinki.
Provenance and peer review Not commissioned; externally peer reviewed.
Data availability statement Data are available on reasonable request. TCGA BLCA data which were used in this study were accessed and downloaded via https://www.cbioportal.org. Data from the CCC-EMN cohort can be shared on request in anonymized data format with an additional allowance of the german authority for clinical and patient data security.