Article Text

Abstract
Background Malignant pleural mesothelioma (MPM) is a highly lethal malignancy in need for new treatment options. Although immunotherapies have been shown to boost a tumor-specific immune response, not all patients respond and prognostic biomarkers are scarce. In this study, we determined the peripheral blood T cell receptor β (TCRβ) chain repertoire of nine MPM patients before and 5 weeks after the start of dendritic cell (DC)-based immunotherapy.
Materials and methods We separately profiled PD1+ and PD1−CD4+ and CD8+ T cells, as well as Tregs and analyzed 70 000 TCRβ sequences per patient.
Results Strikingly, limited TCRβ repertoire diversity and high average clone sizes in total CD3+ T cells before the start of immunotherapy were associated with a better clinical response. To explore the differences in TCRβ repertoire prior-DC-therapy and post-DC-therapy, for each patient the TCRβ clones present in the total CD3+ T cell fractions were classified into five categories, based on therapy-associated frequency changes: expanding, decreasing, stable, newly appearing and disappearing clones. Subsequently, the presence of these five groups of clones was analyzed in the individual sorted T cell fractions. DC-therapy primarily induced TCRβ repertoire changes in the PD1+CD4+ and PD1+CD8+ T cell fractions. In particular, in the PD1+CD8+ T cell subpopulation we found high frequencies of expanding, decreasing and newly appearing clones. Conversion from a PD1− to a PD1+ phenotype was significantly more frequent in CD8+ T cells than in CD4+ T cells. Hereby, the number of expanding PD1+CD8+ T cell clones—and not expanding PD1+CD4+ T cell clones following immunotherapy positively correlated with overall survival, progression-free survival and reduction of tumor volume.
Conclusion We conclude that the clinical response to DC-mediated immunotherapy is dependent on both the pre-existing TCRβ repertoire of total CD3+ T cells and on therapy-induced changes, in particular expanding PD1+CD8+ T cell clones. Therefore, TCRβ repertoire profiling in sorted T cell subsets could serve as predictive biomarker for the selection of MPM patients that benefit from immunotherapy.
Trial registration number NCT02395679.
- immunology
- oncology
This is an open access article distributed in accordance with the Creative Commons Attribution Non Commercial (CC BY-NC 4.0) license, which permits others to distribute, remix, adapt, build upon this work non-commercially, and license their derivative works on different terms, provided the original work is properly cited, appropriate credit is given, any changes made indicated, and the use is non-commercial. See http://creativecommons.org/licenses/by-nc/4.0/.
Statistics from Altmetric.com
Introduction
Malignant pleural mesothelioma (MPM) is a highly lethal malignancy that is often caused by asbestos fiber inhalation. Current treatment consists of a combination chemotherapy with antifolate and platinum, with an overall survival (OS) of 13.3 months and therefore novel effective treatment options are urgently needed.1
Recent breakthroughs that use cancer immunotherapy to enhance immune activation have revolutionized cancer treatment. These include inhibition of immune checkpoint molecules such as PD1/PD-L1 and CTLA-4.2 However, MPM treatment with checkpoint inhibitors was found to be non-effective3 or only effective in a subpopulation of patients,4 5 likely due to low numbers of tumor-infiltrating lymphocytes (TILs)6 7 and a highly immunosuppressive tumor micro-environment.1 8
Compared with healthy individuals, in MPM patients circulating dendritic cells (DCs) are reduced in numbers and antigen-processing capacity, which is thought to contribute to the low numbers of TILs.9 Previously, we developed a DC-mediated immunotherapy for MPM with the aim to increase the number of TILs and tumor-directed T cells.10 Patients received multiple vaccinations with autologous DCs loaded with autologous tumor cell lysate. This strategy was safe and feasible and showed signs of clinical activity in patients. However, the limited availability of tumor material precluded treatment in many MPM patients. Therefore, vaccination with DCs loaded with allogeneic tumor lysate derived from five in vitro cultured clinical-grade human MPM cell lines was developed and proven safe and feasible in a phase I clinical trial.11 Hereby, MPM patients were vaccinated three times with DCs once every 2 weeks and received booster vaccinations at three and 6 months after start of treatment. As part of the dose escalation study, each cohort of three patients received 10, 25 or 50 million DCs per vaccination. Objective radiographical responses were obtained, and one patient had a ~70% tumor reduction at 6 weeks after the first DC vaccination.11 Multicolor flow cytometry revealed that DC vaccination induced an increase in the number of circulating CD4+ T cells, CD8+ T cells and B cells.12 Furthermore, the frequency of HLA-DR, PD1 and inducible T-cell costimulator (ICOS)-expressing CD4+ T cells and LAG3-expressing CD8+ T cells increased after DC vaccination. Notably, the highest frequency of HLA-DR and ICOS-expressing CD4+ T cells was found in the best responding patient. No major treatment-associated T cell receptor (TCR) repertoire shifts were detected by analysis of TCRβ-chain complementarity-determining region 3 (CDR3) length.12
Recent TCR sequencing studies indicated that TCRβ clone frequency and diversity are affected by immunotherapies, such as checkpoint inhibitors in pancreatic ductal carcinoma,13 lung cancer,14 15 and melanoma.16 17 Hereby, TCRβ repertoire changes, including expansion or contraction of T cell clones, correlated with clinical response.14 18 Likewise, DC-therapy changed TCRβ clone frequency and diversity in glioma,19 melanoma20 and prostate cancer,21 although correlations with clinical response were not reported.
In this study, we performed quantitative next generation sequencing-based human TCRβ repertoire profiling of peripheral blood of MPM patients obtained prior-DC and post-DC vaccination. To gain insight into the DC immunotherapy-induced TCRβ repertoire changes in PD1+ and PD1−CD4+ and CD8+ T cells, as well as Tregs, we separately analyzed these five T cell subpopulations. We observed that TCRβ repertoire changes significantly correlated with patient survival, indicating the potential of TCRβ profiling as a biomarker of clinical response to DC-based immunotherapy.
Materials and methods
Study design of the DC-based immunotherapy, FACS-sorting of T cell subsets, analysis of TCRβ repertoire and statistical evaluation are detailed in online supplementary materials and methods file.
Supplemental material
Results
DC-therapy induces TCRβ repertoire changes specifically in PD1+CD8+ T cells
To identify immunotherapy-induced TCRβ repertoire changes, we profiled fractions of total CD3+ T cells, PD1− and PD1+CD4+ T cells, PD1− and PD1+CD8+ T cells and Tregs from peripheral blood of nine MPM patients pre-DC-therapy and 5 weeks post-DC-therapy (see online supplementary figure S1 for gating strategy). The numbers of retrieved TCRβ sequences varied across the T cell fractions (see online supplementary figure S2). To normalize the reads per T cell fraction, we used 25 000 quality-filtered, randomly selected sequences per sample for the total CD3+ T cell fractions and 2000 sequences for the individual T cell subpopulations.
Supplemental material
Supplemental material
Supplemental material
The PD1− and PD1+CD8+ T cell fractions showed the largest degree of clonal expansion, given their highest average clone size, both pre-therapy and post-therapy (figure 1A). The PD1+CD8+ T cell fractions showed the highest numbers of highly expanded clones (HECs; clones with a frequency ≥0.5%) (figure 1B). The HECs accounted for 46.2% (±12.8%) and 49.7% (±9.2%) of the total repertoire in PD1− and PD1+CD8+ T cells, respectively, and was in the range of 2.7%–16.2% for the CD4+ T cell and Treg fractions (figure 1C).

Characteristics of the TCRβ repertoire before and after DC-therapy. Analysis of 25 000 TCRβ sequence reads (for the total CD3+ T cell fraction) and 2000 TCRβ sequence reads (for all other T cell fractions indicated). (A) Average clone size, shown as the average numbers of reads per clone; (B) numbers of highly expanded TCRβ clones (HECs) retrieved; (C) impact of all HECs on the total repertoire; (D) impact of the first dominant clone on the total repertoire. Each symbol represents values for a sorted T cell fraction, either pre-DC-therapy (closed circle) or post-DC-therapy (open circle). Paired samples are shown connected by black lines. Significance after paired t-test is shown in each graph, with *p<0.05. P values were corrected for multiple testing, using the Benjamini and Hochberg False Discovery Rate. DC, dendritic cell; TCRβ, T cell receptor β.
Importantly, DC-therapy mainly induced changes in the PD1+CD8+ T cell population, as specifically in this fraction—and not in any of the other subpopulations—the average TCRβ clone size tended to be increased. Additionally, the numbers of retrieved HECs significantly decreased, and the impact of the first dominant clone increased after DC-therapy (figure 1A–D). We saw this DC therapy-induced increase in the impact of dominant clones also when we analyzed the top five or 10 HECs (data not shown). This indicates that the most dominant clones increased in impact at the cost of the less dominant clones, apparently without affecting the cumulative impact of the HECs on the total repertoire.
High average TCRβ clone sizes prior to DC-therapy correlate with favorable clinical responses
When we investigated the total CD3+ T cell fractions in more detail, we found that DC-therapy had no detectable effect on the impacts of the clonal sizes, Vβ usage, Vβ-Jβ recombination frequencies, mean TCRβ CDR3 length or charge (see online supplementary figure S3A–E). Interestingly, the values for the average TCRβ clone size in the total CD3+ T cell fractions prior to DC-therapy were positively correlated with both OS (p=0.0186; r2=0.57) and progression free survival (PFS) (p=0.0227; r2=0.52) (figure 2A,B). Such a positive correlation was not observed after DC-therapy (see online supplementary figure S4A,B). We also did not find correlations between OS or PFS and TCRβ clone size in the CD4+, CD8+ T cells or Treg subpopulations (data not shown).
Supplemental material
Supplemental material

TCRβ clone sizes in total CD3+ T cells prior to DC-therapy correlate with favorable clinical responses. (A, B) Scatter plots of the number of reads per CD3+ T cell clone pre-DC-therapy (x-axis) versus the overall survival in months (y-axis in A) and the progression free survival in months (y-axis in B). Linear regression curve fitting, p values and r2 are shown for each graph. DC, dendritic cell.
DC-therapy selectively induces expanding and newly appearing PD1+CD4+ and PD1+CD8+ T cell clones
Next, we linked the TCRβ sequences present in the total CD3+ T cell fraction to those in the sorted T cell subpopulations, using their unique CDR3 sequences. When we focused on the 25 most dominant TCRβ clones present in the CD3+ T cell population, we observed that for all patients the majority of these clones could be retrieved in multiple T cell subpopulations, particularly in both the PD1+ and in the PD1−CD8+ T cell fraction. The TCRβ clone distribution over the T cell subpopulations was similar in pre-DC-therapy and post-DC-therapy samples (figure 3A). For all patients only a small proportion of the clones were retrieved in the CD3+ T cells only.
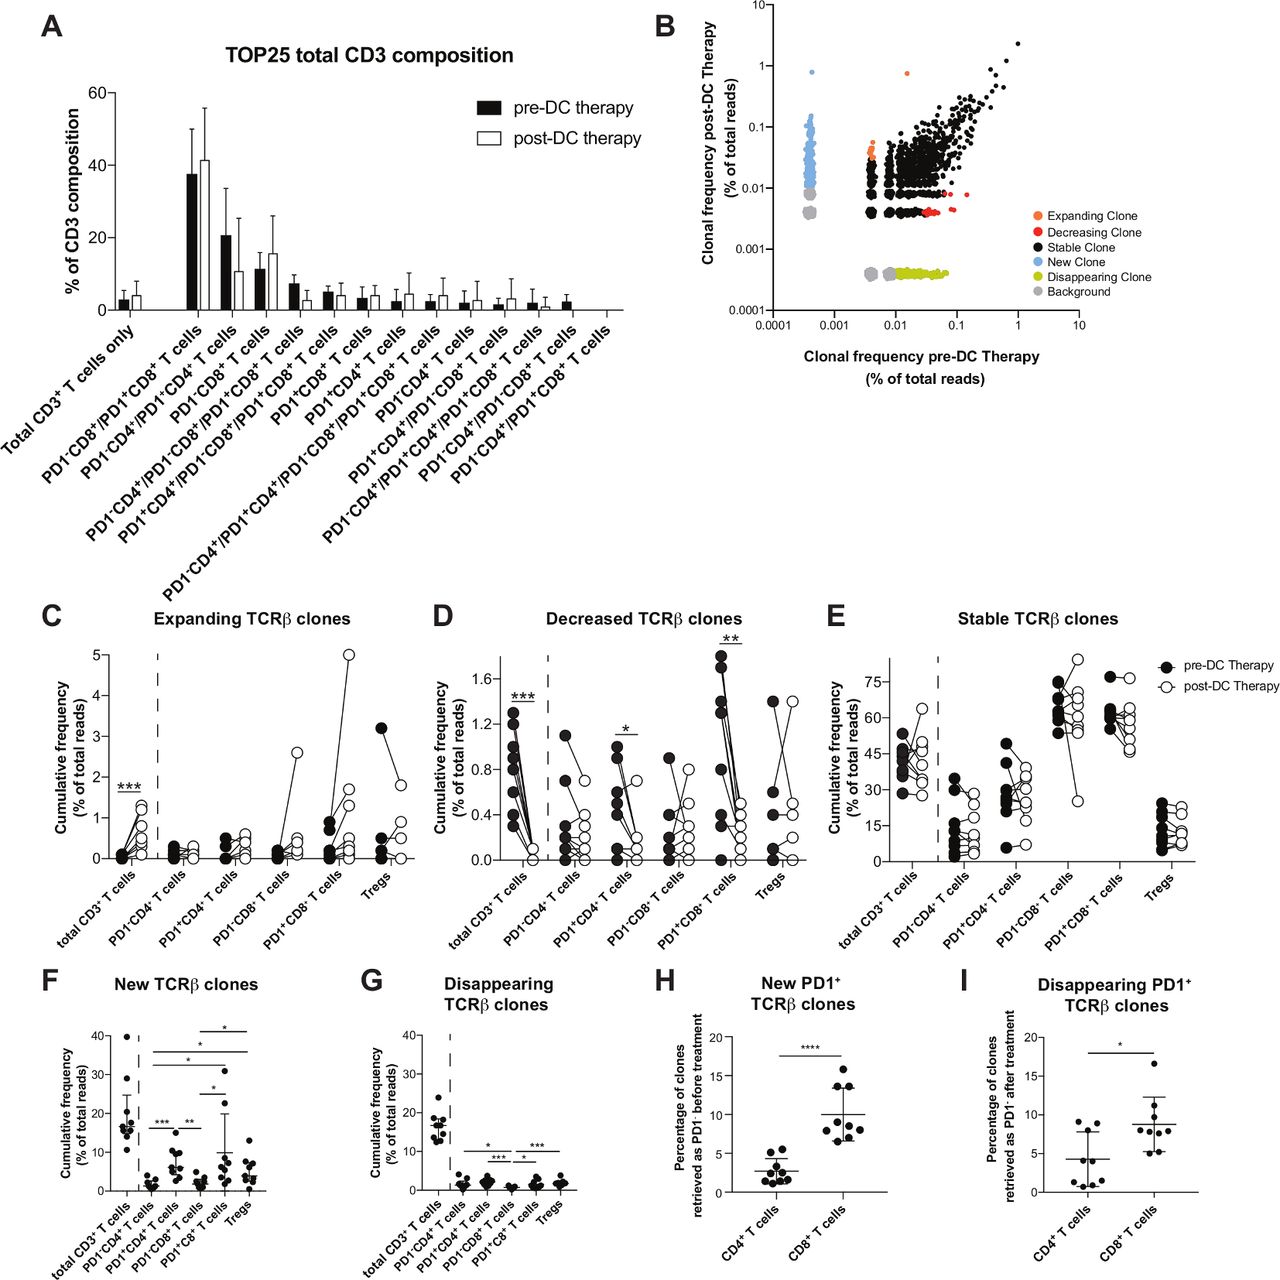
Clonal changes in the TCRβ repertoire after DC-therapy. (A) Composition of the 25 most dominant TCRβ HECs in the CD3+ T cell repertoire. Data for all individuals are plotted as mean values and SD using black bars for the repertoire pre-DC-therapy and white bars for the repertoire post-DC-therapy. (B) Representative plot showing the degree of overlap between the repertoire pre-DC-therapy (x-axis) and the repertoire post-DC-therapy (y-axis) in a total CD3+ T cell sample. Each dot represents one TCRβ clone and its clonal frequency in the total repertoire is shown as the percentage of the total number of 25 000 reads in the sample. Clones are color coded, as indicated, according to their differential expression defined in Materials and Methods. Gray dots with a frequency <0.01% were classified as background. (C, D, E) Cumulative frequencies of expanding (C), decreasing (D) and stable (E) clones present in the indicated T cell subpopulations pre-DC-therapy (closed circle) and post-DC-therapy (open circle). Paired samples are shown connected by black lines. Significance of paired t-test is shown in each graph; **p<0.01 and ***p<0.001. (F, G) Cumulative frequencies of newly appearing (F) and disappearing (G) CD3+ T cell clones after treatment. (H, I) Percentage of the newly appearing (H) and disappearing (I) PD1+ clones that are found as PD1− before treatment, both in CD4+ and CD8+ T cells. Significance of t-test is shown in each graph; *p<0.05, **p<0.01 and ***p<0.001. P values were corrected for multiple testing, using the Benjamini and Hochberg False Discovery Rate. DC, dendritic cell; TCRβ, T cell receptor β chain.
To explore the differences in TCRβ repertoire prior-DC-therapy and post-DC-therapy, for each patient the TCRβ clones present in the total CD3+ T cell fractions were classified into five groups, based on their presence and fold change in clonal frequency: expanding, decreasing, stable, newly appearing and disappearing clones (figure 3B). Subsequently, the presence of these five groups of clones was analyzed in the individual sorted T cell fractions.
The TCRβ clones in the total CD3+ T cell populations that expanded on DC-therapy, were also expanded in the PD1− and PD1+CD8+ T cell fractions (figure 3C). Decreasing TCRβ clones were mainly retrieved in the PD1+CD4+ and PD1+CD8+ T cell fractions (figure 3D). Stable TCRβ clones in the total CD3+ T cell populations had the largest cumulative frequency in the PD1− and PD1+CD8+ T cell fractions (figure 3E), which was likely a reflection of the high average clone sizes and high numbers of HECs within CD8+ T cells (figure 1A,B).
TCRβ clones that were newly induced were particularly retrieved in the PD1+CD4+ and PD1+CD8+ T cell fractions (figure 3F). Disappearing TCRβ clones were present in all T cell fractions, but remarkably low in the PD1−CD8+ T cell fractions (figure 3G).
To identify therapy-induced PD1 expression, we investigated whether new PD1+ clones within the CD4+ or CD8+ T fractions could be retrieved in corresponding PD1− T cell fractions prior DC-therapy. Only small proportions of the new TCRβ clones in the post-therapy CD4+ and CD8+PD1+ T cell subpopulations (~2.7% and ~10%, respectively) were retrieved in the corresponding PD1− T cell fractions (figure 3H). PD1 expression was apparently lost in ~4.3% of CD4+ T cells and ~8.8% of CD8+ T cells (figure 3I).
Taken together, we observed that DC-therapy mainly induced TCRβ changes, involving expanding, newly appearing and decreasing clones, in the PD1+CD4+ and PD1+CD8+ T cell subpopulations. Conversion from a PD1− to a PD1+ phenotype or vice versa was significantly more frequent in CD8+ than in CD4+ T cells.
Numbers of expanding PD1+CD8 + T cells clones correlate with clinical response to DC-therapy
Because DC-therapy mainly affected the TCRβ repertoires of PD1+CD4+, PD1+CD8+ and Treg cell fractions, we investigated the characteristics of these subpopulations in more detail. Only minor changes were found in Vβ gene usage, CDR3 charge and length between the five categories of TCRβ clones in these T cell subpopulations (see online supplementary figure S5). When we compared the amino acid sequences deduced from the RNA sequences of the new and expanding TCRβ clones across the nine patients, we identified no shared expanded clones and 13 shared new clones (see online supplementary table S1).
Supplemental material
Supplemental material
The numbers of expanding clones did not differ significantly between PD1+CD4+ T cells, PD1+CD8+ T cells and Tregs (see online supplementary figure S6A). The numbers of decreased and stable PD1+CD8+ clones were significantly higher than decreased and stable PD1+CD4+ or Treg clones (see online supplementary figure S6B,C). The numbers of new and disappearing PD1+CD8+ T clones were significantly lower than new and disappearing PD1+CD4+ T cells or Tregs (see online supplementary figure S6D,E). This is in line with the higher average number of reads per clone and the high impact of HECs in PD1+CD8+ T cells (figure 1A).
Supplemental material
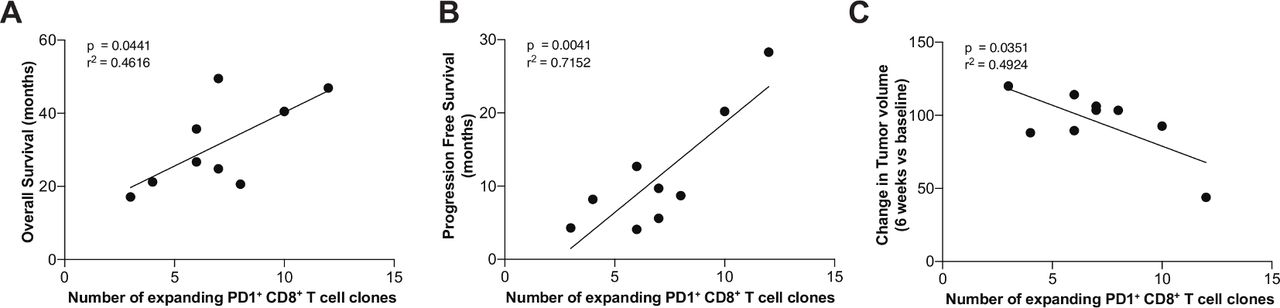
Next, we assessed whether these TCRβ repertoire features were associated with clinical response. Strikingly, the number of expanding PD1+CD8+ T cell clones significantly correlated with both OS (p=0.0441; r2=0.4616), PFS (p=0.0041; r2=0.7152) and radiographical change in tumor volume, measured at ~6 weeks after DC-therapy (p=0.0351; r2=0.4924) (figure 4A–C). In contrast, these correlations were not observed with the number of expanding PD1+CD4+ T cell clones (see online supplementary figure S7) or Tregs, nor in any of the other TCRβ clone categories (data not shown).
Supplemental material

Correlations of TCRβ chain repertoires changes after dendritic cell-therapy with clinical outcome. (A, B, C) Number of expanding PD1+CD8+ T cell clones after treatment versus overall survival in months (A), progression free survival in months (B) and the change in tumor volume at 6 weeks after treatment versus baseline (in C). Linear regression curve fitting, p values and r2 are shown for each graph.
In conclusion, the number of expanding PD1+CD8+—but not PD1+CD4+—T cell clones in MPM patients induced by DC-therapy significantly correlated with clinical response. This indicates that clinical efficacy of DC-therapy depends on a pre-existing PD1+CD8+ T cell response.
Discussion
Immunotherapeutic strategies have been shown to activate the immune system and to boost tumor-specific immune responses,2 but not all patients show clinical improvement. Sensitive methods to monitor the immune response after treatment and biomarkers predicting clinical benefit are scarce. To the best of our knowledge, we are the first to investigate TCRβ repertoire changes induced by DC-mediated immunotherapy in different T cell subpopulations. We studied peripheral blood samples from nine MPM patients who received autologous DCs loaded with allogeneic tumor lysate derived from cultured human MPM cell lines. This treatment strategy showed feasibility and promising clinical activity and immunological responses.11 12
For each patient we analyzed 70 000 TCRβ sequences to characterize the TCRβ repertoire composition before and 5 weeks after the start of DC-therapy. We analyzed total CD3+ T cells and five fluorescence-activated cell sorting (FACS)-sorted subpopulations: PD1− and PD1+CD4+ and CD8+ T cells and CD25+CD127low Tregs. This analysis revealed that limited TCRβ repertoire diversity in total CD3+ T cells (inferred from a high number of reads per clone) before the start of immunotherapy was associated with a better clinical response. DC-based immunotherapy induced TCRβ repertoire changes particularly in the PD1+CD4+ and PD1+CD8+ T cell subpopulations. These included expansion, contraction, appearance and disappearance of TCRβ clones, as well as apparent conversions from PD1− into PD1+ and vice versa. Immunotherapy-induced repertoire changes were more extensive in PD1+CD8+ T cells, given the significant increase in average clone size (figure 1A), changes in the numbers and impact of HECs (figure 1B,C) and the high levels of dynamics of PD1 expression (figure 3G,H). Importantly, the number of expanding PD1+CD8+—but not PD1+CD4+—T cell clones following immunotherapy positively correlated with OS, PFS and reduction of tumor volume. From these findings, we conclude that TCRβ repertoire profiling in both total CD3+ T cells and sorted T cell subsets could serve as predictive biomarker for clinical response in MPM patients to immunotherapy. Further studies including larger patient groups should show which of the two parameters correlates best with clinical outcome. We previously reported that all patients revealed strong responses to DCs loaded with tumor lysate and keyhole limpet hemocyanin 48 hours after DTH skin testing, providing evidence that DC-based immunotherapy is capable of inducting immunological response to tumor cells. This may also be supported by our current finding of 13 newly appearing clones that are shared between patients.
Our observation that a high average baseline TCRβ clone size is beneficial for a clinical response in MPM is in line with similar findings following anti-CTLA-4 treatment in pancreatic ductal adenocarcinoma patients13 and following anti-PD1 treatment in melanoma patients.22–24 Thus, the presence of circulating expanded T cell clones is generally beneficial for the clinical response to immunotherapy, irrespective of the treatment approach. Future studies should show whether these clones reflect a pre-existing tumor-specific T cell response. By contrast, in metastatic breast cancer patients low TCR diversity in conjunction with lymphopenia predicts poor OS, indicating that TCR diversity might reflect a measure of immunological fitness.25
DC-based immunotherapy in MPM patients induced selective expansion of TCRβ clones and a diversification of the repertoire driven by newly appearing clones, paralleling published observations in melanoma patients.20 Likewise, the number of expanding clones was increased in responding NSCLC patients treated with radiation therapy and CTLA-4 blockade,14 although in contrast to our study the T cell subset in which this expansion was most prominent was not determined. It is interesting that the frequency of expanding PD1+CD8+ T cells was highest in the MPM patient with a substantial tumor volume reduction of ~70%. Also, when patients with pancreatic ductal adenocarcinoma were treated with anti-CTLA-4 antibodies, it was observed that patients with >100 expanded clones survived nearly three times longer than patients with lower numbers of expanding clones.13
Thus, TCR diversity have previously been correlated with clinical outcome for checkpoint inhibitor immunotherapy.13 14 22 24 26 In this context, it is important to note that clinical studies using checkpoint inhibitors of CTLA-4 and PD1 were unsuccessful in mesothelioma, according the recently presented PembROlizuMab Immunotherapy Versus Standard Chemotherapy for Advanced prE-treated Malignant Pleural Mesothelioma (PROMISE-meso) trial and the DETERMINE study, wherein the effectivity of Tremelimumab (anti-CTLA-4) as second or third-line treatment was investigated in relapsed malignant mesothelioma patients.3 Therefore, it is important that a limited TCRβ repertoire diversity in total CD3+ T cells correlates with clinical benefit not only in checkpoint-inhibitor treatment, but also in DC-mediated immunotherapy.
Our TCRβ repertoire analysis showed that DC-therapy mainly shapes the PD1+CD8+ T cell population and that the clinical response to therapy is particularly linked to CD8+ T cell function. Therefore, it seems valuable to profile TCR repertoire changes in specific T cell subsets, certainly because correlations between TCR repertoire changes and clinical outcome may be obscured by differential effects of immunotherapy on individual T cell subpopulations. We chose to separately analyze the TCR repertoire in PD1− and PD1+ T cells, because this coinhibitory marker is not only a hallmark of exhausted T cells, but it is also transiently expressed on activated T cells and identifies the CD8+ tumor-reactive repertoire.27 Given the limited number of patients analyzed in this study, our findings need to be validated in a larger and independent DC-therapy cohort. Validation studies in a larger cohorts, will indicate which predictive TCR parameter correlates best with clinical outcome, and should indicate additional associations between demographic data and clinical response.
In summary, with this study we showed that DC-therapy in MPM patients specifically induced TCRβ repertoire changes in PD1+CD8+ T cells that correlate with clinical outcome. Additionally, high average TCRβ clone sizes in total CD3+ T cells before the start of immunotherapy were associated with a better clinical response. Therefore, TCRβ repertoire profiling in both total CD3+ T cells as sorted T cell subsets could serve as a biomarker to monitor or to predict the responses of patients to treatment.
References
Footnotes
HV and GB are joint first authors.
Twitter @Ilssjuh
Correction notice Since the online publication of this article, the article was updated to show that shared first authorship is shared between Heleen Vroman and Giulia Balzaretti.
Contributors HV, GB, PLK, JGJVA, NdV and RWH designed the project. HV, MvN, GB and ITGN performed experiments, HV and GB analyzed data. BDvS assisted with the bioinformatical acquisition of the data. RB, RC and JGJVA performed patient selection, clinical trial design and provided the clinical data. HV, GB and RWH wrote the manuscript. All patients have read and approved the final manuscript.
Funding This work was carried out on the Dutch national e-infrastructure with the support of SURF Foundation. This study was funded financially by a KWF/ZonMW grant (nr 95104006) and by Amphera BV, The Netherlands.
Competing interests JGJVA reports receiving commercial grants from Amphera, holds ownership interests (including patents) in Amphera BV, and is a consultant/advisory board member for Amphera.
Patient consent for publication Not required.
Ethics approval The study was approved by the Central Committee on Research involving Human Subjects (NL4433000014) as defined by the Medical Research Involving Human Subjects Act. Procedures followed were in accordance with the ethical standards of these committees on human experimentation and with the Helsinki Declaration of 1975, as revised in 2008.
Provenance and peer review Not commissioned; externally peer reviewed.
Data availability statement Data are available upon reasonable request. All data relevant to the study are included in the article or uploaded as supplementary information. All data associated with this research are present in the paper or the Supplementary Materials.