Article Text

Abstract
Background Natural killer (NK) cells can recognize and kill cancer cells directly, but their activity can be attenuated by various inhibitory molecules expressed on the surface. The expression of epithelial cell adhesion molecule (EpCAM), a potential marker for cancer stem cells (CSCs), is known to be strongly associated with poor clinical outcomes in hepatocellular carcinoma (HCC). NK cells targeting CSCs may be a promising strategy for anti-tumor therapy, but little is known about how they respond to EpCAMhigh CSCs in HCC.
Methods EpCAM expression was assessed by immunohistochemistry in 280 human HCC tissues obtained from curative surgery. To investigate the functional activity of NK cells against liver CSCs, EpCAMhigh and EpCAMlow Huh-7 cells were sorted by flow cytometry. The functional role of carcinoembryonic antigen-related cell adhesion molecule 1 (CEACAM1), which is related to NK cells, was determined by in vitro co-culture of NK cells and hepatoma cells using Hepa1–6 mouse hepatoma cells, as well as in vivo experiments using C57/BL6 mice.
Results The frequency of recurrence after curative surgery was higher in patients with positive EpCAM expression than in those with negative EpCAM expression. In subsequent analysis based on the anatomical location of EpCAM expression, patients with peritumoral EpCAM expression showed worse prognosis than those with pantumoral EpCAM expression. Co-culture experiments demonstrated that CEACAM1 was upregulated on the surface of EpCAMhigh HCC cells, resulting in resistance to NK cell-mediated cytotoxicity. Inversely, silencing CEACAM1 restored cytotoxicity of NK cells against EpCAMhigh Huh-7 cells. Moreover, neutralizing CEACAM1 on the NK cell surface enhanced killing of Huh-7 cells, suggesting that homophilic interaction of CEACAM1 is responsible for attenuated NK cell–mediated killing of CEACAM1high cells. In mouse experiments with Hepa1–6 cells, EpCAMhigh Hepa1–6 cells formed larger tumors and showed higher CEACAM1 expression after NK cell depletion. NK-mediated cytotoxicity was enhanced after blocking CEACAM1 expression using the anti-CEACAM1 antibody, thereby facilitating tumor regression. Moreover, CEACAM1 expression positively correlated with EpCAM expression in human HCC tissues, and serum CEACAM1 levels were also significantly higher in patients with EpCAM+ HCC.
Conclusion Our data demonstrated that EpCAMhigh liver CSCs resist NK cell–mediated cytotoxicity by upregulation of CEACAM1 expression.
- immunology
- gastroenterology
- oncology
- molecular biology
- tumors
This is an open access article distributed in accordance with the Creative Commons Attribution Non Commercial (CC BY-NC 4.0) license, which permits others to distribute, remix, adapt, build upon this work non-commercially, and license their derivative works on different terms, provided the original work is properly cited, appropriate credit is given, any changes made indicated, and the use is non-commercial. See http://creativecommons.org/licenses/by-nc/4.0/.
Statistics from Altmetric.com
Background
Hepatocellular carcinoma (HCC) is the second leading cause of cancer-related death and the fifth most common malignancy in the world.1 2 After decades of failure with immune therapy, the recent use of immune checkpoint inhibitors has demonstrated effectiveness in patients with advanced stage HCC.3 However, the response rate of the anti-programmed death 1 agent nivolumab continues to be below 20% in both sorafenib-naive and sorafenib-experienced patients with advanced HCC.4 Moreover, recently disclosed results of phase III clinical trials showed that nivolumab as monotherapy failed to meet the primary objectives as a first-line treatment in advanced HCC.5 Therefore, there is an urgent need for new methods that can harness anti-tumor immune response for treating HCC.6
Natural killer (NK) cells are essential lymphocytes that can kill virus-infected and cancer cells.7–9 NK cells perform crucial functions during early HCC development. NK cells are defined as CD3−CD56+ cells in humans and as CD3−NK1.1+ or CD3−NKp46+ cells in mice.10 An active balance between signals from activating and inhibitory receptors regulates NK cell functions.11 Large populations of NK cells expressing high levels of activating receptors and low levels of inhibitory receptors are involved in HCC control.12 13 Furthermore, there is a positive correlation between the density of infiltrating intratumoral NK cells and overall survival in patients with HCC.12 14 Nonetheless, intratumoral NK cells in HCC exhibit defective interferon-gamma (IFN-γ) and tumor necrosis factor-alpha (TNF-α) secretion, indicating the need for endogenous stimulation of NK cells or adoptive NK cell therapy in patients with this tumor.14
Cancer stem cells (CSCs), described as a small subset of cancer cells with the ability of self-renewal, can produce differentiated progeny.15 These cells account for relapse, metastasis, and chemo-resistance in cancer; thus, CSCs are promising targets for cancer therapy.16 The CSC biomarkers for HCC include the epithelial cell adhesion molecule (EpCAM), CD90, CD44, CD133, CD24, and CD13; some of these may functionally support actual liver CSC phenotypes.15 17 18 Among CSC biomarkers, EpCAM is a type I transmembrane glycoprotein that acts as a calcium-independent homophilic cell adhesion molecule.19 EpCAM directly influences the cell cycle and cell proliferation, acting as a transcription factor by activating c-myc, cyclin A, and cyclin E.19 EpCAM+ HCC cells obtained from cell lines and tumor specimens are highly invasive and tumorigenic, thereby implicating EpCAM as a useful biomarker for survival outcome in HCC.18 20 21 High levels of EpCAM expression in HCC have been associated with the clinicopathological features of the disease, including high alpha-fetoprotein (AFP) levels and poor differentiation.22
The vulnerability of CSCs to NK cells is not completely understood. Earlier studies indicated the diminished immunogenic nature of CSCs in comparison with non-CSCs, based on downregulated expression levels of MHC class-I (MHC-I), thereby indicating the vulnerability of CSCs to NK-cell targeting.23 The susceptibility of CSCs to NK attack is also thought to be due to the activation of natural cytotoxicity receptors, particularly NKp30 and NKp44.23 Several preclinical studies have demonstrated a promising role for NK immunotherapy in preferential targeting of CSCs.24 Nonetheless, there are no studies on the cytotoxicity of NK cells against CSCs in HCC. In this study, we investigated whether NK cells exhibited enhanced or decreased cytotoxicity against EpCAMhigh liver CSCs, and we determined the underlying mechanism involved.
Methods
Patient samples and clinical information
The medical records of all patients who underwent surgical interventions at our institution between January 2012 and December 2017 were reviewed. Individual patient consent was waived due to the retrospective nature of this study with the approval of the Institutional Review Board of Seoul St. Mary’s Hospital. Two hundred and twelve patients with HCC who had undergone curative surgical treatment were enrolled in this study. All patients were followed up until December 2018. The diagnosis of HCC was based on the results of various imaging modalities and tumor biomarkers according to the latest international guidelines, including those from the American Association for the Study of Liver Diseases and the European Association for the Study of the Liver.1 2 All patients were pathologically confirmed as having HCC after surgery. Liver resection and transplant were performed as described previously.25 ELISA for CEACAM1 protein in patients’ sera was performed as previously described.26
Cell culture
Huh-7, HepG2, K562, and Hepa1–6 cells were grown in Dulbecco’s Modified Eagle’s Medium (DMEM; Invitrogen, Carlsbad, CA, USA) with 10% fetal bovine serum (Invitrogen), 100 µg/mL penicillin, and 0.25 µg/mL streptomycin (Invitrogen). Hep3B cells were grown in minimum essential medium (MEM; Invitrogen, Carlsbad, CA, USA) with 10% fetal bovine serum (Invitrogen), 100 µg/mL penicillin, and 0.25 µg/mL streptomycin (Invitrogen). All cell lines were maintained at 37°C and 5% CO2. Huh-7, HepG2, Hep3B, and K562 cell lines were purchased from American Type Culture Collection.
Transduction of shRNA-CEACAM1-lentiviruses
Huh-7 cells were grown in DMEM (Invitrogen) with 10% fetal bovine serum (Invitrogen), 100 µg/mL penicillin, and 0.25 µg/mL streptomycin (Invitrogen) at 37°C and 5% CO2. Short hairpin RNA (shRNA)–transduced cells were grown in a complete medium containing 1 µg/mL puromycin (Sigma-Aldrich, St. Louis, MO, USA). Using the shRNA method to knock out expression of CEACAM1, two different types of shRNA-CEACAM1 lentiviral constructs with confirmed sequences were purchased from Sigma-Aldrich. The sequences of these shRNA are as follows: CCGGCTATCACTCTAATTCGGATTTCTCGAGAAATCCGAATTAGAGTGATAGTTTTTG and CCGGCCACCTAACAAGATGAATGAACTCGAGTTCATTCATCTTGTTAGGTGGTTTTTG. MISSION shRNA lentiviral vector (Sigma) was transduced into the Huh-7 cells. After 48 hours, 1 µg/mL of puromycin was added to the cells, which were grown over a period of 4 weeks in puromycin-containing complete medium until a stable phenotype was achieved.
Cytotoxicity and degranulation assay
Peripheral blood mononuclear cells (PBMCs) from adult healthy donors were isolated using Ficoll–Hypaque density gradient centrifugation as previously described.27 NK cells were separated from PBMCs using the OctoMACS starting kit (Miltenyi Biotec, Auburn, CA, USA) as described previously.27 The hepatoma cells were cultured in a 24-well plate for 24 hours. Then, isolated human NK cells were added at different effector-to-target ratios. Subsequently, 1 ng/mL each of human recombinant interleukin-12 (IL-12) was added. After an additional 6 hours of incubation at 37°C, cytotoxicity was analyzed by staining with TO-PRO-3 iodide. For a positive control, cells were killed by freeze–thaw exposure (−70°C for 10 min). For the degranulation assay, hepatoma cells (1×10⁵ cells/well) were cultured in a 24-well plate for 24 hours. Then, target cells were co-cultured with NK cells at various effector-to-target ratios. Anti-CD107a-PE (20 µL) was added to each culture, and after 6 hours of incubation NK cells were stained for the surface biomarkers CD3 and CD56, as well as with LIVE/DEAD Fixable Red Dead Cell Stain Kit (ThermoFisher Scientific, Waltham, MA, USA) for 30 min in the dark at 4°C. The degranulation assay was performed using flow cytometry.
For the antibody-mediated blocking experiments, anti-CEACAM1 antibody (D14HD11; Abcam, Cambridge, UK) or isotype control antibody were used at 20 µg/mL. Prior to co-culture experiments, the blocking antibodies were treated to either hepatoma cells or NK cells for 1 hour at 37°C. To block CEACAM1 exclusively on hepatoma cells or on NK cells, 3 washes with PBS were followed to remove free and loosely attached antibodies.
Flow cytometry
The following commercially available antibodies were used for multi-color flow cytometry: BV510-conjugated anti-CD3, PE-conjugated anti-CD107a, APC-conjugated anti-ICAM1, PE-conjugated anti-EpCAM, PE-conjugated anti-CD13, FITC-conjugated anti-CD44, FITC-conjugated anti-CD90, PE-conjugated anti-CD133 (BD Biosciences, San Jose, CA, USA), APC-conjugated anti-CD56 (Miltenyi Biotec), APC-conjugated anti-MHC-1, APC-conjugated anti-ULBP-1, APC-conjugated anti-ULBP-2/5/6, APC-conjugated anti-ULBP-3, APC-conjugated anti-TRAIL-R1 (R&D Systems, Minneapolis, MN, USA), APC-conjugated anti-CEACAM1, APC-conjugated anti-HLA-G, and APC-conjugated anti-MICA/B (Biolegend, San Diego, CA, USA). Dead cells were excluded using the LIVE/DEAD red fluorescent reactive dye (Invitrogen). For some experiments, surface marker–stained cells were permeabilized using a Foxp3 Staining Buffer Kit (eBioscience) and further stained for PE-conjugated anti-aldehyde dehydrogenases (ALDH) (Sino Biological, PA, USA). Multi-color flow cytometry was performed using the Canto II instrument (BD Biosciences), and data were analyzed using the FlowJo software (TreeStar, Ashland, OR, USA).
Immunoblotting
Cell lysates were prepared, and 20 µg of each lysate was loaded onto SDS-PAGE gels and analyzed by immunoblotting as previously described.28 The antibodies used for the immunoblots were as follows: rabbit monoclonal anti-CEACAM1 (D1P4T; Cell Signaling Technology, Danvers, MA, USA), rabbit polyclonal anti-EpCAM (Abcam), rabbit polyclonal anti-Bcl-xL, rabbit polyclonal anti-cleaved caspase-3, rabbit polyclonal anti-mTOR (Cell Signaling Technology), mouse monoclonal anti-β-actin, and rabbit polyclonal anti-GAPDH (Sigma-Aldrich). After blotting, membranes were incubated with primary antibodies (diluted at 1:200 to 1:2000) overnight at 4°C. The signal was detected using a horseradish peroxidase-conjugated secondary antibody with enhanced chemiluminescence reagents (GE Healthcare, Buckinghamshire, UK). The density of each band was measured using Multi Gage imaging software (Raytest). Full blot images are shown in the online supplementary information.
Supplemental material
In vivo mouse model
Syngeneic models of HCC were made by injection with 5×10⁶ or 1×10⁶ Hepa1–6 cells (mouse liver cancer cells) into the flank of 6-week-old C57BL/6 mice. Subsequently, anti-NK1.1 (Invitrogen) and anti-CEACAM1 (NOVUS, Centennial, CO, USA) antibodies (20 µg) were injected according to a schedule. Tumor size was measured with a digital caliper and calculated by the formula LW2/2, where L is the length and W is the width. Tumor tissue was removed from the mouse using a scalpel and minced until it was almost liquid in consistency. Next, supernatant was removed, RBC lysis buffer was added, and the mixture was stored at 26°C for 3 min. After centrifuging at 1500 rpm for 5 min, the supernatant was removed, and 10 mL of 1× PBS was added to gently wash the pellet. Subsequently, the pellet was suspended in 200 µL of 1× PBS for fluorescence dyeing and FACS analysis.
The Korea Excellence Animal Laboratory Facility at the Korea Food and Drug Administration was accredited in 2007 by the Institutional Animal Care and Use Committee (IACUC) and the Department of Laboratory Animal (DOLA) at the Catholic University of Korea, Songeui Campus, and acquired full Assessment and Accreditation by Laboratory Animal Care International accreditation in 2018. All animal research procedures were conducted in accordance with the Laboratory Animals Welfare Act, the Guide for the Care and Use of Laboratory Animals, and the Guidelines and Policies for Rodent Experiments provided by IACUC in the School of Medicine at The Catholic University of Korea (Approval no. CUMS-2017-0322-02).
Immunohistochemistry and immunofluorescence
Paraffin-embedded blocks were sectioned (5 µm thickness) and transferred to silanized glass slides. The sections were then deparaffinised in xylene and rehydrated in a graded series of alcohol. Antigen retrieval was fulfilled by heating the sample in 0.01 M citrate buffer (pH 6.0) using a microwave vacuum histoprocessor (RHS-1; Milestone, Bergamo, Italy) at a final temperature of 121°C for 15 min. To block endogenous peroxidase activity, sections were blocked with 3% hydrogen peroxide in methanol for 10 min. Slides were incubated with mouse anti-CEACAM-1/CD66a (R&D Systems), anti-EpCAM (clone: MOC-31, Abcam), anti-CD45 (Abcam), and anti-CD56 (Abcam) antibodies, which were diluted to a ratio of 1:50 in Dako antibody diluent (Dako, Carpinteria, CA, USA) with background-reducing components at room temperature for 30 min. After washing, the Dako EnVision Plus system (Dako) was used at room temperature for 5 min. The immunoreaction was performed with diaminobenzidine for 5 min, followed by hematoxylin counterstaining. Immunofluorescence staining with confocal microscopy was performed as previously described with anti-CEACAM1 and anti-EpCAM antibodies.29
Statistical analysis
SPSS V.20 software was used for all analyses. The discrete variables were compared using the χ2 test, and independent t-test was used for continuous variables. Pearson’s correlation tests were performed to analyze correlations between two parameters. Statistical significance was defined as p value <0.05.
Results
EpCAM expression in the peritumoral region represents the highest frequency of recurrence after curative surgery of HCC
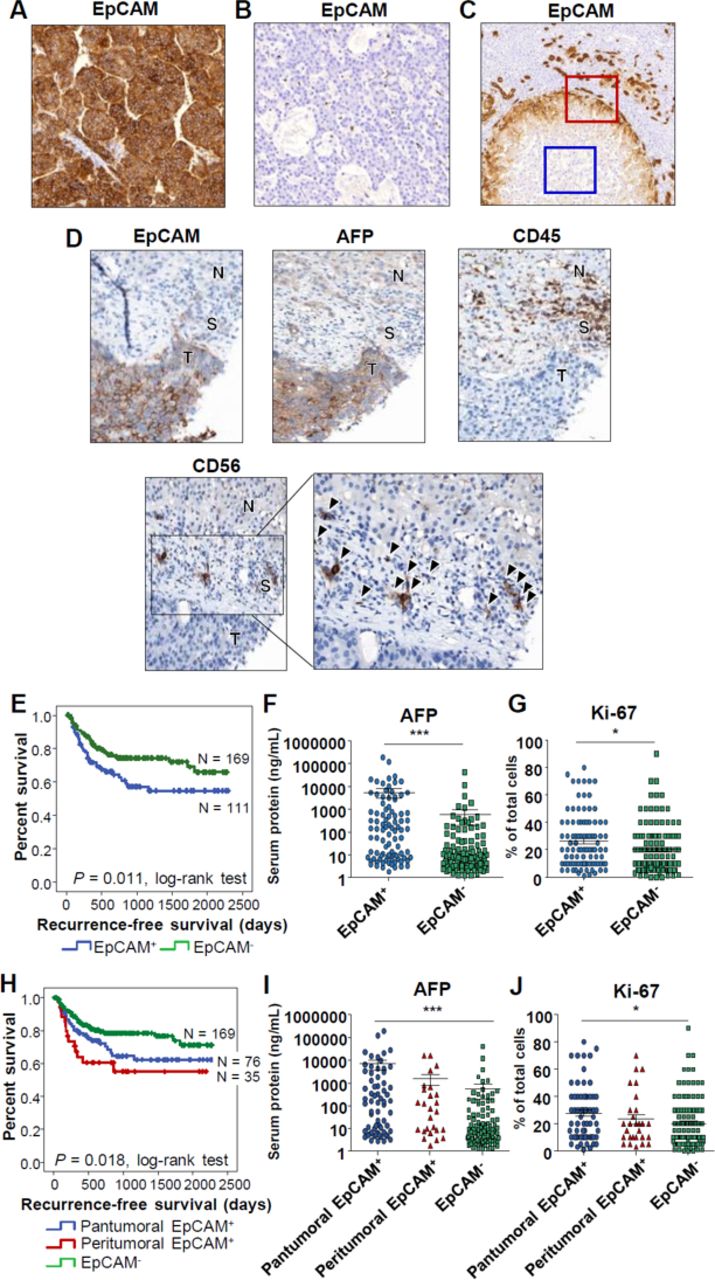
Immunohistochemical staining for EpCAM was performed in surgically removed human HCC tissues (figure 1A–C). Patterns of EpCAM expression were classified as pantumoral positive (A), negative (B), or peritumoral positive (C). Representative staining results for EpCAM and CD45 in normal liver and liver with acute viral hepatitis are presented in online supplementary figure 1A and 1B. HCC tissues with peritumoral EpCAM expression (figure 1C) had an “invasive front” with EpCAM-positive cells (red square), while cells in the intratumoral region were negative for the protein (blue square). Cells that were positively stained for EpCAM were confronting various immune cells expressing CD45, as well as NK cells expressing CD56, that had infiltrated the tumor stroma (figure 1D).
Supplemental material

Different patterns of EpCAM expression in human hepatocellular carcinoma (HCC) tissues and their association with tumor recurrence after curative surgery. (A–C) Patterns of EpCAM expression in 280 human HCC tissues: (A) pantumoral positive (n=76), (B) negative (n=169), and (C) peritumoral positive (n=35) (red square: invasive front, blue square: intratumoral region). (D) Patterns of EpCAM, CD45, and CD56 staining in EpCAM+ and AFP+ HCC. N, non-tumor liver; S, tumor stromal tissue; T, tumor. Many CD56+ NK cells are detected in the tumor stromal tissue (arrowhead). (E) Kaplan-Meier curve for recurrence-free survival of 280 patients with HCC after curative surgery according to the patterns of EpCAM expression: EpCAM+ and EpCAM– HCC. (F–G) Serum AFP and tumor Ki-67 expression in EpCAM+ and EpCAM– HCC. (H) Kaplan-Meier curve for recurrence-free survival of 280 patients with HCC after curative surgery according to the patterns of EpCAM expression: pantumoral EpCAM+, peritumoral EpCAM+, and EpCAM– HCC. (I–J) Serum AFP and tumor Ki-67 expression in pantumoral EpCAM+, peritumoral EpCAM+, and EpCAM– HCC.
Next, we performed survival analyses using patient information. Clinical characteristics of the enrolled patients are presented in table 1. Patients with EpCAM+ HCC showed shorter recurrence-free survival after curative surgery (figure 1E). Representative staining results for EpCAM and Ki-67 are presented in online supplementary figure 1C and 1D. Serum AFP levels and the percentage of Ki-67-expressing cells were higher in patients with EpCAM+ HCC (figure 1F and G). After subdividing the EpCAM+ patient group into pantumoral EpCAM+ and peritumoral EpCAM+ HCC groups, we found that the peritumoral EpCAM+ HCC group showed the shortest recurrence-free survival (figure 1H), although serum AFP levels and the percentage of Ki-67-positive cells were lower than those in the pantumoral EpCAM+ HCC group (figure 1I and J).
Baseline characteristics of enrolled patients
Attenuated NK cell-mediated cytolysis of EpCAMhigh Huh-7 cells
The expression of various cancer stem cell markers was checked in Huh-7 cells, and EpCAM, ALDH, CD13, and CD133 were found to be expressed in Huh-7 cells (figure 2A). Considerable numbers of EpCAM-expressing Huh-7 cells were positive for CD13 (99%) and CD133 (51%) (online supplementary figure 2). For the in vitro experiments, Huh-7 cells were stained with anti-EpCAM fluorescent antibody, and approximately 10% of the upper and lower populations (EpCAMhigh Huh-7 cells, EpCAMlow Huh-7 cells) in terms of fluorescence intensity were sorted using a FACS Aria III (figure 2B). Then, NK cell-mediated cytolysis was detected with the ratios of effector cells and target cells at 1:1 and 5:1, respectively. EpCAMhigh Huh-7 cells were more resistant to NK cell-mediated cytolysis than EpCAMlow Huh-7 cells were (figure 2C). The expression pattern of ligands that bind to NK cell receptors was investigated to determine the cause. Among them, CEACAM1, which is known to suppress the activity of NK cells, was found to be expressed at different levels in EpCAMhigh Huh-7 and EpCAMlow Huh-7 cells. EpCAMhigh Huh-7 cells expressed higher levels of CEACAM1 than EpCAMlow Huh-7 cells (figure 2D). Similar findings were observed in the other liver cancer cell lines, HepG2 and Hep3B (figure 2F). EpCAMhigh HepG2 cells were more resistant to NK-mediated killing (figure 2G). Immunoblotting was conducted to check the protein expression levels of EpCAMhigh and EpCAMlow in Huh-7 cells. The CEACAM1 protein level was found to be higher in EpCAMhigh Huh-7 cells than in EpCAMlow Huh-7 cells (figure 2H and I). Supplementary figures demonstrate that there is no significant difference in the expression of NK cell ligands according to other cancer stem cell markers such as CD13, CD133, and ALDH levels in Huh-7 cells (online supplementary figure 3), as well as in HepG2 cells (online supplementary figure 4).
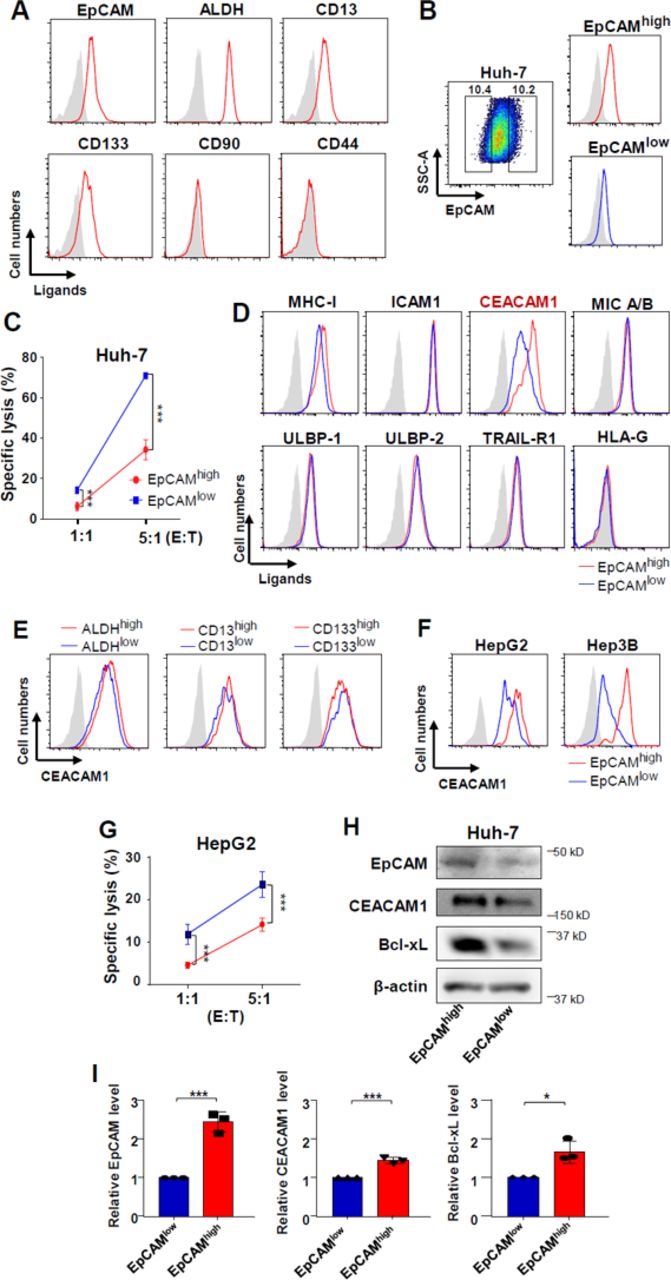
Attenuated NK cell–mediated cytolysis of EpCAMhigh Huh-7 cells. (A) Differential expression of various cancer stem cell markers in Huh-7 cells. Data are representative of five independent experiments. (B) Staining of cell surface EpCAM in Huh-7 cells and subdivision into EpCAMhigh and EpCAMlow cell populations. (C) Differential cytotoxicity of NK cells in EpCAMhigh and EpCAMlow Huh-7 cells. IL-12 was added during cytotoxicity experiments at 1 ng/mL. bar graphs represent the means±SEM (n=5). ***p<0.001. (D) Differential expression of ligands that bind to NK cell receptors on the surface of EpCAMhigh and EpCAMlow Huh-7 cells. Data are representative of five independent experiments. (E) CEACAM1 expression in CD13+, CD133+, ALDHhigh and CD13−, CD133−, ALDHlow Huh-7 cells. Data are representative of five independent experiments. (F) CEACAM1 expression in EpCAMhigh and EpCAMlow HepG2 and Hep3B cells. Data are representative of five independent experiments. (G) Differential cytotoxicity of NK cells in EpCAMhigh and EpCAMlow HepG2 cells. IL-12 was added during cytotoxicity experiments at 1 ng/mL. Bar graphs represent the means±SEM (n=5). (H) CEACAM1 protein levels in EpCAMhigh and EpCAMlow Huh-7 cells. Data are representative of three independent experiments. (I) Quantification of CEACAM1, Bcl-xL, EpCAM protein levels in EpCAMhigh and EpCAMlow Huh-7 cells. Bar graphs represent the means±SEM (n=3). *p<0.05, ***p<0.001.
Silencing CEACAM1 augments NK cell–mediated cytotoxicity in Huh-7 cells
To confirm the effect of CEACAM1 on NK cell–mediated cell death, lentiviral-mediated knock-down of CEACAM1 was performed, and stable cell lines were established by colony selection (figure 3A). There was no significant difference in cell viability between shCEACAM1 and shControl Huh-7 cells when treated with the tyrosine kinase inhibitor sorafenib (figure 3B). We performed additional experiments using CEACAM1high and CEACAM1low Huh-7 cells sorted using a FACS Aria III. Treatment with sorafenib did not result in any significant difference in cell viability between CEACAM1high and CEACAM1low Huh-7 cells (figure 3C). However, when treated with TNF-α and cycloheximide, increased apoptosis was noted in shCEACAM1 Huh-7 cells (figure 3D). When shControl and shCEACAM1 Huh-7 stable cell lines were co-cultured with activated NK cells, we observed increased cytotoxicity by NK cells in CEACAM1-silenced Huh-7 cells (figure 3E). Blocking CEACAM1 protein on the surface of Huh-7 cells with anti-CEACAM1 antibody enhanced killing of shControl Huh-7 cells, but not of shCEACAM1 Huh-7 cells, suggesting that our knock-down system is sufficient to demonstrate that cell surface CEACAM1 in Huh-7 cells is critical in NK-mediated killing (figure 3F). Interestingly, degranulation of NK cells was significantly higher when co-cultured with shCEACAM1 Huh-7 cells (figure 3G). However, there was no difference in expression of the ligands that bind to activating or inhibitory receptors of NK cells between shCEACAM1 and shControl Huh-7 cells (figure 3H). Moreover, CEACAM1 silencing did not have any influence on the expression of CSC markers in Huh-7 cells (online supplementary figure 5). Collectively, these data suggest that CEACAM1 silencing renders hepatoma cells vulnerable to apoptosis by cytotoxic stimuli and activates NK cells more vigorously during co-culture.
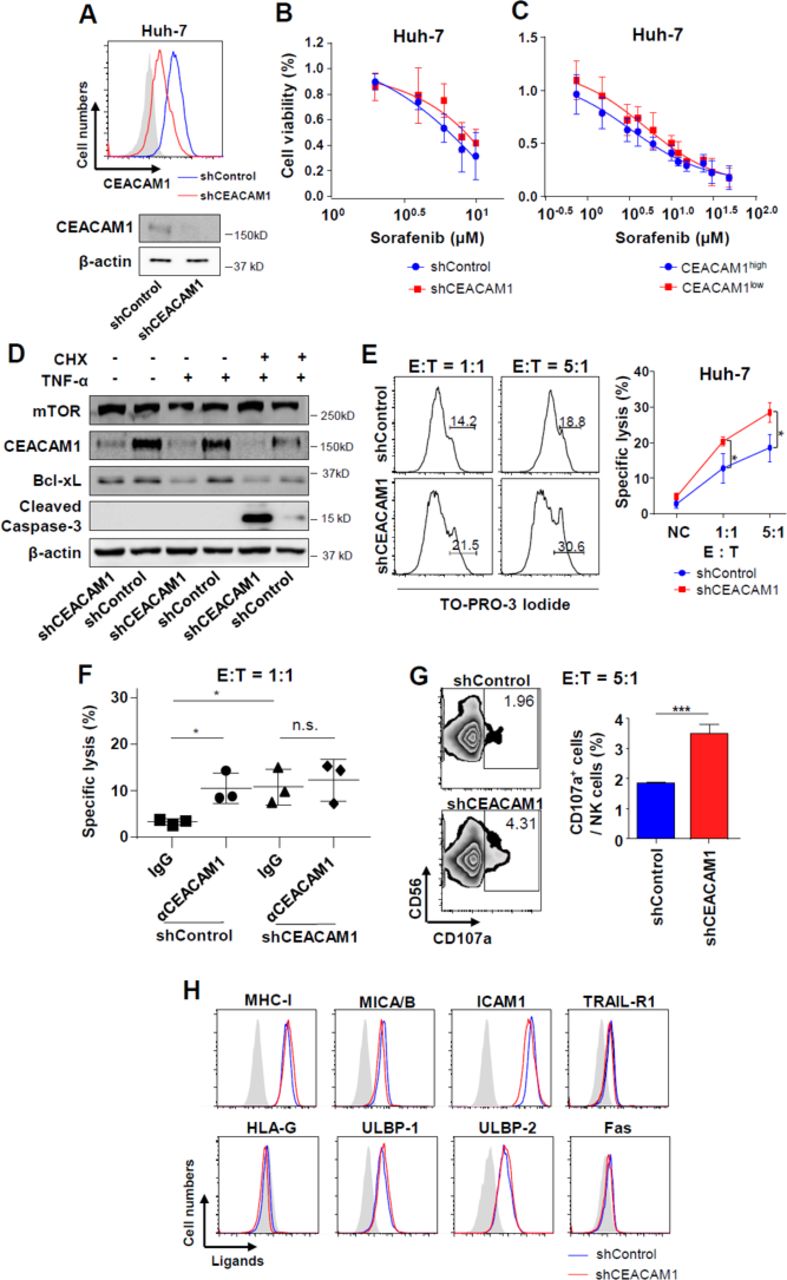
Differential NK cell–mediated cytotoxicity according to the level of CEACAM1 expression in Huh-7 cells. (A) Establishment of CEACAM1-silenced and control Huh-7 cell lines. Efficient knock-down was confirmed by flow cytometry and immunoblotting. (B) Sorafenib-induced cell death in CEACAM1-silenced and control Huh-7 cell lines. Bar graphs represent the means±SEM (n=3). (C) Sorafenib-induced cell death between CEACAM1high and CEACAM1low Huh-7 cells. Bar graphs represent the means±SEM (n=3). (D) Differential expression of proteins in apoptosis or cell survival after stimulation with CHX and TNF-α in CEACAM1-silenced and control Huh-7 cell lines. Data are representative of two independent experiments. (E) Differential cytotoxicity of NK cells in CEACAM1-silenced and control Huh-7 cell lines. Bar graphs represent the means±SEM (n=5). *p<0.05. (F) Differential cytotoxicity of NK cells in CEACAM1-silenced and control Huh-7 cell lines when CEACAM1 on the Huh-7 cells was blocked vs not blocked. Bar graphs represent the means±SEM (n=3). *p<0.05. (G) Differential expression of CD107a in NK when co-cultured with CEACAM1-silenced and control Huh-7 cell lines. Bar graphs represent the means±SEM (n=3). ***p<0.001. (H) Expression of ligands that bind to NK cells in CEACAM1-silenced and control Huh-7 cell lines. Data are representative of three independent experiments.
CEACAM1 blocking in NK cells results in the augmented killing of EpCAMhigh CSCs
Next, we investigated the receptor of tumor-expressing CEACAM1 on the surface of NK cells. The extracellular domains of CEACAM1 are essential for function, as they are required for homophilic interactions (CEACAM1-CEACAM1).30 CEACAM1 was expressed on the cell surface in both CD56bright and CD56dim NK cells, and expression increased following IL-12 treatment (figure 4A, B). To confirm the inhibitory effects of NK cell CEACAM1 on cell activation, NK cells treated with anti-CEACAM1 antibody were co-cultured with K562 cells at 1:1 and 5:1 ratios. Neutralization of CEACAM1 expression in NK cells resulted in significant increase in the lysis of K562 cells (figure 4C). At the same time, degranulation was higher when CEACAM1 was blocked in NK cells (figure 4D). NK cell-mediated cytotoxicity in Huh-7 cells was also higher after neutralization of CEACAM1 in NK cells (figure 4E). Finally, EpCAMhigh and EpCAMlow Huh-7 cells were co-cultured with NK cells with or without neutralization of CEACAM1 expression. NK-mediated cytotoxicity in EpCAMhigh cells was comparable with that in EpCAMlow cells after neutralization of CEACAM1 in NK cells. This suggests that CEACAM1 neutralization of NK cells may reverse resistance of EpCAMhigh liver CSCs to NK-mediated cytotoxicity (figure 4F).

CEACAM1 blocking in NK cells results in the augmented killing of EpCAMhigh CSCs. (A) Expression of CEACAM1 on the surface of NK cells. IL-12 was added at 1 ng/mL for 6 hours. (B) Expression of CEACAM1 in two different NK cell subsets. IL-12 was added at 1 ng/mL for 6 hours. Data are representative of three independent experiments. (C) Increased cytotoxicity of NK cells against K562 cells when CEACAM1 on the NK cell surface was blocked. Bar graphs represent the means±SEM (n=3). *p<0.05. (D) Increased degranulation of NK cells when CEACAM1 on the NK cell surface was blocked. Bar graphs represent the means±SEM (n=3). **p<0.01. (E) Increased cytotoxicity of NK cells against Huh-7 cells when CEACAM1 on the NK cell surface was blocked. Bar graphs represent the means±SEM (n=3). ***p<0.001. (F) Increased cytotoxicity of NK cells against EpCAMhigh Huh-7 cells when CEACAM1 on the NK cell surface was blocked. Data are representative of three independent experiments.
In vivo activation of intratumoral NK cells by anti-CEACAM1 antibody
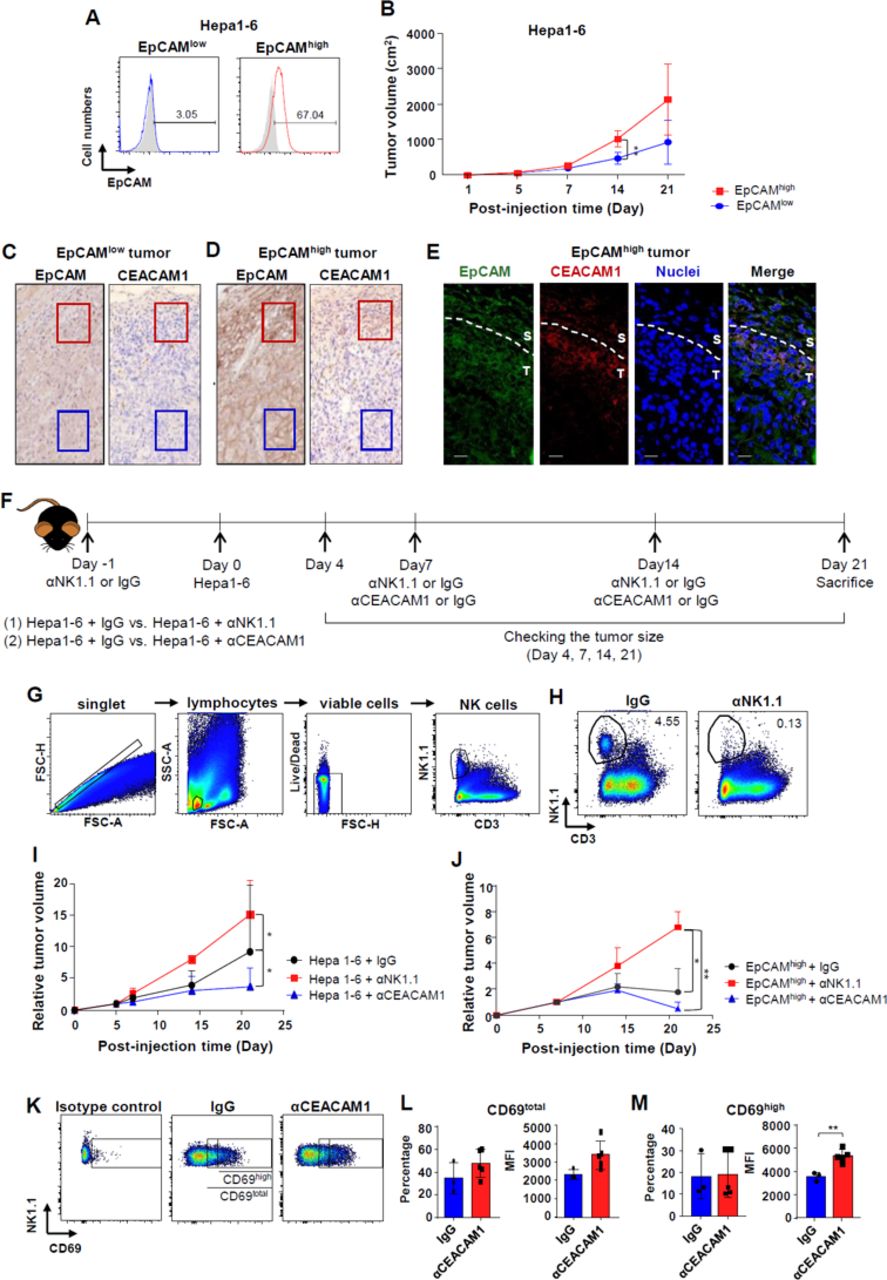
To confirm our in vitro results, in vivo experiments with a syngeneic HCC mouse model were performed. Hepa1–6 cells were stained for EpCAM and divided into two groups (EpCAMhigh and EpCAMlow; figure 5A). The cells were then injected into the flank of mice. The size of tumors with EpCAMhigh Hepa1–6 cells increased at a faster rate than those with the EpCAMlow Hepa1–6 cells (figure 5B). Immunohistochemical findings revealed that tumors made from EpCAMhigh Hepa1–6 cells showed higher EpCAM expression than those made from EpCAMlow Hepa1–6 cells (figure 5C, D). Interestingly, in EpCAMhigh tumors, EpCAM expression was more evident in peritumoral regions (figure 5D). Significantly higher levels of CEACAM1 expression occurred in the peritumoral regions of the EpCAMhigh tumor (red square), although intratumoral CEACAM1 levels were not evident in both EpCAMhigh and EpCAMlow tumors (blue square) (figure 5C, D). Using confocal microscopy, it was confirmed that EpCAMhigh and CEACAMhigh cells co-localized in the periphery of the tumor (figure 5E). In another in vivo experiment, anti-CEACAM1 antibody was injected on the 7th and on the 14th day of Hepa1–6 cell injection (figure 5F). For depletion of NK cells, anti-NK1.1 antibody was injected on the 7th and on the 14th day of hematoma injection (figure 5F). Intratumoral NK cell populations were examined and analyzed using flow cytometry after the digestion of the syngeneic tumors (figure 5G). The number of NK cells decreased after depletion of the cells with anti-NK1.1 antibody when compared with the control group (figure 5H). Tumor sizes were measured as scheduled and compared. Fourteen and 21 days after the injection of tumor cells, there was a significant increase in tumor size following the injection of anti-NK1.1 antibody and a significant decrease in tumor size following injection of anti-CEACAM1 antibody (figure 5I). The increase in tumor size after NK cell depletion and the decrease after CEACAM1 neutralization were also observed when similar experiments were done with only FACS-sorted EpCAMhigh cells (figure 5J and online supplementary figure 6). Intratumoral NK cell activity was determined by surface expression of CD69. The level of CD69 expression on NK cells was divided into intermediate and high levels according to the distribution in the population (figure 5K). The percentage and mean fluorescence intensity (MFI) values of intratumoral CD69total NK cells (intermediate+high) and CD69high NK cells were analyzed using flow cytometry (figure 5L, M). MFI values of CD69high NK cells showed a significant increase in intratumoral NK cells treated with anti-CEACAM1 antibody (figure 5M).

In vivo activation of intratumoral NK cells by anti-CEACAM1 antibody. (A) Staining of EpCAM in Hepa1–6 cells and subdividing them into EpCAMhigh and EpCAMlow cell populations. (B) Serial changes in size of the tumors generated from EpCAMhigh and EpCAMlow Hepa1–6 cells (5×10⁶ cells). **p<0.01. (C–D) EpCAM and CEACAM1 expression in EpCAMlow and EpCAMhigh tumors in syngeneic HCC model (red square: invasive front, blue square: intratumoral region). Data are representative of five independent experiments. (E) Immunofluorescence staining of EpCAM (green), CEACAM1 (red), and nuclei (blue) in EpCAMhigh tumors of syngeneic mouse model. Scale bar represents 20 µm. (F) Experimental schedule in the syngeneic HCC mouse model. Twenty micrograms of αCEACAM1 or αNK1.1 antibody was injected intraperitoneally. (G) Gating strategy for quantification of NK1.1cells using flow cytometry. (H) Confirmation of the depletion of NK cells by αNK1.1 antibody. Data are representative of four independent experiments. (I) Serial changes in size of the tumors generated from Hepa1–6 cells (5×10⁶ cells) after treatment with αCEACAM1 or αNK1.1 antibody. *p<0.05. (J) Serial changes in size of the tumors generated from EpCAMhigh Hepa1–6 cells (1×10⁶ cells) after treatment with αCEACAM1 or αNK1.1 antibody. *p<0.05, **p<0.01. (K) Level of CD69 expression in NK cells isolated from tumors in mock-injected or αCEACAM1-injected mouse. (L–M) Frequency and MFI of CD69-expressing NK cells isolated from tumors in mock-injected or αCEACAM1-injected mouse. **p<0.01. All data from mice experiments are expressed as mean±SD, n=5 to 10 mice per group.
CEACAM1 expression correlates with EpCAM expression in human HCC tissues
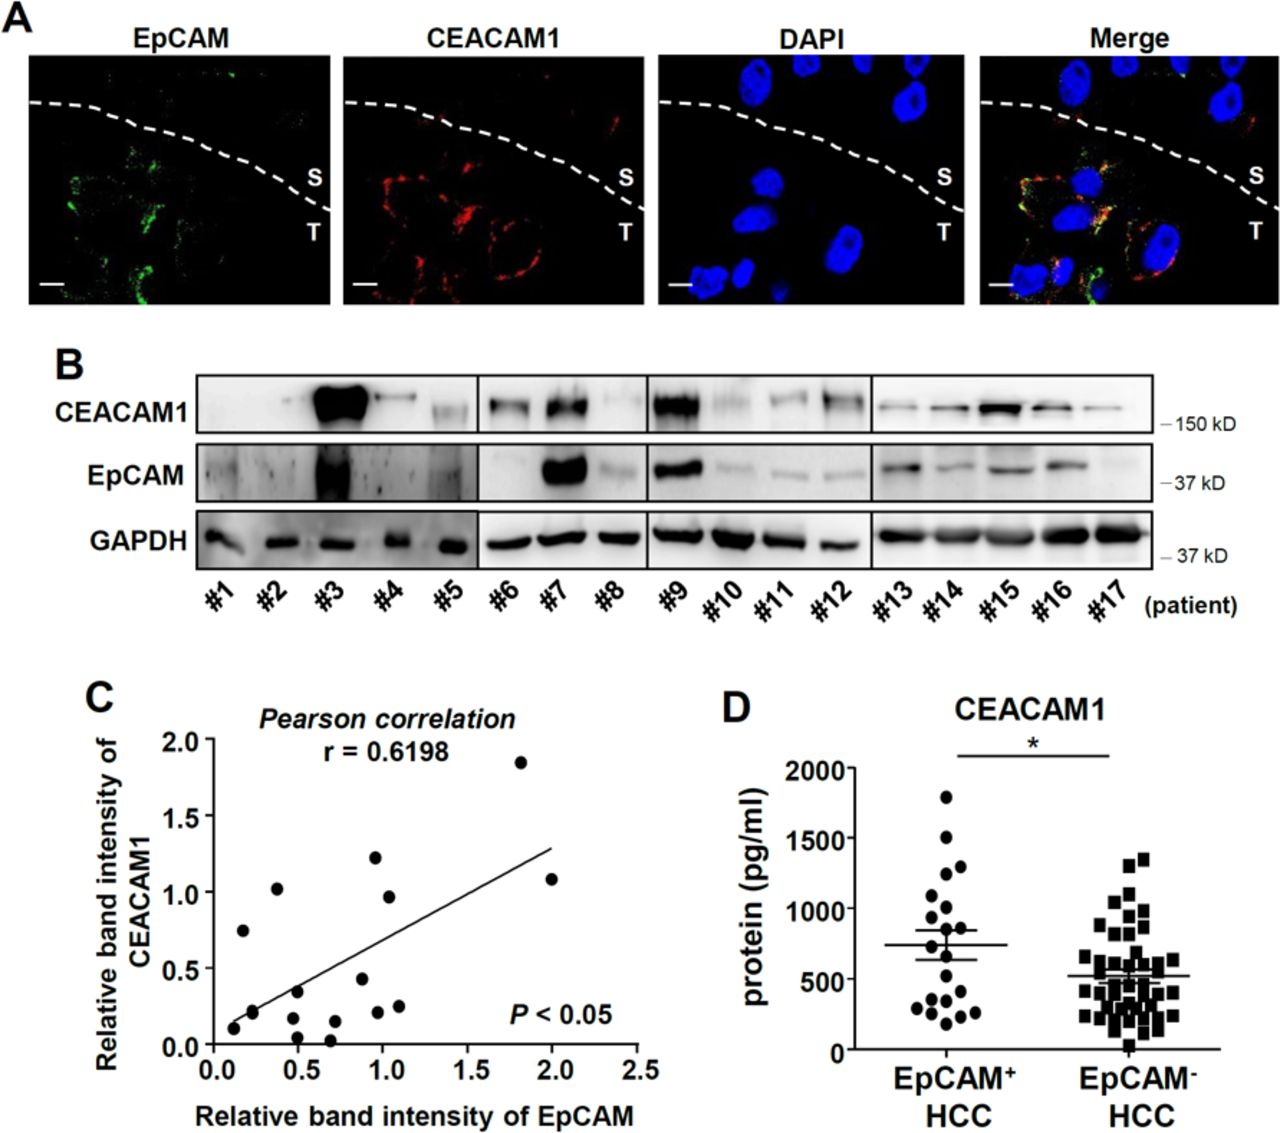
Finally, expression of CEACAM1 protein was evaluated in human HCC tissues. CEACAM1 was expressed in human HCC tissues at various levels and in different patterns. Immunofluorescence with snap-frozen human HCC tissues expressing EpCAM in peritumoral cancer cells demonstrated that only EpCAM-positive cells express cell-surface CEACAM1 (figure 6A). Immunoblotting with human HCC tissues demonstrated a positive correlation between the expression of EpCAM and CEACAM1 at the protein level (figure 6B, C). Interestingly, serum CEACAM1 levels were also significantly higher in patients with EpCAM+ HCC (figure 6D).
Association of CEACAM1 level with EpCAM expression in human hepatocellular carcinoma (HCC) tissues. (A) Immunofluorescence of EpCAM and CEACAM1 in human HCC tissues. Data are representative of three independent experiments. Scale bar represents 10 µm. (B–C) Positive correlation of EpCAM expression with CEACAM1 expression at the protein level in liver cancer tissues (n=17). Data were analyzed by Pearson correlation. *p<0.05. (D) Higher serum CEACAM1 level in patients with EpCAM-positive HCC (n=20) than EpCAM-negative HCC (n=43). *p<0.05.
Discussion
In this study, we have demonstrated for the first time that EpCAMhigh liver CSCs resist NK cell–mediated cytotoxicity by upregulating CEACAM1 on the cell surface. Using cell lines, a mouse model, and patient-derived samples, our data suggest that targeting CEACAM1 may prove useful in eradicating EpCAM-expressing CSCs in HCC.
From a molecular perspective, HCC is a highly heterogeneous disease.31 32 The known risk factors of HCC usually trigger a non-resolving inflammatory response characterized by infiltration of immature myeloid cells, lymphocytes, and macrophages.33 NK cells have been demonstrated to play critical roles in immune response against HCC,8 9 providing a basis for the development of novel treatment strategies to improve the cell response of NK cells for HCC treatment.
The preferential targeting of CSCs by NK cells has been demonstrated recently: NK cells were shown to be major immune effectors with the ability to target and shape several poorly differentiated tumors, such as oral, glioblastoma, pancreatic, and melanoma cancers.23 24 34–36 Interestingly, even though undifferentiated tumors are highly resistant to chemotherapeutic drugs or radiotherapy, they have been reported to be highly susceptible to NK cell–mediated cytotoxicity.37 38 However, another report demonstrated that breast CSCs were found to be resistant to NK cells,39 so this issue has been controversial. To date, there are no reports of resistance in relation to HCCs.
Distinct molecular signatures were found in different CSC subpopulations in HCC.40 Distinct genes have an independent relationship with HCC prognosis within the different CSC subpopulations, implying that tumor progression and intratumoural heterogeneity are affected by a diverse hepatic CSC transcriptome.40 Among the various cancer stem cell biomarkers in HCC, EpCAM is the most well-established surface biomarker for proliferating ductal cells (PDCs) in various species, including rats, mice, and humans.41 The differentiation of EpCAM-positive PDCs from mouse and human liver in cholangiocytes and hepatocytes indicates the occurrence of stem/progenitor-derived hepatocarcinogenesis from EpCAM-positive cells.41 In a recent meta-analysis, overexpression of EpCAM was found to be related to the clinicopathological features of HCC, including high AFP levels and poor differentiation.22 Notably, the role of EpCAM has been emphasized in hepatitis B virus (HBV)–related HCC.42 In HBV-replicating cells, EpCAM expression regulates intramembrane proteolysis, facilitates the activation of canonical Wnt signaling, and results in higher expression of the pluripotency genes hCSC, OCT4, and NANOG, as well as the SOX2 markers CD44, BAMBI, and CD133.42
The findings of the current study are in line with recent immunohistochemical analyses, which demonstrated that EpCAM expression in liver peritumoral tissues (cells at the “invasive front”) was associated with poor prognosis.43 44 Peritumoral cells encounter tumor-infiltrating immune cells and resist cytotoxicity from various immune cells, including NK cells. Unlike other CSC biomarkers, which are preferentially targeted by NK cells, EpCAM+ liver CSCs seem to resist NK-mediated cytotoxicity and cause tumor progression, thereby resisting the pressure from tumor-infiltrating immune cells. Recently, it was reported that NK cell–derived IFN-γ is able to promote HCC through upregulating EpCAM in HBV transgenic mice.45 Our data are in line with this report, in that EpCAM+ cells are constantly confronting NK cells and surviving under their anti-tumor pressure.
This study has demonstrated for the first time that CEACAM1 upregulation in EpCAM+ cells is associated with resistance to NK cells. CEACAM1 is a transmembrane glycoprotein expressed on endothelial, epithelial, and immune cells.46 The functions of CEACAM1 rely on its extracellular domains for intercellular adhesion with CEA (heterophilic) and CEACAM1 (homophilic). In addition, CEACAM1 adheres to TIM-3 protein and regulates T-cell tolerance and exhaustion.30 Among the members of the CEACAM family, CEACAM1 is the only glycoprotein that has an immunoreceptor tyrosine-based inhibitory motif.30 Alternative splicing of CEACAM1 can lead to the secretion of CEACAM1 variants. There is limited understanding of the role of secreted CEACAM1 variants; however, they can act as decoy receptors and inhibit intracellular homophilic adhesion.30 In the immune system, particularly in NK cells, CEACAM1 has been investigated for its tumor-associated function. Evasion of NK-mediated tumor-cell killing is robustly promoted by CEACAM1 on the tumor cells.47 48 MHC class I expression-independent inhibition of NK-mediated killing occurs in the presence of CEACAM1 on the surface of both melanoma and NK cells.47
In various cancers, including HCC, high expression levels of CEACAM1 are associated with metastasis, poor overall survival, and tumor progression.30 49 Direct antitumor effects, including the activation of immune cell function or the inhibition of tumor cell growth, can occur when CEACAM1 is targeted by a therapeutic monoclonal antibody. In a previous study, NK-mediated immune evasion was influenced by the expression of CEACAM1 on the tumor cells, which resulted in hiding of ligands that bind to NKG2D in NK cells.30 50 In that report, researchers performed most of the silencing experiments with human and murine colon adenocarcinoma cells. Different origins of cell types (colon cancer vs HCC) may have caused differential responses to CEACAM1 silencing. Moreover, we performed assays to investigate the potential differences in the expression of MICA/B in CEACAM1high and CEACAM1low cells among Huh-7 and HepG2 cells. There was no difference in MICA/B expression between these cells. Collectively, our data indicate that CEACAM1-mediated resistance against NK-induced cytolysis is not associated with decreased expression of NKG2D ligands in HCC cells. Similar results were presented in a recent report in which the authors demonstrated that levels of CEACAM1 on the cell surface, levels of CEACAM1 mRNA, and levels of soluble CEACAM1 in supernatants were significantly higher in Huh7.5.1 cells infected with HCV than in uninfected Huh7.5.1 cells.26 Furthermore, patients with CHC were shown to have higher serum CEACAM1 levels in comparison with healthy individuals.26 These findings are corroborated in the current study.
Conclusion
Our data clearly demonstrated that EpCAMhigh liver CSCs resist NK cell–mediated cytotoxicity by upregulating the expression of CEACAM1 on the cell surface. These results may offer a promising treatment approach against treatment-resistant HCC. Further studies are required to demonstrate the precise mechanisms behind this EpCAM-mediated CEACAM1 regulation.
Supplemental material
References
Footnotes
DJP and PSS contributed equally.
Contributors PSS and SKY: study design, data collection, data analysis, data interpretation, manuscript writing, and manuscript approval. DJP: data collection, data analysis, data interpretation, and manuscript writing. J-HK and GWL: data collection. ESJ, JWJ, SHB, and JYC: data interpretation and manuscript approval.
Funding This research was supported by the Basic Science Research Program through the National Research Foundation of Korea (NRF) funded by the Ministry of Education (NRF-2017R1D1A1B03033718). This research was also supported by the Basic Science Research Program through the National Research Foundation of Korea (NRF) funded by the Ministry of Education (NRF-2019R1I1A1A01059642). This research was partly supported by the Research Fund of Seoul St. Mary’s Hospital, The Catholic University of Korea.
Competing interests None declared.
Patient consent for publication Not required.
Ethics approval This study was approved by the Institutional Review Board of Seoul St. Mary’s Hospital (KC18RESI0039) and was conducted in accordance with the Declaration of Helsinki.
Provenance and peer review Not commissioned; externally peer reviewed.
Data availability statement Data are available on reasonable request.