Article Text

Abstract
Background The association between obesity and outcomes in patients receiving programmed death-1/programmed death ligand-1 (PD-L1) checkpoint inhibitors has already been confirmed in pre-treated non-small cell lung cancer (NSCLC) patients, regardless of PD-L1 tumor expression.
Methods We present the outcomes analysis according to baseline body mass index (BMI) and BMI variation in a large cohort of metastatic NSCLC patients with a PD-L1 expression ≥50%, receiving first line pembrolizumab. We also evaluated a control cohort of metastatic NSCLC patients treated with first line platinum-based chemotherapy. Normal weight was set as control group.
Results 962 patients and 426 patients were included in the pembrolizumab and chemotherapy cohorts, respectively. Obese patients had a significantly higher objective response rate (ORR) (OR=1.61 (95% CI: 1.04–2.50)) in the pembrolizumab cohort, while overweight patients had a significantly lower ORR (OR=0.59 (95% CI: 0.37–0.92)) within the chemotherapy cohort. Obese patients had a significantly longer progression-free survival (PFS) (HR=0.61 (95% CI: 0.45–0.82)) in the pembrolizumab cohort. Conversely, they had a significantly shorter PFS in the chemotherapy cohort (HR=1.27 (95% CI: 1.01–1.60)). Obese patients had a significantly longer overall survival (OS) within the pembrolizumab cohort (HR=0.70 (95% CI: 0.49–0.99)), while no significant differences according to baseline BMI were found in the chemotherapy cohort. BMI variation significantly affected ORR, PFS and OS in both the pembrolizumab and the chemotherapy cohorts.
Conclusions Baseline obesity is associated to significantly improved ORR, PFS and OS in metastatic NSCLC patients with a PD-L1 expression of ≥50%, receiving first line pembrolizumab, but not among patients treated with chemotherapy. BMI variation is also significantly related to clinical outcomes.
- immunotherapy
This is an open access article distributed in accordance with the Creative Commons Attribution Non Commercial (CC BY-NC 4.0) license, which permits others to distribute, remix, adapt, build upon this work non-commercially, and license their derivative works on different terms, provided the original work is properly cited, appropriate credit is given, any changes made indicated, and the use is non-commercial. See http://creativecommons.org/licenses/by-nc/4.0/.
Statistics from Altmetric.com
Introduction
Obesity-associated inflammation has been shown to dysregulate the immune response, potentially having profound effects on the toxicity and efficacy of immunotherapy across different type of malignancies.1–5 In non-small cell lung cancer (NSCLC), recent evidences have already confirmed the positive association between obesity and improved outcomes in patients receiving immune checkpoint inhibitors as further line of therapy, regardless of programmed death ligand-1 (PD-L1) tumor expression.6 7 Moreover, a pooled post-hoc analysis of data from four prospective trials (two of which randomized, with docetaxel as control arm) of pre-treated NSCLC patients receiving atezolizumab has provided robust evidences supporting this hypothesis.8 Importantly, Kichenadasse and colleagues confirmed that obesity was associated to survival benefit (compared with normal-weight patients) in patients treated with atezolizumab, but not in those who received chemotherapy, suggesting a predictive as well as a prognostic role of a high body mass index (BMI).8 Of note, the survival benefit was more pronounced in the PD-L1-positive subgroup, while a loss of statistical significance was reported within the PD-L1-negative patients.8
Accordingly, some evidences suggest that adipose tissue might play a pivotal role in regulating the immune homeostasis.9 10 In a recent meta-analysis including 203 articles, more than 6,000,000 patients across 15 different malignancies, the association between obesity and improved clinical outcomes was confirmed in those tumor types in which programmed death-1 (PD-1)/PD-L1 checkpoint inhibitors have proven to be more effective (such as lung cancer and renal cell carcinoma), despite studies involving patients who received immune checkpoint inhibitors were poorly represented in the meta-analysis itself.11 Therefore, assuming that the adipose tissue has somehow a role in the antitumor immune response, evaluating whether the variation of the BMI in patients receiving immune checkpoint inhibitors affects the clinical outcomes represents an interesting area of research.
Recently, we published a large real-world multicenter study of metastatic NSCLC patients with a PD-L1 expression ≥50%, receiving first line single agent pembrolizumab at 34 European institution, aimed at investigating the clinic-pathologic correlates of efficacy.12 Here, we present the clinical outcomes analysis according to baseline BMI and BMI variation (defined as ΔBMI) of the same study population. In order to confirm the results, we also evaluated a control cohort of metastatic NSCLC patients treated with first line platinum-based chemotherapy in clinical practice.
Materials and methods
Study design
We assessed baseline BMI and ΔBMI within the study population of a real-world multicenter retrospective study evaluating metastatic NSCLC patients with PD-L1 expression ≥50%, consecutively treated with first line pembrolizumab monotherapy, from January 2017 to October 2019, at 34 institutions (online supplemental table 1).12 13 In order to weighing our results, we also evaluated the baseline BMI and ΔBMI in a cohort of metastatic epidermal growth factor receptor wild-type NSCLC patients treated with platinum-based doublet chemotherapy in clinical practice from January 2013 to January 2020, at 10 among the above-mentioned institutions. Patients were treated in clinical practice with either the 2 mg/kg q3 weeks schedules (before the procedure N° EMEA/H/C/3820/II/48) and the 200 mg q3 weeks flat dose.
Supplemental material
The aim of this analysis was to evaluate clinical outcomes according to baseline BMI and ΔBMI in both the pembrolizumab and chemotherapy cohorts. The measured clinical outcomes were objective response rate (ORR), median progression-free survival (PFS) and median overall survival (OS). Patients were assessed with radiological imaging in clinical practice, with a frequency ranging from 12 to 16 weeks, according to the monitoring requirements for high-cost drugs of the respective national drug regulatory agencies (eg, the on-line monitoring dashboard of the ‘Agenzia Italiana del Farmaco’ requires a disease assessment at least every 16 weeks; available at: https://servizionline.aifa.gov.it/). Radiologists evaluation was based on Response Evaluation Criteria In Solid Tumors (RECIST criteria (V.1.1),14 and a subsequent confirming imaging was recommended. However, treatment beyond disease progression was allowed and also patients evaluated according to the clinicians assessment in clinical practice were considered eligible. The reliability of disease response evaluation in clinical practice was assessed through Kaplan-Meier survival curves for PFS and OS according to the best response (categorized as partial/complete response, stable disease and progressive disease) (online supplemental figure 1).
Supplemental material
ORR was defined as the portion of patients experiencing an objective response (complete or partial response) as best response to immunotherapy. PFS was defined as the time from treatment initiation to disease progression or death, whichever occurred first. OS was defined as the time from treatment initiation to death. For PFS as well as for OS, patients without events were considered as censored at the time of the last follow-up. Data cut-off period was February 2020 for the pembrolizumab cohort and April 2020 for the chemotherapy cohort.
Considering the possible unbalanced distribution, the influence of large within group variation and the possible interactions, fixed multivariable regression models were used to estimate clinical outcomes (ORR, PFS and OS) according to baseline BMI and ΔBMI by using pre-planned adjusting key covariates in both the pembrolizumab and chemotherapy cohorts.15–17 The key covariates were: age (<70 vs ≥70 years old),18 gender (male vs female), Eastern Cooperative Oncology Group—Performance Status (ECOG-PS) (0–1 vs ≥2), central nervous system (CNS) metastases (yes vs no), bone metastases (yes vs no) and liver metastases (yes vs no).
BMI evaluation
Weight and height were obtained from patient medical records; BMI was calculated using the formula of weight/height2 (kilograms per square meter) and categorized according to the WHO categories: underweight, BMI<18.5; normal-weight, 18.5≤BMI≤24.9; overweight, 25≤BMI≤29.9; obese, BMI≥30. In all the regression analyses, normal-weight patients were considered as the comparator group. ΔBMI was defined as the BMI percentage variation from treatment initiation to disease progression (or to the last contact for censored patients). In order to guarantee a minimum time lapse for ΔBMI assessment and to overcome selection biases related to some fast disease progressions, which might have flawed our determinations, the efficacy analysis according to the ΔBMI was performed after a 4 weeks landmark selection, including only patients with a minimum follow-up for PFS of 4 weeks. To identify an optimal grouping according to the ΔBMI and determine appropriate cut-offs with respect to ORR, PFS and OS in the pembrolizumab, a recursive partitioning algorithm was performed, using the Rpart function in R. The computed cut-offs were than applied to the chemotherapy cohort, following the rules of external validation.19 However, in order to properly weighing the role of the ΔBMI, a recursive partitioning was performed to compute the cut-offs with respect to ORR, PFS and OS also within the chemotherapy cohort.
Statistical analysis
Baseline patient characteristics were reported with descriptive statistics and compared between the pembrolizumab cohort and chemotherapy cohort with the χ2 test. χ2 test was also used to compare ORRs according to BMI and ΔBMI in both the cohorts. Logistic regression was used for the multivariate analysis of ORR. Median PFS and median OS were evaluated using the Kaplan-Meier method. Median period of follow-up was calculated according to the reverse Kaplan-Meier method. Cox proportional hazards regression was used for the fixed multivariate analysis of PFS and OS. The alpha level for all analyses was set to p<0.05. Adjusted hazard ratios (aHRs) and adjusted odds ratios (aORs) with 95% CIs were calculated. Forest plot graphs were used to compare HRs and ORs between the pembrolizumab and the chemotherapy cohorts. All statistical analyses were performed using MedCalc Statistical Software V.18.11.3 (MedCalc Software bvba, Ostend, Belgium; http://www.medcalc.org; 2019). Recursive partitioning was performed using the R package rpart (R V.3.6.2).
Results
Patients characteristics
Table 1 summarizes patients characteristics of both the cohorts. Nine hundred and sixty-two patients and 426 patients were included in the pembrolizumab and chemotherapy cohorts, respectively. Median age was 70.1 and 66.0 years; the rate of elderly patients was significantly higher in the pembrolizumab cohort, compared with the chemotherapy cohort (51.0% vs 39.2%, p<0.0001), as well as the rate of patients with an ECOG-PS of ≥2 (17.6% vs 7.0%, p<0.0001). The median baseline BMI was 24.2 for the pembrolizumab cohort and 24.9 for the chemotherapy cohort; normal-weight patients were the majority of both the cohort (54.9% and 47.4%, respectively), but the χ2 test for trend revealed that there was a statistically significant trend of higher BMI categories to be more frequent through the chemotherapy cohort (p=0.0287). After the 4 weeks landmark selection, 799 (83.1%) and 414 (97.2%) of the patients from the pembrolizumab and chemotherapy cohorts were included in the ΔBMI analysis, respectively (online supplemental figure 2). The median ΔBMI was 0% for both the cohorts. Notably, the median follow-up periods were 14.6 months (95% CI: 13.5–15.6) and 37.2 months (95% CI: 31.7–44.1) for the pembrolizumab and chemotherapy cohorts, respectively. One hundred ninety-three patients (20%) within the pembrolizumab cohort had received a further systemic treatment, while 249 patients (58.5%) within the chemotherapy cohort had received a further treatment with either PD-1 or PD-L1 checkpoint inhibitors at the data cut-off. Table 2 summarizes the recursive partitioning results. Interestingly, the computed cut-offs for ORR, PFS and OS were the same positive value (BMI gain of 1.4%) within the pembrolizumab cohort, which was set as fixed cut-off for the clinical outcomes analysis of both the cohorts. On the other hand, in the chemotherapy cohort the computed cut-off for ORR was a positive value (BMI gain of 7.1%), while was a negative value for PFS and OS (BMI loss of 6.8% and 2.2%, respectively).
Supplemental material
Patients’ characteristics
Optimal grouping according to ΔBMI computed through the recursive partitioning algorithm with respects to the objective response rate (ORR), progression-free survival (PFS) and overall survival (OS)
Clinical outcomes analysis
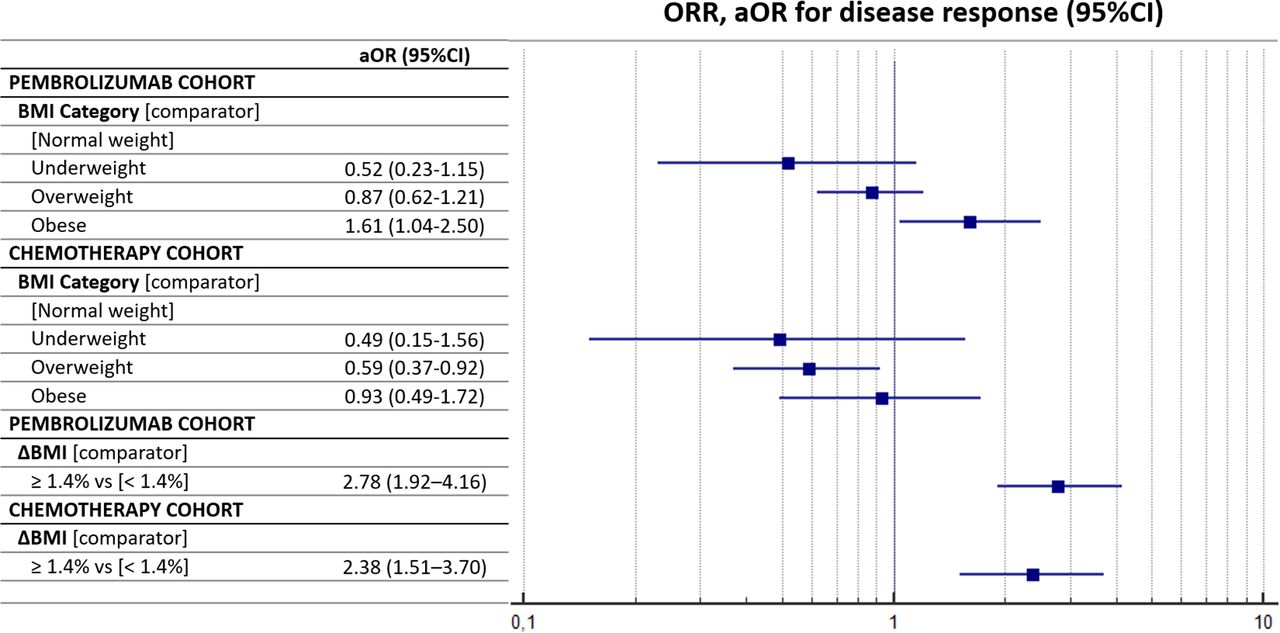
The ORR for the pembrolizumab cohort overall was 44.1% (95% CI: 39.7–48.8) (372/844 response ratio), while was 43.8% for the chemotherapy cohort overall (95% CI: 37.7–50.6) (184/420 response ratio). The median PFS and OS for the pembrolizumab cohort were 8.0 months (95% CI: 6.9–9.6; 559 progression events) and 18.6 months (95% CI: 16.1–27.5; 567 censored patients), respectively, while the median PFS and OS for the chemotherapy cohort were 6.1 months (95% CI: 5.7–6.5; 387 progression events) and 16.5 months (95% CI: 13.6–18.7; 136 censored), respectively (online supplemental figure 3). Table 3 summarizes the ORRs of both the pembrolizumab and chemotherapy cohorts, according to the baseline BMI and ΔBMI of 1.4%. Patients with a high baseline BMI had a significantly higher ORR within the pembrolizumab cohort (p=0.0077), but not within the chemotherapy cohort (p=0.0758). The ΔBMI evaluated according to the computed cut-off significantly affected the ORR and patients with a BMI gain of ≥1.4% had a higher BMI in both the pembrolizumab (p<0.0001) and the chemotherapy (p<0.0001) cohorts. Table 4 summarizes the multivariate regression analyses for ORR with the pre-planned fixed adjusting factors. Obese patients were confirmed to have a significantly higher ORR compared with normal-weight patients (aOR=1.61 (95% CI: 1.04–2.50), p=0.0348) within the pembrolizumab cohort, while overweight patients had a significantly lower ORR compared with normal-weight patients (aOR=0.59 (95% CI: 0.37–0.92), p=0.0208) within the chemotherapy cohort. Also, at the multivariate analysis. the ΔBMI of 1.4% significantly affected the ORR within the pembrolizumab cohort (aOR=2.78 (95% CI: 1.92–4.16), p<0.0001) and the chemotherapy cohort (aOR=2.38 (95% CI: 1.51–3.70), p=0.0002). Figure 1 reports the forest plot graph for the ORR of the pembrolizumab and chemotherapy cohorts according to baseline BMI and ΔBMI.
Supplemental material
Summary of the objective response rate (ORR) in the pembrolizumab cohort and chemotherapy cohort according to the baseline BMI and ΔBMI
Summary of the multivariate analysis (MVA) with logistic regression for objective response rate (ORR)

Forest plot graph for objective response rate (ORR). aOR, adjusted OR; BMI, body mass index.
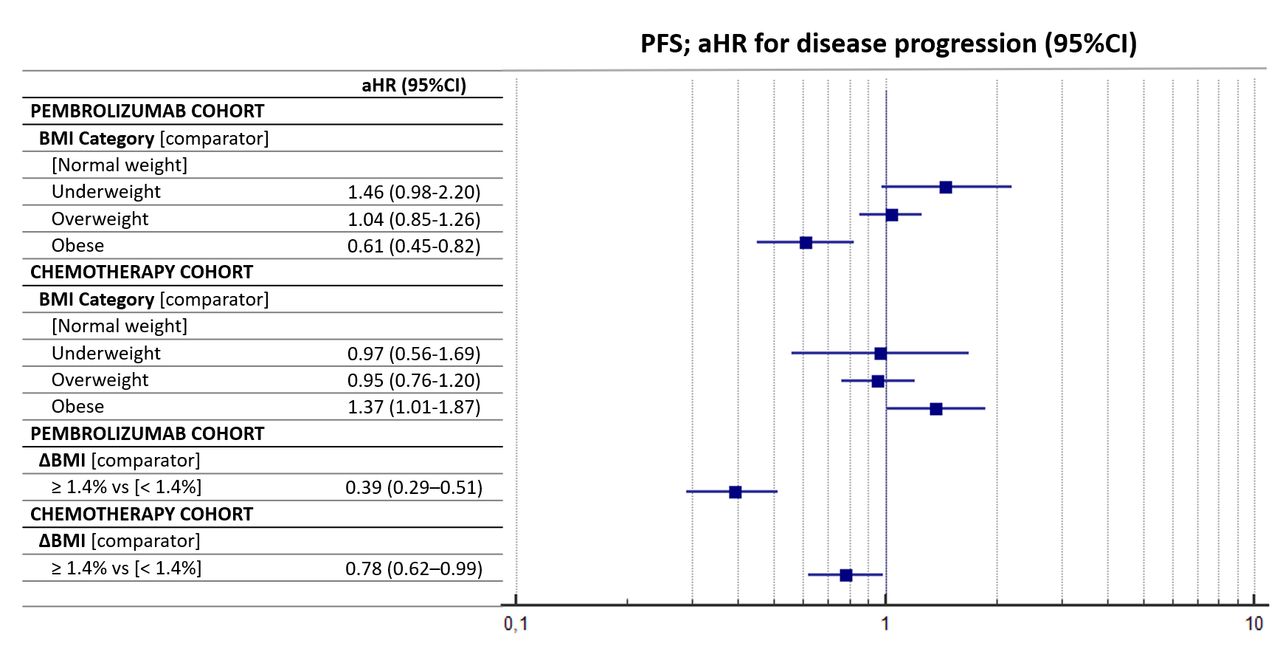
Table 5 summarizes the multivariate regression for PFS. Obese patients were confirmed to have a significantly longer PFS compared with normal-weight patients (aHR=0.61 (95% CI: 0.45–0.82), p=0.0012) in the pembrolizumab cohort. Conversely, they had a significantly shorter PFS compared with normal-weight patients in the chemotherapy cohort (aHR=1.37 (95% CI: 1.01–1.87), p=0.0477). ΔBMI of 1.4% significantly affected the PFS of both the pembrolizumab cohort (aHR=0.39 (95% CI: 0.29–0.51), p<0.0001) and the chemotherapy cohort (aHR=0.78 (95% CI: 0.62–0.99), p=0.0341). Figure 2 reports the forest plot for the PFS of the two cohort according to baseline BMI and ΔBMI.
Summary of the multivariate analysis (MVA) with Cox proportional-hazards of progression-free survival (PFS)

Forest plot graph for progression-free survival (PFS). aHR, adjusted HR; BMI, body mass index.
Table 6 summarizes the multivariate regression for OS. Obese patients had a significantly longer OS compared with normal-weight patients within the pembrolizumab cohort (aHR=0.70 (95% CI: 0.49–0.99)), while no significant differences according to baseline BMI were found in the chemotherapy cohort. ΔBMI of 1.4% significantly affected the OS within both the pembrolizumab cohort (aHR=0.33 (95% CI: 0.22–0.48), p<0.0001) and the chemotherapy cohort (aHR=0.73 (95% CI: 0.56–0.96), p=0.0241). Figure 3 reports the forest plot graph for the OS of the two cohorts according to baseline BMI and ΔBMI.

Forest plot graph for overall survival (OS). aHR, adjusted HR; BMI, body mass index.
Summary of the multivariate analysis (MVA) with Cox proportional-hazards of overall survival (OS)
Online supplemental figure 4 reports the Kaplan-Meier survival curves of PFS and OS according to baseline BMI; online supplemental figure 5 reports the Kaplan-Meier survival curves of PFS and OS according to the ΔBMI for both the cohorts.
Supplemental material
Supplemental material
Discussion
In this study we confirmed that also in a population of NSCLC patients with a PD-L1 expression ≥50% receiving first line pembrolizumab, obesity is associated to improved clinical outcomes. Obese patients had a significantly higher ORR, and prolonged PFS and OS compared with normal-weight patients. The fact that this trend was confirmed at each outcome analysis (ORR, PFS and OS) and with multivariate regression models further supports our results. More importantly, we did not observe such correlation among patients treated with chemotherapy, suggesting that the obesity-related clinical benefit is unique of patients treated with immunotherapy. Of note, obese patients who received chemotherapy had a non-significant trend towards a lower ORR and shorter OS, and a significantly shorter PFS, compared with normal-weight patients. These evidences are aligned to what already reported for NSCLC patients in clinical practice,6 7 20 and to the improved survival observed in obese PD-L1-positive NSCLC patients by Kichenadasse et al.8 Consistently with our results, also in the control cohort of the study by Kichenadasse and colleagues, no survival benefit was reported for obese patients who received chemotherapy.8 Remarkably, obese patients in the chemotherapy cohort did not have an improved OS despite 58.5% of them received immunotherapy on chemotherapy failure.
As previously mentioned, a growing body of evidence is indicating that the adipose tissue might play a critical role in shaping the antitumor immune responses. Wang and colleagues reported that obese mice showed a significant increase of dysfunctional exhausted T-cell.9 Such exhaustion could be partially mediated by the immune checkpoints (as the PD-1/PD-L1 pathway) and driven by leptin, and then might be more likely elicited by immune checkpoints inhibitors.9 10
Nonetheless, a high baseline BMI has been historically somehow associated to improved lung cancer survival across different disease stages, even in the ‘pre-immune checkpoint inhibitors era’, reflecting the potential prognostic nature of baseline BMI in lung cancer patients.21–24 However, we need to highlight that even if cancer cachexia mechanisms are not completely known yet, several evidences showed that the systemic inflammation plays a central role.25 Lung cancer is an aggressive disease, and metastatic NSCLC patients usually to present with poor clinical condition and weight loss at the time of first line treatment commencement, which underlies a systemic inflammatory over-activation.26 From this point of view, a higher baseline BMI might be considered a sign of functional reserve and a protective feature for NSCLC advanced patients.
To that end, in a study evaluating 2585 stage IV NSCLC patients from three trials with first line chemotherapy, obesity was associated with improved OS.27 Intriguingly, when time on-study exceeded 16 months, obese patients experienced a significant increase in their hazard rate for death, compared with normal/overweight patients, suggesting a possible negative role of the sarcopenic obesity in the long-term during chemotherapy.27
Also, the efficacy analysis according to ΔBMI revealed interesting results. A BMI variation of 1.4% during treatment was significantly (and concordantly) related to each measured outcome (ORR, PFS and OS) for both the pembrolizumab and chemotherapy cohorts. Looking to the forest plot graphs, we can notice that the aOR and the aHRs were concordantly more pronounced for the pembrolizumab cohort. Similarly, the Kaplan-Meier survival curves according to the ΔBMI (online supplemental figure 4) show a much more marked survival benefit for patients who experienced a BMI gain of ≥1.4% within the pembrolizumab cohort rather than in the chemotherapy cohort. These findings could make us assuming that the prognostic role ΔBMI is stronger during the immunotherapy rather than chemotherapy. However, we must not fail in taking into account that the optimal grouping computed with the recursive partitioning algorithm within the patients receiving pembrolizumab was applied to both the cohorts. Interestingly with respect to the optimal grouping, while for the pembrolizumab cohort a harmonic positive cut-off for ΔBMI was found for ORR, PFS and OS (+1.4%), three different cut-offs were found among the chemotherapy cohort using a recursive partitioning: a positive value for ORR (+7.1%), and two different negative values for PFS (−6.8%) and OS (−2.2%). Although using different cut-offs for the same variable may seem redundant, the results raise some questions. A harmonic and relatively small weight gain during pembrolizumab could be considered a concordant independent predictor for ORR, PFS and OS. Conversely, a more pronounced weight gain during chemotherapy is associated with ORR, while a weight loss is significantly associated with inferior PFS and OS. From this perspective, the BMI acts differently in the two cohorts; considering the adipose tissue an immune organ, patients who experienced a slight weight gain during immunotherapy had a significantly improved ORR, PFS and OS. Considering instead the adipose tissue as a functional reserve for patients receiving chemotherapy, a pronounced weight gain is related to an improved ORR, while a weight loss had a significant prognostic negative role for PFS and OS. In a post-hoc analysis from three phase III studies of patients receiving a platinum-based systemic therapy, Patel and colleagues evaluated the clinical outcomes according to a pre-planned weight gain cut-off (> vs ≤5%), assessed by monitoring post-baseline weight variation till the maximum weight during treatment or at the 30-day post-study discontinuation follow-up visit.28 The authors reported that a weight gain of >5% were significantly related to improved ORR, PFS and OS.28 However, the different methodology does not allow a direct comparison between our chemotherapy cohort and the cohort of Patel et al.28
Our study has several limitations beyond the retrospective design and the consequent selection biases. First, we cannot consider the chemotherapy cohort a proper validation cohort, because we did not perform any case-control matching; the percentage of elderly patients and patients with ECOG-PS ≥2 are in fact significantly different. Considering the good clinical outcomes achieved in absolute terms, the chemotherapy cohort might had been positively biased. These findings are likely to be related to the clinicians attitude to treat with doublet chemotherapy more fit patients, compared with single agent pembrolizumab. Moreover, this positive selection might partially subtend to the lack of association between survival and BMI in the chemotherapy cohort. From this perspective, the analysis of the chemotherapy cohort collides with the evidences suggesting that also in NSCLC patients receiving chemotherapy a higher BMI is associated with an improved survival.11 Additional limitations include the data lack availability regarding comorbidities, the different sample size of the two cohorts, as well as the median follow-up which was different. The chemotherapy cohort was not powered to detect statistically significant differences according to weight categories, moreover, being a historic cohort, we did not have data regarding PD-L1 expression for the subset of patients treated with chemotherapy. Nevertheless, considering the real-world prevalence of PD-L1 expression in NSCLC, we can assume that we one-third of the patients in the chemotherapy cohort had a PD-L1 expression of ≥50%.29 Without having the weight data at pre-specified time points, we computed the ΔBMI from treatment commencement to disease progression or to the last contact for censored patients, who, however, were progression free at the data cut-off and might had been positively selected with regards of the weight gain (due to better clinical condition). Conversely, progressed patients might have been negatively selected regarding the weight loss, even if the 4 weeks landmark selection was performed to mitigate this bias. In this respect, in our population, the probability of experience a BMI variation was conditional on the PFS, which was longer for the pembrolizumab cohort. Despite this, the median ΔBMI was the same in the two cohort.
We have also to consider that with the weight-based dose overweight/obese patients have been exposed to higher dose intensity of pembrolizumab. Nevertheless, pharmacokinetic studies did not report definitive findings in exposure differences nor in safety profiles between the regimens (weight-based and fixed dose).30 Furthermore, weight variation is inevitably related to the food intake, and chemotherapy is certainly associated to a higher incidence of anorexia, nausea and emesis compared with single agent pembrolizumab.
Conclusion
We confirmed that baseline obesity is associated to significantly improved ORR, PFS and OS also in metastatic NSCLC patients with a PD-L1 expression of ≥50%, receiving first line single agent pembrolizumab, but not among patients treated with chemotherapy. BMI variation during treatment is also significantly related to clinical outcomes, but it seems to have a different role for patients receiving first line pembrolizumab, compared with patients receiving first line platinum-based chemotherapy.
Acknowledgments
A special thank to the ‘Consorzio Interuniversitario Nazionale per la Bio‑Oncologia’ for their support in this study.
References
Supplementary materials
Supplementary Data
This web only file has been produced by the BMJ Publishing Group from an electronic file supplied by the author(s) and has not been edited for content.
Footnotes
Twitter @emilio.bria, @gbanna74
Contributors All authors contributed to the publication according to the ICMJE guidelines for the authorship (study conception and design, acquisition of data, analysis and interpretation of data, drafting of manuscript, critical revision). All authors read and approved the submitted version of the manuscript (and any substantially modified version that involves the author’s contribution to the study). Each author has agreed both to be personally accountable for the author’s own contributions and to ensure that questions related to the accuracy or integrity of any part of the work, even ones in which the author was not personally involved, are appropriately investigated, resolved, and the resolution documented in the literature.
Funding The authors have not declared a specific grant for this research from any funding agency in the public, commercial or not-for-profit sectors.
Competing interests AC received speaker fees and grant consultancies by Astrazeneca, MSD, BMS, Roche, Novartis and Astellas. JA reports receiving commercial research grants from Amphera and Roche, holds ownership interest (including patents) in Amphera BV, and is a consultant/advisory board member for Amphera, Boehringer Ingelheim, Bristol-Myers Squibb, Eli-Lilly, MSD and Roche. EB received speakers’ and travels’ fee from MSD, Astra-Zeneca, Celgene, Pfizer, Helsinn, Eli-Lilly, BMS, Novartis and Roche. EB received consultant’s fee from Roche, Pfizer. EB received institutional research grants from Astra-Zeneca, Roche. MT received speaker fees and grant consultancies by Astrazeneca, Pfizer, Eli-Lilly, BMS, Novartis, Roche, MSD, Boehringer Ingelheim, Otsuka, Takeda and Pierre Fabre. AM received speaker fees by Astra, Roche, BMS, MSD, Boehringer, Pfizer, Takeda. FM received grant consultancies by MSD and Takeda. RG received speaker fees and grant consultancies by Astrazeneca and Roche. FP received grant consultancies by MSD and Astrazeneca. AF received grant consultancies by Roche, Pfizer, Astellas and BMS. AA received grant consultancies by Takeda, MSD, BMJ, Astrazeneca, Roche and Pfizer. RC received speaker fees by BMS, MSD, Takeda, Pfizer, Roche and Astrazeneca. CG received speaker fees/grant consultancies by Astrazeneca, BMS, Boehringer-Ingelheim, Roche and MSD. MR received honoraria for scientific events by Roche, Astrazeneca, Bristol-Myers Squibb, Merck Sharp & Dohme and Boehringer Ingelheim.
Patient consent for publication Not required.
Ethics approval All patients provided written, informed consent to treatment with immunotherapy. The procedures followed were in accordance with the precepts of good clinical practice and the declaration of Helsinki. The study was approved by the respective local ethical committees on human experimentation of each institution, after previous approval by the coordinating center (Comitato Etico per le provice di L’Aquila e Teramo, verbale N.15 del 28 Novembre 2019).
Provenance and peer review Not commissioned; externally peer reviewed.
Data availability statement The datasets used during the present study are available from the corresponding author upon reasonable request.