Article Text

Abstract
Background Clinical benefit from programmed cell death 1 receptor (PD-1) inhibitors relies on reinvigoration of endogenous antitumor immunity. Nonetheless, robust immunological markers, based on circulating immune cell subsets associated with therapeutic efficacy are yet to be validated.
Methods We isolated peripheral blood mononuclear cell from three independent cohorts of melanoma and Merkel cell carcinoma patients treated with PD-1 inhibitor, at baseline and longitudinally after therapy. Using multiparameter flow cytometry and cell sorting, we isolated four subsets of CD8+ T cells, based on PD-1 and TIGIT expression profiles. We performed phenotypic characterization, T cell receptor sequencing, targeted transcriptomic analysis and antitumor reactivity assays to thoroughly characterize each of these subsets.
Results We documented that the frequency of circulating PD-1+TIGIT+ (DPOS) CD8+ T-cells after 1 month of anti-PD-1 therapy was associated with clinical response and overall survival. This DPOS T-cell population was enriched in highly activated T-cells, tumor-specific and emerging T-cell clonotypes and T lymphocytes overexpressing CXCR5, a key marker of the CD8 cytotoxic follicular T cell population. Additionally, transcriptomic profiling defined a specific gene signature for this population as well as the overexpression of specific pathways associated with the therapeutic response.
Conclusions Our results provide a convincing rationale for monitoring this PD-1+TIGIT+ circulating population as an early cellular-based marker of therapeutic response to anti-PD-1 therapy.
- CD8-Positive T-Lymphocytes
- costimulatory and inhibitory T-Cell receptors
- immunotherapy
- melanoma
- programmed cell death 1 receptor
This is an open access article distributed in accordance with the Creative Commons Attribution Non Commercial (CC BY-NC 4.0) license, which permits others to distribute, remix, adapt, build upon this work non-commercially, and license their derivative works on different terms, provided the original work is properly cited, appropriate credit is given, any changes made indicated, and the use is non-commercial. See http://creativecommons.org/licenses/by-nc/4.0/.
Statistics from Altmetric.com
- CD8-Positive T-Lymphocytes
- costimulatory and inhibitory T-Cell receptors
- immunotherapy
- melanoma
- programmed cell death 1 receptor
Background
The definition of robust and convenient biomarkers of programmed cell death 1 receptor (PD-1) therapy efficacy to stratify patients beforehand or early after initiation of the therapy that could guide therapeutic management is still lacking while being a very active research field. Biomarkers described to date include tumor burden, neoantigen load,1 2 presence and number of PD-1+ CD8+ T cells at the tumor margin,3 4 T-cell inflamed tumor microenvironment5 and Programmed death-ligand 1 (PD-L1) expression by the tumor cells or other infiltrating immune cells6–10 and composition of the gut microbiota.11 12 Most of these parameters are closely related/influenced by the presence, activation status and functional capacities of CD8+ T cells infiltrating the tumor site demonstrating their pivotal role for anti-PD-1 mediated antitumor efficacy. In this respect, a population of CD8 tumor infiltrating lymphocytes (TILs) identified by bright PD-1 expression with altered effector functions but preserved proliferative capacity and expression of the T-cell attractant chemokine CXCL13 has been described in mice and human and was proposed as predictive of anti-PD-1 clinical response.13–15 The exact contribution for clinical efficacy of TILs vs distinct CD8+ T cells from peripheral origins recirculating to the tumor site remains to be elucidated. Notably, Proliferating CD8 T cells have been described in the blood of cancer patients receiving PD-1 inhibitors as early as D7 postinfusion and their accumulation at the tumor site correlated with clinical benefit.16–18 Therefore, describing circulating T cell populations predictive of PD-1 inhibitor efficacy could represent a convenient, non-invasive and rapid method to assess antitumor benefits.
Coinhibitory receptors exhibit different expression profiles depending on T-cell subsets and anatomical location suggesting specification of checkpoint pathways.19 T cell immunoreceptor with Ig and ITIM domains (TIGIT) and PD-1 are, respectively, highly expressed by some CD8 T-cell subsets in the blood of cancer patients in contrast to LAG-3, Tim-3 and CTLA-4. Moreover, we and others have previously suggested that PD-1 and TIGIT coexpression may define a pertinent CD8 T cell population to monitor clinical efficacy of PD-1 blockade.20–24 Consequently, we sought to determine the distinct biological features of peripheral CD8 subsets delineated based on PD-1 and TIGIT expression. Our findings identify the PD-1+TIGIT+ (DPOS : double-positive) CD8+ T-cell population enriched in highly activated and proliferating T cells, enriched in tumor-specific T-cell clones and in T lymphocytes overexpressing CXCR5, a key marker of the recently described CD8 cytotoxic follicular T cell (Tfc) population.25–31 Strikingly, the frequency of DPOS T cells after 1 month of anti-PD-1 therapy was associated with clinical response in three independent cohorts of cancer patients treated with PD-1 inhibitor. Additionally, transcriptomic profiling of this subset described common features with the PD-1high CXCL13+ lymphocyte subset previously demonstrated in tumor infiltrates to be predictive of PD-1 blockade efficacy.15 Furthermore, T cell receptor (TCR) repertoire analysis described a cluster of emerging T-cell clonotypes in the DPOS population as a key feature of PD-1 therapeutic efficacy. We thus propose that the frequency of this double positive CD8+T cell subset in peripheral blood mononuclear cells (PBMCs) may serve in clinical decision support.
Methods
Patient population, clinical assessment and blood samples processing
Melanoma cohort 1
Patients with stage III or IV unresectable metastatic melanoma were enrolled in the Unit of Dermato-cancerology of the University hospital of Nantes. Of 13 patients, seven received anti-PD-1 therapy as a first line of treatment, and 6/13 after previous treatments with targeted therapy or immunotherapy (online supplemental table S1). Anti-PD-1 mAb (OPDIVO, Nivolumab, BMS) was administered intravenously every 2 weeks at 3 mg/kg and the clinical evaluation was performed every 2 months after the start of anti-PD-1 therapy, by CT scan or Ultrasonography according to RECIST criteria. Clinical responses were evaluated at month 6 (CR, PR, stable disease (SD), PD). Peripheral blood samples were collected before the first injection of anti-PD-1 (T0), and after 2 (M1), 4 (M2) or 12 injections (M6), after written informed consent (Nantes ethic committee, approval number: DC-2011–1399).
Supplemental material
PBMCs were immediately isolated from blood samples using Ficoll gradient centrifuge separation (Eurobio Ficoll). All samples were cryopreserved in liquid nitrogen in Roswell Park Memorial Institute medium (RPMI) supplemented with 20% FCS (Gibco) and 10% DMSO (Carlo Erba) until further experimentation.
Melanoma cohort 2
Patients with stage III and IV melanoma were enrolled at the University Hospital of Besançon (France) in the ITHER cohort, a prospective immunomonitoring study of tumor-specific CD4 T cell immunity in cancer patients receiving anti-PD-1/PD-L1 therapy (Id clinicaltrials.go: NCT02840058). Blood samples from these 13 patients were collected before and after 1 month (M1) of anti-PD-1 therapy (Nivolumab or Pembrolizumab). Of 13 patients, 11 received anti-PD-1 therapy as a first line of treatment, and 2/13 after previous treatments with targeted therapy (online supplemental table S2). Patient’s main clinical characteristics and clinical outcome are summarized in online supplemental table S2).
Merkel cell carcinoma cohort
Patients included in this study presented with distant metastatic or recurrent locoregional Merkel cell carcinoma (MCC) not amenable to definitive surgery or radiation therapy with measurable disease per RECIST criteria V.1.1. Patients were naïve to systemic therapy for MCC and were enrolled in a multicenter phase II trial (Cancer Immunotherapy Trials Network-09/Keynote017) to receive pembrolizumab (Merck & Co, Kenilworth, New Jersey, USA, 2 mg/kg every 3 weeks) for up to 2 years.32 CT scans were performed at screening, 12 weeks after starting therapy, and at 9 week intervals thereafter. Radiographic responses as reported in the present study were assessed centrally per RECIST V.1.1. Best overall responses are reported for the length that any given subject was on trial (up to 2 years). Patient’s main clinical characteristics and clinical outcome are summarized in (online supplemental table S3).
Blood samples were drawn at baseline and 3 weeks after initiation of anti-PD-1 therapy (cycle 1). PBMCs were cryopreserved after routine Ficoll preparation by a specimen processing facility at the Cancer Immunotherapy Trials Network.33
T-cell sorting and phenotypic characterization
PBMC samples were thawed in RPMI (Gibco) 45% FCS with DNAse I (0.1 mg/mL, Stemcell), washed twice and resuspended in 150 µL PBS with DNAse I (50U, Stemcell) for 10 min at RT. Cells were then washed and resuspended in 50 µL PBS with Fc receptor blocking agent (eBioscience) and live/dead Zombie UV (Invitrogen) for 20 min at 4°C. Cells were washed and stained in 100 µL of staining buffer (PBS, 2 mM EDTA, 2% FCS) containing antibodies for CD3, CD8α, TCRαβ, PD-1 and TIGIT and incubated for 30 min at 4°C. PD-1 detection for on-treatment samples was performed using antihuman IgG4 biotinylated (Sigma, 20 µg.mL).7 34 After two washes, cells were stained in 100 µL of staining buffer containing antibodies for CD28, HLA-DR and CD38 (panel 1) or CD62L, CD95, CD45RO and CCR7 (panel 2) or Tim-3, Lag3 and CXCR5 (panel 3) and secondary antibody (streptavidin) and incubated for 30 min at 4°C. Corresponding isotype antibodies were used as a control. Cells were then washed twice before acquisition on a BD ARIA II cell sorter (BD Bioscience). Data were collected using the BD FACS Diva Software. Four subpopulations were sorted based on the expression of PD-1 and/or TIGIT, among live cells, CD3pos, CD8pos, TCRαβpos T cells. Approximately 5× 10⁵ cells were directly sorted in PBS and used for RNA and TCR sequencing experiments. For HLA-A2*0201 patients, 5×10⁴ cells were sorted, centrifuged and resuspended in 5 mL of RPMI 1640 (Sigma), 8% human serum, interleukin (IL)-2 (Novartis, 150 U/mL) and PHA-L (1 µg/mL) (Sigma) for in vitro expansion according to a procedure previously described.35 Briefly, sorted T cells (50 µL) were seeded in 96 well plate containing irradiated feeder cells (10×106 PBMC from two donors and EBV-transformed B cell-line). Amplified T cells were used for in vitro experiment after a 14 days amplification period.
CD3 (BV510, SK7), CD8α (BB700, HIT8a), PD-1 (BV421, EH12.1), CD28 (BB515, CD28.2), HLA-DR (PE, L243), CD38 (APC-R700, HIT2), CD62L (BV650, SK11), CD95 (PE, DX2), CD45RO (BB515, UCHL1), Tim-3 (BV650, 7D3), LAG-3 (APC-R700, T47-530), CXCR5 (BB515, RF8B2), CCR7 (APC-R700, 3D12) and streptavidin (BV421) reagents were purchased from BD Bioscience. TCRαβ (APC, IP26) and TIGIT (PE-Cy7, A15153G) antibodies were purchased from Biolegend.
Cytokine production
The production of 25 cytokines was measured by Luminex assay (EPX250-12166-901, ThermoFisher Scientific). Briefly, 50 000 sorted T cells were amplified on feeder cells after flow cytometry-based cell sorting (baseline and M1 from five patients in cohort 1). After 14 days of culture, 100 000 cells from each subset were stimulated in duplicate with 0.5 ug.mL anti-CD3 antibody (coated, clone OKT3). Supernatants were collected after 12 hours of culture and analyzed according to manufacturer instructions.
Antitumor reactivity
Interferon (IFN)-γ ELISPOT assays was performed to assess tumor-antigen reactivity by sorted and amplified T-cell populations from HLA-A*0201 patients. T cells (1×10⁵) were seeded in triplicate in precoated ELISPOT 96 well plates (Mabtech) either with tumor peptide (10 µg/mL), viral peptide (10 µg/mL) anti-CD3 antibody (positive control) (Mabtech, 1 µg/mL) or without stimulation (negative control) and incubated 24 hours at 37°C and 5% CO2. Plates were washed five times with PBS and incubated 2 hours at room temperature with 100 µL PBS 0.5% FBS with 1 µg/mL of biotinylated detection IFNγ. Plates were washed again five times with PBS before incubation with 100 µL of PBS 0.5% FBS streptavidin-HRP (Mabtech) for 1 hour. Plates were washed five times with PBS. TMB (tetramethhylbenzidine)-substrate solution (100 µL/well) and ELISPOT were developed for 15 min precisely. IFNγ spots were counted using an ELISPOT reader (Bio-Sys’ Bioreader). The number of spots forming units (SFU)/105 cells was calculated from triplicates after subtraction of the negative control. An IFNγ ELISPOT was considered positive when superior to background and at least >30 SFU/ 105 cells. All peptides were purchased from Genecust. Peptides are listed in online supplemental table S4.
RNA extraction
Total RNA were extracted from sorted T cells using RNeasy Kit (QIAGEN). Total RNA quality and quantity were assessed using high sensitivity RNA 6000 pico kit (Agilent) and Agilent 2100 Bioanalyzer. RNA with RIN >7 were obtained for all samples. Total RNA were stored at −80°C until TCR and gene expression profiling.
Gene expression analysis by RNAseq was done using 10 ng of total RNA with QIAseq Targeted RNA Custom Panel (CRHS-10563Z-975 and CRHS-10707Z-977) with QIAseq Targeted RNA 96-Index kits (QIAGEN) according to manufacturer’s recommendations. Briefly, RNA is treated with DNase to remove any residual DNA, and the RNA is reverse transcribed into cDNA. In the first reactions a gene-specific primer with Unique Molecular Indexes (UMIs) is used in a single primer extension reaction to capture the gene of interest. Next, a gene-specific reverse primer and a universal primer is used to capture and amplify the region of interest. A unique sample dual index is then added using a PCR reaction.
Sequencing libraries were quantified with QIAGEN’s QIAseq Library Quant System and quality control was performed by capillary electrophoresis on a TapeStation System (Agilent Technologies) using a High Sensitivity D1000 Screen Tape. Each library was diluted and normalized to 4 nM according to the QIAseq Library Quant results prior to pooling equally and denaturing. The denatured library pool with a final concentration of 1.2 pM was run on a NextSeq High Output V2 kit (Illumina) using dual indexing, single end sequencing with 150 cycles and a Custom Read 1 sequencing Primer.
QIAseq targeted RNA panel analysis
FASTQ files were generated from Illumina’s NextSeq Sequencing run and analyzed on QIAGEN’s GeneGlobe Data Analysis Center (https://www.qiagen.com/us/shop/genes-and-pathways/data-analysis-center-overview-page). GeneGlobe provides the primary read alignment and demultiplexed UMI values.
RNA sequencing data analysis
Raw count data were imported into R (V.3.5.2). The edgeR R package was used to calculate the normalization factors to scale the raw library sizes,36 followed by a voom transformation from the limma R package.37 38 Briefly, it transforms count data to log2 counts per million (log2 CPM), and estimates the mean-variance relationship to compute appropriate observation-level weights.
Differential expression analyzes were performed using the limma statistical framework and associated R package.38 39 A linear model was fitted to each gene, and empirical Bayes moderated t-statistics (two tailed) were used to assess differences in expression.39 Contrasts comparing time points, fractions and/or outcomes were tested. When needed, intraclass correlations were estimated to account for measures originating from the same patients.40 An absolute log2-fold change cut-off of 1 and an false discovery rate (FDR) cut-off of 5% were used to determine DEGs.
Gene set enrichment analysis (GSEA) was performed using the R function Camera implemented within the limma R package.41 The same contrasts as above were investigated. An FDR cut-off of 5% was used to determine significant gene sets. Kyoto Encyclopedia of Genes and Genomes (KEGG), Hallmark, immunological signatures (c7) and curated pathways were used as gene sets. Those gene sets were downloaded from MSigDB database.42
The Cancer Genome Atlas data analysis
We looked at the gene signature specific of PD-1 +TIGIT+ fraction at M1 in the bulk RNA-seq of 473 skin cutaneous melanoma tumors from TCGA. Using the R code and data provided by Jerby-Arnon et al.43 (https://github.com/livnatje/ImmuneResistance), we computed the overall expression of the upregulated differentially expressed genes between PD-1 +TIGIT+ and PD-1+, TIGIT+and PD-1-TIGIT-; and predicted the overall survival in TCGA melanoma patients using this signature. Kaplan-Meier curves were stratified by high (top 20%), low (bottom 20%) or intermediate (remainder) overall expression.
TCR-sequencing analysis cDNA librairies for TCR-seq analysis were prepared from 15 ng of total RNA using Human TCR Panel QIAseq Immune Repertoire RNA Library Kit (QIAGEN) according to manufacturer’s instructions and was described previously.44
Sequencing libraries were quantified with QIAseq Library Quant System (QIAGEN) and quality control was performed by capillary electrophoresis on a TapeStation System (Agilent Technologies). For sequencing, each library was diluted to 4 nM, pooled and denatured. Denatured library pool with 1.0 pM concentration was run on a NextSeq Mid Output V2 kit (Illumina) for asymmetrical pair-end 261×41 base read. FASTQ files were analyzed in the QIAGEN GeneGlobe Data Analysis Center as described previously.44
TCR sequencing data analysis
TCR sequence analysis was performed using R (V.3.5.2). The input data consisted of the observed number of each TCR (alpha or beta) sequence in each sample. Within each fraction, Fisher exact tests to calculate differential abundance of each TRBC (or TRAC) between two time points (T0 vs M1) were performed. The clonality score is derived from the Shannon entropy, which is calculated from the frequencies of all sequences divided by the logarithm of the total number of unique productive sequences. This normalized entropy value was then inverted (1—normalized entropy) to produce the clonality metric. Differentially abundant sequences (FDR 5%) were then divided into four clusters (emerging, expanding, contracting and non-expanding/contracting) according to their signs of the fold-change (negative or positive) between T0 and M1 and whether or not the sequence was present at T0.
Statistical significance
Statistical significance was determined using one-way ANOVA or Mann-Whitney test as indicated (Prism V.8, GraphPad Software). Differences were considered statistically significant when p<0.05. Only significant p values are displayed. Unless otherwise specified, experiments were performed without duplicates due to material restrictions.
Results
PD-1 and TIGIT coexpression identifies a T-cell subset predictive of PD-1 blockade efficacy
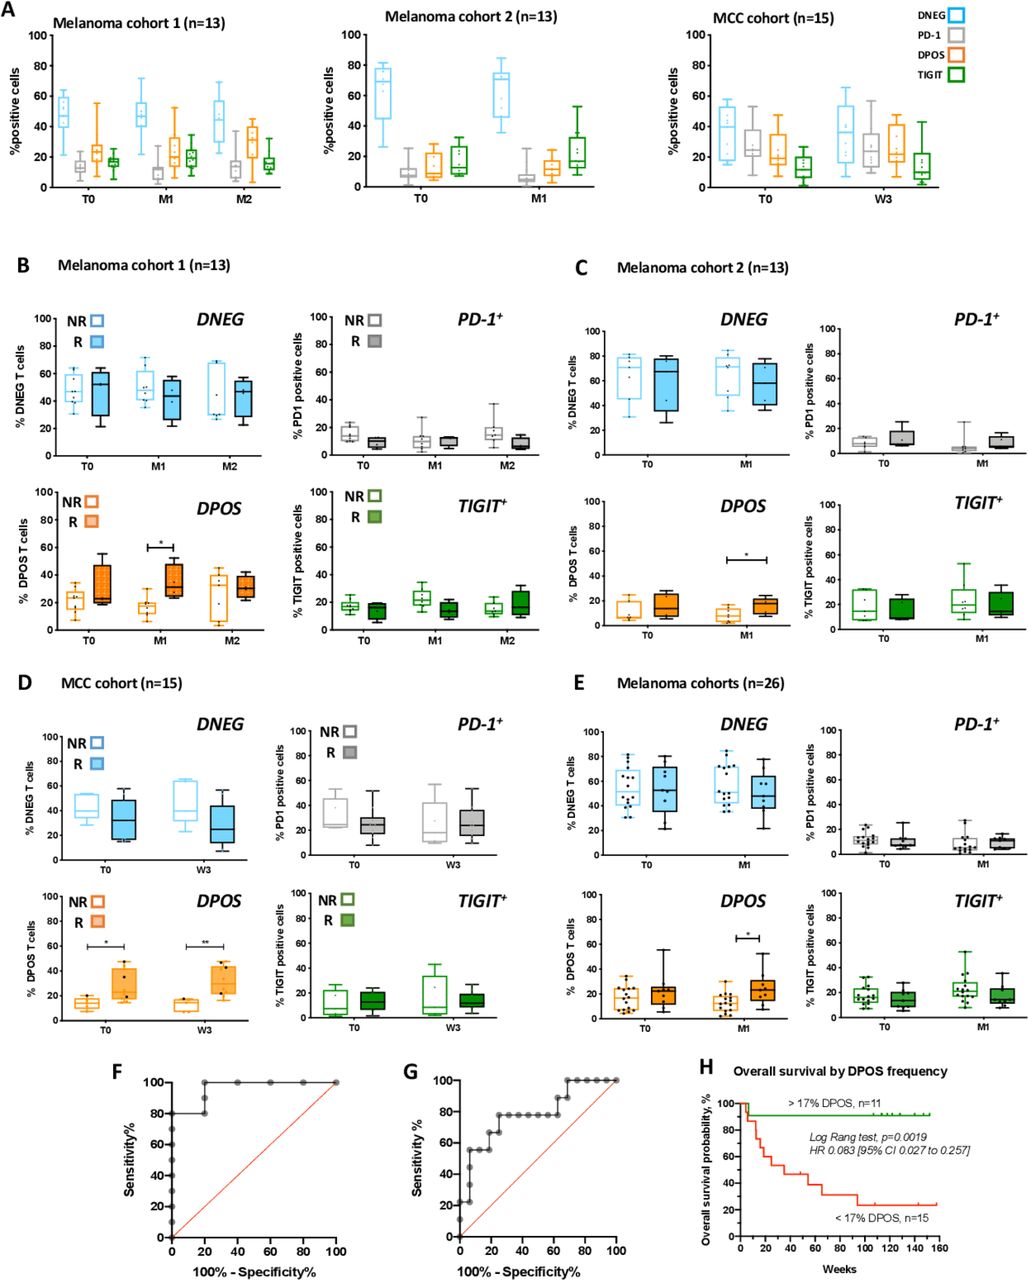
To assess the phenotype, function and clinical relevance of the peripheral CD8 T cell subset coexpressing PD-1 and TIGIT, we longitudinally isolated PBMCs from two cohorts of melanoma patients receiving anti-PD-1 therapy (13 patients in each cohort), and a cohort of MCC patients (n=15). Blood samples were obtained at baseline (before treatment initiation) and after 1 month of PD-1 inhibitor therapy, and also 2 months for the first melanoma cohort (online supplemental figure S1A). We sorted by flow cytometry four distinct CD8 T cell populations based on the expression of the inhibitory receptors PD-1 and TIGIT (ie, PD-1-TIGIT-, PD-1+TIGIT-, PD-1+TIGIT+ and PD-1-TIGIT+ sub-populations hereafter, respectively, referred as double negative (DNEG), PD-1, DPOS and TIGIT). The gating strategy is depicted in online supplemental figure S1B. Patients with partial and complete responses were classified as responders while non-responders exhibited SD or progressive disease (RECIST V.1.1). In the two melanoma and the MCC cohorts the frequencies of the four T-cell subpopulations within the entire CD8 peripheral T cell population were globally highly conserved across time (figure 1A) with the DNEG population being the most represented (46%±14% and 61%±19% in the two melanoma cohorts and 35%±13% in the MCC cohort). In melanoma cohorts, DPOS and TIGIT fractions are equally represented (globally around 20%), followed by the PD-1 fraction (13%±8% and 8%±7% in the two melanoma cohorts) (figure 1A, left and middle panels). In the MCC cohort, the TIGIT fraction appeared less represented (14%±10%) than the PD-1 (26%±14%) and DPOS (24%±13%) subpopulations (figure 1A, right). Strikingly, when responding and non-responding patients (online supplemental tables S1–S3) were analyzed separately in each patient cohort, the frequency of the DPOS subset was significantly higher in responding patients after 1 month of therapy, in contrast to the other subsets not significantly different according to clinical outcome (figure 1B–D). The frequency of the DPOS subpopulation thus appears predictive of anti-PD-1 efficacy at month 1 in the blood of melanoma and MCC patients.
Supplemental material

Frequency of PD-1+TIGIT+ (DPOS) peripheral T cells predicted therapeutic response to anti-PD-1. (A) Distribution of the four gated T-cell populations in the total CD8 population from the blood of melanoma patients (cohort 1 and 2, left and middle and MCC patients (left)) at baseline (T0), month 1 (M1) and month 2 (M2) for the first cohort, following anti-PD-1 therapy. Lines in box-and-whisker-plots indicate median values, boxes indicate IQR values and whiskers minimum and maximum values. (B) Percentages of DNEG, PD1 and TIGIT subpopulations according to clinical response to PD-1 therapy from the blood of melanoma patients (cohort 1) at baseline, and across time points following anti-PD-1 therapy (n=13). *P<0.05 using multiple comparison test corrected using the Holm-Sidak method. (C) Percentages of DNEG, PD1 and TIGIT subpopulations according to clinical response to PD-1 therapy from the blood of melanoma patients (cohort 2) at baseline, and across time points following anti-PD-1 therapy (n=14). *P<0.05 using multiple comparison test corrected using the Holm-Sidak method. (D) Percentages of DNEG, PD1 and TIGIT subpopulations according to clinical response to PD-1 therapy from the blood of MCC patients (n=15) at baseline, and across time points following anti-PD-1 therapy. *P<0.05, **P<0.01 using multiple comparison test corrected using the Holm-Sidak method. (E) Percentages of DNEG, PD1, DPOS and TIGIT subpopulations according to clinical response to PD-1 therapy in patients from the two melanoma cohorts. Lines in box-and-whisker-plots indicate median values, boxes indicate IQR values and whiskers minimum and maximum values.). *P<0.05 using multiple comparison test corrected using the Holm-Sidak method. (F, G) Receiver operator characteristic curves (ROC) defining the sensitivity and specificity of DPOS frequency in patients responding or not to anti-PD-1 therapy. (F) MCC patients (five non-responding and 10 responding). Area under the curve=0.96, p=0.0048. The cut-off value of 16.25% gives the highest accuracy, with 100% of sensitivity and 80% of specificity. (G) Melanoma patients from cohorts 1 and 2 (16 non-responding and 10 responding). Area under the curve=0.78, p=0.0203. The cut-off value of 17.35% gives the highest accuracy, with 77.8% of sensitivity and 75% of specificity. (H) Overall survival (weeks) of melanoma patients from the two cohorts grouped according to the estimated cut-off value of circulating DPOS frequency (<17%, red curve (n=15); >17% green curve (n=11)). Statistical comparison of survival curves was performed using log-rank (Mantel-Cox) test (p=0.0019). MCC, Merkel cell carcinoma; PD-1, programmed cell death 1 receptor.
We performed the same analysis at month 1 by grouping together patients from both melanoma cohorts (17 non-responding patients vs 9 responding patients), and confirmed results obtained on individual cohorts, namely that the frequency of the DPOS fraction at M1 was significantly associated with clinical responses (figure 1E). Finally, we performed receiver operator characteristic (ROC) curve analysis to evaluate the performance of the DPOS subset’s frequency in predicting response to PD-1 therapy with samples from the MCC cohort and the combined melanoma cohorts. The DPOS frequency appeared to predict response to PD-1 blockade significantly well with area under the curve values (AUC) of 0.96 for the MCC cohort (figures 1F and 5 non-responders and 10 responders, p=0.0048) and 0.78 for the melanoma cohorts (figures 1G and even non-responders and nine responders, p=0.0203), respectively. We also defined a cut-off for the frequency of the DPOS subset that could be used to predict response to PD-1 inhibitors. We identified 17.35% for melanoma patients (77.8% sensitivity and 75% of specificity) and 16.25% for MCC patients (100% of sensitivity and 80% of specificity) as potentially relevant values.
Based on this cut-off value, we further explored whether DPOS frequency was associated with overall survival in the two melanoma cohorts. As shown on figure 1H, the overall survival of patients with circulating DPOS frequencies >17% (green curve, n=11) is significantly better than that of patients with DPOS frequencies >17% (red curve, n=15, p=0.0019).
Thus, in three independent cohorts of patients and across two distinct pathologies, we identified the frequency of PD-1 +TIGIT+ CD8 T cells in the blood as a promising and early, cellular based, immune marker of response to PD-1 therapy and of overall survival.
DPOS T cells exhibit an activated phenotype and are enriched in CXCR5+ T cells
We next characterized by flow cytometry the levels of PD-1 and TIGIT expression associated with the DPOS subpopulation, in the three patients’ cohorts. Notably, the median level of PD-1 expression was significantly higher on the DPOS population compared with the PD-1 single positive population at baseline and after initiation of the therapy (figure 2A, not significant at baseline for the first melanoma cohort p=0.11). The median level of TIGIT expression was similar between the DPOS and the TIGIT populations (online supplemental figure S2A). Coexpression of TIGIT with PD-1 on CD8 T cells was restricted to cells with high level of PD-1 expression, possibly due to strong activation. This finding is consistent with a previous report in non-small cell lung cancer (NSCLC) patients describing a correlation between TIGIT expression on CD8 TILs and peripheral lymphocytes expressing high levels of PD-1.45 A recent report also identified high levels of PD-1 expression on CD8 T cells in TILs in NSCSLC patients as a feature predictive of PD-1 therapy outcome, consistent with our data in other cancer types.15 Tim-3 and Lag-3 expression were weakly detected in the four different populations (assessed on the first melanoma cohort) confirming previous reports19 23 (online supplemental figure S2B and S2C). Our results highlight again the different expression patterns for inhibitory receptors on peripheral CD8 T cells vs TIL, and the special relevance of monitoring PD-1 and TIGIT coexpression on circulating CD8 T lymphocytes.

PD-1+TIGIT+ (DPOS) peripheral T cells depict an activated phenotype. (A) Median of PD-1 fluorescence in PD-1 and DPOS subsets in the three cohorts at different timepoints. *P<0.05, **p<0.01, ***p<0.001 by multiple t-tests corrected for multiple comparisons by the Holm-Sidack method. (B) Percentages of HLA-DR/CD38 positive CD8 T cells among the four subsets, in the three cohorts, across timepoints. *P<0.05, **p<0.01, ***p<0.001 by multiple t-tests corrected for multiple comparisons by the Holm-Sidack method. (C) Percentages of CXCR5 positive CD8 T cells among the four subsets, in the three cohorts, across timepoints. *P<0.05, **p<0.01, ***p<0.001 by multiple t-tests corrected for multiple comparisons by the Holm-Sidack method. PD-1, programmed cell death 1 receptor.
Observation of the immunological response to PD-1 blockade in the blood of cancer patients has notably been described by a proliferative burst of CD8 T cells expressing the intracellular proliferation marker Ki67.26 34 46 The combined expression of the ectoenzyme CD38 and HLA-DR at the T-cell membrane strongly correlates with Ki67 expression on vaccine-induced T cells34 47 and was used to determine what T-cell fraction contributes to the proliferative burst in vivo following anti-PD-1 therapy. We found that HLA-DR/CD38 coexpression was largely restricted to the DPOS T-cell fraction in the three cohorts at baseline and we observed a marked increase in frequency of HLA-DR+CD38+ cells following PD-1 blockade (figure 2B and online supplemental figure S1C, upper panel). Furthermore, for the MCC cohort of patients, the frequency of HLA-DR+CD38+ cells was significantly higher within the DPOS subset compared with the three other populations after only one cycle of therapy (figure 2B, right panel). Thus, PD-1 and TIGIT coexpression, rather than PD-1 alone, in the blood of melanoma and MCC patients receiving anti-PD-1 therapy identifies a CD8 T cell subset enriched for HLA-DR and CD38 coexpression that increases markedly in frequency in the very first weeks of therapy, and this increase is associated with clinical outcome.26 34 46
Recent studies identified a CXCR5+ population of CD8 T cells as the pendant of CD4 Tfh named cytotoxic Tfc that localizes in secondary/tertiary lymphoid organs.25–31 We, thus, investigated longitudinally CXCR5 expression on the 4 T-cell subpopulations from the three cohorts of cancer patients. Again, CXCR5+ cells were largely confined to the DPOS population with significantly higher frequencies in comparison to the DNEG and PD-1 populations regardless of the time point for the three cohorts (figure 2C and online supplemental figure S1C, lower panel) and to the TIGIT single positive population for the melanoma validation cohort and the MCC cohort after initiation of PD-1 therapy (figure 2C, middle and right panels). While described as very transiently detectable in the blood of mice in another study (present at D8 and undetectable at D3026), here the increased frequency of CXCR5+ cells within the DPOS T cell population within the blood remained stable until M2 (figure 2C, left panel). Nonetheless, the expression of these markers (HLA-DR/CD28 and CXCR5), while appearing to be a characteristic of this subpopulation, only occurs in a fraction of these cells, which also suggests that this DPOS T cell subpopulation is heterogeneous, possibly consisting of a mixture of activated/exhausted T cells and of Tfc like T cells.
We performed a more complete analysis of the differentiation status of the T cell subsets on the 13 melanoma patients from the original cohort. Naïve T cells (CD45RO-CCR7+CD62L+CD95low) were almost exclusively present in the DNEG population at all time points as expected (online supplemental figure S5D, left panel). The distribution of TEM (CD45RO+CCR7-CD62L-CD95+) and TEMRA (CD45RO-CCR7-CD62L-CD95+) is totally reversed in the 4 T cell-subpopulations, with the majority of TEM present in the PD1+ and DPOS fractions (>60% at baseline), and the majority of TEMRA detected in the TIGIT+and DNEG fractions (around 60% at baseline) (online supplemental figure S2D) middle and right panel). CD28 costimulatory receptor was described as the primary target of PD-1 mediated T-cell inhibition and T-cell reinvigoration on PD-1 blockade.46 48 Consequently, we assessed CD28 expression longitudinally on the 4 T-cell subpopulations of interest on the first melanoma patients’ cohort and the MCC patients’ cohort. Before therapy, DNEG and PD-1 populations expressed CD28 molecules at very high frequencies (around 80% online supplemental figure S2E and S2F). We observed a slightly reduced frequency of cells expressing CD28 on the DPOS population on the two cohorts (not significant) and another marked and significant reduction for the TIGIT population (around 30%). Interestingly, CD28 expression was not altered on the different T-cell subpopulations on PD-1 blockade. Altogether, analysis of the differentiation status and CD28 expression profile suggest that the TIGIT population could represent a more differentiated T-cell population.
Altogether, these findings describe PD-1+TIGIT+ CD8 T cells as the main proliferative T-cell population in response to PD-1 therapy and exhibit an effector-like phenotype, a greater number of PD-1 molecules at the membrane, a maintained CD28 expression and a higher frequency of T-cells expressing the Tfc marker CXCR5. Strikingly, the increase in DPOS frequency at M1 within the entire peripheral CD8 T cell population was predictive of anti-PD-1 therapeutic efficacy in three independent cohorts and across two distinct cancer pathologies. These findings prompted us to characterize the DPOS CD8 T-cells in greater depth
DPOS T cells exhibited a distinct gene signature
We then performed targeted RNA-sequencing of 975 genes related to gene activation on the different T-cell subsets sorted before therapy and at M1 and M2 from the blood of our initial cohort of 13 melanoma patients. Multidimensional scaling markedly distinguished the DNEG population from the three other T cell subsets showing that the single expression of at least one of the inhibitory receptors PD-1 or TIGIT was sufficient to distinguish gene expression profiles from DNEG CD8 T cell population within the blood of melanoma patients (figure 3A). The PD-1 population also clustered independently from the others, even from the DPOS subset, suggesting particular features of DPOS cells that have significantly higher level of PD-1 expression by flow cytometry. In contrast, transcriptomic profiles from the two populations sorted based on the expression of TIGIT (ie, DPOS and TIGIT populations) were largely overlapping suggesting acquisition of a common gene expression program in parallel of TIGIT expression.
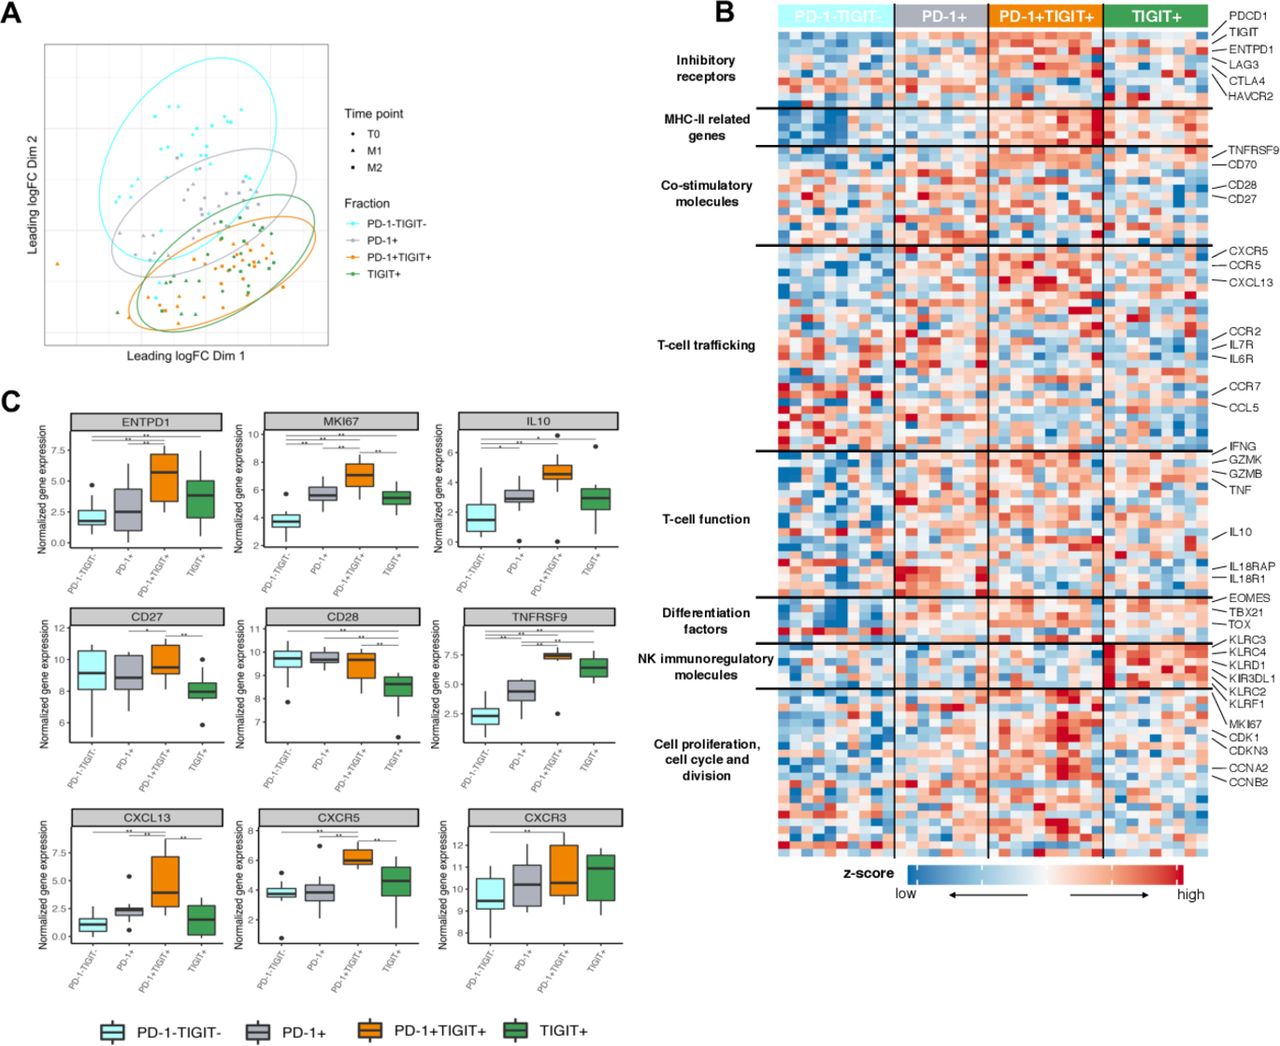
DPOS T cell subset exhibit a specific gene signature (A) multidimensional scaling (MDS) analysis for the DNEG, PD-1, DPOS and TIGIT populations (n=11). Each dot is a sample colored by fraction and shaped by time point. (B) Heatmap reporting scaled expression of differentially expressed genes (FDR 5% and log2FC >1) between DPOS and DNEG, PD-1 and/or TIGIT subsets. Genes are ordered by biological functions. The color scheme is based on z-score distribution from low (blue) to high (red). (C) Box plots of selected genes declared as significant between DPOS and DNEG, PD-1+ and/or TIGIT+. *P<0.05, **p<0.01 by one-way ANOVA. lines in box-and-whisker-plots indicate median values, boxes indicate IQR values and whiskers minimum and maximum values. ANOVA, analysis of variance; PD-1, programmed cell death 1 receptor.
There was no DEG detected for a given sorted population across time points (exception of MYO7A gene in the DNEG population between T0 and M1, (online supplemental figure S3A and S3B). The major differences in gene expression profiles were then observed between the different subpopulations disregarding the time point (online supplemental figure S3C). At M1, we first confirmed that the expression profiles of the PDCD1 and TIGIT genes were consistent with the phenotypic characteristics of the four subpopulations (figure 3B). The DPOS population displayed higher expression of MHC-II related genes (HLA-DPA1, HLA-DQA1, HLA-DRA, HLA-DRB1, CD74) and genes associated with cell proliferation, cell cycle and cell division (CDKN3, CDK1, CCNA2, CCNB2, UBEC2C) hence describing a population of highly activated and proliferating T cells (figure 3B,C). The DPOS population expressed high transcript levels of IFNG and GZMK gene transcripts but intermediate levels of GZMH, GZMB, GZNA and tumor necrosis factor (TNF) transcripts. IL-10 transcript was overexpressed by the DPOS population, compared with the DNEG subset, suggesting acquired altered functional profile (figure 3C). Consistent with higher frequency of HLA-DR+CD38+ cells observed by flow cytometry, the proliferation marker MKI67 was upregulated at the mRNA level on the DPOS population compared with the three other subsets (figure 3B,C). Regarding costimulatory molecules, CD28 expression was similar between DPOS, PD-1 and DNEG population and was lower on TIGIT population confirming flow cytometry data (figure 3C). CD27 expression was also maintained on DPOS and PD-1 populations but reduced on TIGIT population (figure 3C). CD27 was notably described as a key feature of a CAR T-cell population responsible for tumor control49 and was overexpressed by PD-1high TILs associated with response to PD-1 blockade in NSCLC.15 Finally, 4-1BB (TNFRSF9) was overexpressed on the DPOS population and was also higher on the TIGIT population compared with PD-1 and DNEG ones (figure 3C). Tumor-reactive T cells, including neoantigen-specific T cells, have been successfully enriched from the blood or the tumor of cancer patients using 4-1BB, PD-1 and CD39 markers.50–54 The DPOS population overexpressed all of these markers again suggesting recent tumor-antigen encounter. Furthermore, several genes related to immune T-cell trafficking (CCR5, CXCL13, CCL4L2, CCL3) were also upregulated on the DPOS population compared with PD-1 and TIGIT populations (figure 3B). Interestingly, CXCL13 and its receptor CXCR5 were significantly upregulated on the DPOS population, compared with all the other subsets, consistent with cytometry results for CXCR5 expression (figures 3C and 2C). CXCR3, a chemokine receptor for the IFN-inducible chemokines CXCL9, CXCL10 and CXCL11 and demonstrated as required on CD8 TILs for effective antitumor response under PD-1 therapy55 56 was upregulated only on the peripheral DPOS population in comparison to the DNEG population (figure 3C). The DPOS population also over-expressed the transcription factor TOX (figure 3B), recently described as hallmark of T cell exhaustion.57–59 These results highlight that the DPOS T cell subset is likely to be a heterogeneous population consisting of relevant T cells with features described as restricted to progenitor stem-cell like cells but also activated/exhausted T cells.
In contrast, PD-1 and TIGIT populations exhibited an intermediate transcriptomic profile regarding these gene clusters. Surprisingly, TIGIT population highly upregulated several immunoregulatory receptors classically expressed on NK cell subset (KLRC2, KLRC3, KLRC4, KLRD1, KLRF1, KIR3DL1) and the transcription factor TBX21. These results, together with the large proportion of TEMRA cells observed in this population (online supplemental figure S2D) is consistent with a more terminally differentiated state (figure 3B).
Gene signature of DPOS T cell subset correlated with clinical outcome
Two recent reports described a population of dysfunctional TILs with predictive potential, identified by high PD-1 and CXCL13 expression, with impaired T cell function, high proliferative potential and a distinct transcriptional profile.14 15 Given the high level of similarity with the DPOS population described here, we performed GSEA using the 23-gene signature upregulated in these TILs populations. The DPOS population was strongly enriched for the two different gene signatures in contrast to PD-1 and TIGIT populations (figure 4A). Consequently, the DPOS population from the blood of melanoma patients contained T cells that can be described as the pendant of PD-1high TIL population found in NSCLC patients.

DPOS T cell-specific gene signature correlated with clinical outcome (A) enrichment plots between DPOS vs PD-1 or TIGIT from GSEA using a 23-gene signature upregulated in TILs populations.14 15 (B) Upset-diagram representing the number of differentially expressed genes between DPOS and the other subsets at M1 (FDR 5% and log2FC >1). Black circles indicate populations compared with the DPOS subset. Groups of populations compared with the DPOS subset are indicated with solid black lines connecting individual black circles. Orange bar-graph represent gene sets differentially expressed between DPOS and the three other subsets combined. (C) Kaplan-Meier (KM) plot stratified by high, intermediate or low overall expression of the DPOS transcriptomic signature in bulk RNA-seq of TCGA tumors. P: COX regression p value. (D) Box plot of CXCL13 expression in DPOS population in NR and R at T0. *P<0.05 by Mann-Whitney U test. Lines in box-and-whisker-plots indicate median values, boxes indicate IQR values and whiskers minimum and maximum values. (E) Pathways upregulated in responding versus non-responding patients in the DPOS subset at M1 identified using gene set enrichment analysis with KEGG (blue BAR) and hallmark (black bars) databases. PD-1, programmed cell death 1 receptor; TCGA, The Cancer Genome Atlas; TILs, tumor infiltrating lymphocytes;
We next defined a gene signature specific to the DPOS population based on DEGs that overlapped when comparing DPOS transcriptomic profile to DNEG, PD-1 and TIGIT subsets at M1 (figure 4B). This DPOS-specific program contained 12 upregulated genes with notably PDCD1, CXCL13, CXCR5 and MKI67 (complete list online supplemental table S5). Despite being expressed at similar levels between the DPOS and TIGIT populations (online supplemental figures S2A and S3D), we decided to include TIGIT within this gene signature as this marker was used to sort the different cell subsets. We tested the ability of this DPOS gene signature to predict clinical outcome in melanoma patients with bulk RNA-seq from TCGA. Our DPOS gene signature was highly predictive of survival in 473 melanoma patients, even out of any immunotherapy context (p=2.2×10⁻⁴, log rank=5.4×10⁻⁵) (figure 4C).
Furthermore, analysis according to the clinical response (NR vs R) described CXCL13 as the only gene differentially upregulated in responding patients within the DPOS population at T0 strengthening the crucial role of this chemokine in driving an effective anti-PD-1 immune response (p=0.040, figure 4D). Moreover, despite the limited number of genes analyzed, gene enrichment pathway analysis revealed notably the cytokine-cytokine receptor interaction pathway as the most up-regulated pathway within the DPOS subset in responding patients compared with non-responding ones (p=9.88×10⁻⁵, FDR=0.011) suggesting that high migration capacities for the DPOS population constituted an important feature for therapeutic efficacy (figure 4E).
Thus, the transcriptomic analysis revealed a specific gene signature for the circulating DPOS T cell population that is predictive of response to PD-1 therapy, strongly associated with survival in melanoma patients, and comparable to that of TILs with predictive potential in NSLCC.
DPOS population is functional and enriched for tumor antigen-specific T cell clones
Transcriptomic analysis of DPOS T cells highlighted the expression of genes associated with exhaustion. We, therefore, compared the reactivity of the four sorted fractions from five patients from the first cohort (three NR and two R), at baseline and M1, based on their ability to produce cytokines on anti-CD3 stimulation. We detected the production of 10 cytokines among the 25 tested, GM-CSF being the most produced cytokine by these CD8+ T cells subpopulations. IFN-γ, TNF-α, IL-13 and IL-4 were also strongly produced by all the T cell subpopulations (online supplemental figure S4). No significant differences were observed between the different subsets, although cytokine production by DPOS T cells appeared slightly lower than that of other T cell subpopulations. These results describe, at the bulk level, that T cells isolated from the four fractions contain functional and reactive T cells and could be classified as classical pro-inflammatory CD8+ T cells nonetheless this method doesn’t resolve intrasubset heterogeneity. Therefore, the possibility that DPOS T cells contains a fraction of exhausted-like T cells with altered cytokine production remains.
Nonetheless, the association between the high frequencies of the DPOS population in the blood after 1 month of therapy and clinical responses prompted us to hypothesize that this subset could be enriched in recirculating tumor-specific T cells. As tumor material was not accessible for this study, we assessed the tumor reactivity of the four sorted subpopulations from 7 HLA-A*0201 patients at T0 and M1 after in vitro expansion against a panel of 11 peptides derived from melanoma antigens (online supplemental table S4).60 The total number of responses was increased following anti-PD-1 therapy (19 tumor-specific responses detected at T0 and 29 at M1) (figure 5A). Notably, the number of responses observed in the DPOS T cell population was more than doubled (7 vs 15 responses at T0 and M1, respectively, figure 5A,B). An example of ELISPOT images is shown in online supplemental figure S4C, from P19 patient. PD-1 blockade also diversified the antigens recognized within this subset (6 vs 9 epitopes at T0 and M1, among them melanocytic differentiation, tumor-specific and the overexpressed antigen PRDX5) (figure 5B). Nonetheless, tumor reactivity was not restricted to the DPOS fraction as PD-1 and TIGIT populations also depicted antigen recognition but less amplified and diversified on PD-1 blockade (figure 5B). Notably, diversity and numbers of responses detected within the PD-1 population moderately decreased following PD-1 therapy (6 vs 4 recognized tumor epitopes). This could result to a conversion of the tumor-reactive T cells from PD-1 to DPOS population exemplified in P15 and P19 patients for Melan-AA27L, gp100YLE, SSX2KAS and NA17-AVLP specific responses (figure 5B). The DNEG population displayed two responses pretherapy and three at M1 all modest in magnitude and specific for the melanocyte differentiation antigen melan-A or the tumor-specific antigen LAGE-1 (figure 5B,C). The TIGIT population displayed a more diverse range of antitumor responses with three new antigens recognized after PD-1 blockade but both the magnitude and number of these responses remained smaller than for the DPOS population (figure 5A,B). One patient among the 7 HLA-A*0201 developed a CR (P8) and we observed the development of 4 newly detected antitumor responses at M1 within the DPOS population (figure 5A,B).

PD-1+TIGIT+ T cell subset is enriched in tumor-reactive T cells at month 1. (A) Total numbers of antigen-specific T cell responses within each subset from the 7 HLA-A2 patients. (B) Antigen-specific responses in the 4 T cell populations sorted at T0 and M1 from 7 HLA-A*0201 patients, detected by IFN-g specific ELISPOT assay. Each bar represent the number of responses against a given epitope. (C) Heat map reporting the number of spots forming unit (SFU)/106 T cells from the DNEG, PD-1, DPOS and TIGIT subsets sorted from HLA-A*0201 patients at T0 and M1 and amplified on feeder cells before stimulation with tumor peptides. For each patient, left column illustrates T cell responses at baseline, and right column illustrates T cell responses at M1. IFN, interferon; PD-1, programmed cell death 1 receptor.
The emergence of new clonotypes within the DPOS fraction on PD-1 blockade is associated with therapeutic response
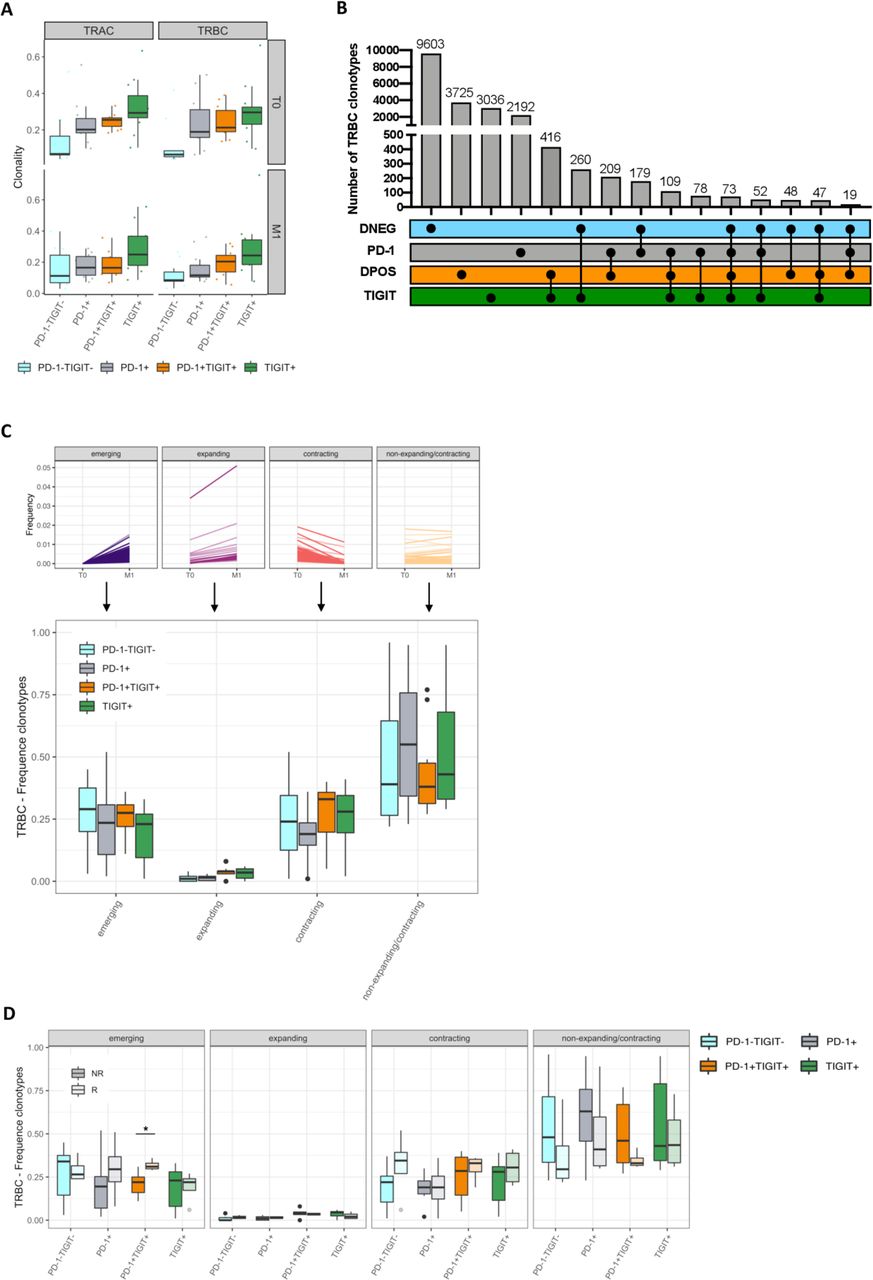
Our data shows that antigen-specific T cell responses within DPOS T cells were diversified on PD-1 blockade that could be the reflection of the effective stimulation of new highly reactive tumor-specific T cells, associated with clinical benefit. This prompt us to assess dynamic changes within the TCR repertoires of the DPOS and other 3 T-cell populations distinguished by different inhibitory receptor expression patterns. We performed TCRα and TCRβ sequencing analysis of the four sorted T-cell populations (11 patients from the first cohort: 7 NR and 4 R) at T0 and M1. Clonality analysis revealed the DNEG repertoire as the most diverse at both timepoints. PD-1 and DPOS populations exhibited higher and similar clonality while TIGIT population displayed a further reduction in T-cell repertoire diversity (figure 6A). Frequency analysis of the most common TRAC and TRBC clonotypes again demonstrated greater clonal expansion within the DPOS, PD-1 and TIGIT repertoires (online supplemental figure S5A). At baseline, the top 10 TRBC clonotypes represented 18,8% of the DNEG repertoire but 45.4%, 44.8% and 53.8% of the PD-1, DPOS and TIGIT repertoires, respectively, with very similar results at M1 and for TRAC repertoires. This clonal enrichment is likely to be driven by clonal expansion following TCR engagement and these global analyzes could not reveal any effect of PD-1 blockade on these characteristics.

Repertoire analysis describes emerging clonotypes within the DPOS repertoire as associated with PD-1 clinical efficacy. (A) TRAC and TRBC repertoire clonality from DNEG, PD-1, DPOS and TIGIT subsets in T0 and M1 (n=11). Lines in box-and-whisker-plots indicate median values, boxes indicate IQR values and whiskers minimum and maximum values. (B) Upset diagram showing private and shared TRBC sequences across the four fractions at M1. Individual black circles indicate TRBC repertoires private to a given populations. Black circles connected with solid black lines indicate TRBC repertoires shared between the given fractions. (C) Percentage of TRBC clonotypes across clusters and fractions. Typical signatures for each cluster are illustrated in the upper panel; (D) percentage of TRBC clonotypes across subsets, clusters and outcome at M1. *P<0.05 using the Mann-Whitney U test. PD-1, programmed cell death 1 receptor.
As expected, T-cell repertoires were largely patient specific as measured by Morisita’s overlap index (online supplemental figure S5B). But more surprisingly, when we analyzed the overlap for the TRAC and TRBC repertoires between the four sorted subsets in individual patients, T-cell repertoires were also mostly private with few shared clonotypes between fractions (figure 6B and online supplemental figure S5C). Indeed, less than 7% of TRBC clonotypes were shared between at least two different fractions at M1 clearly underlying the distinct origins of the majority of these four populations. Nonetheless, the highest number of shared clonotypes were found between DPOS and TIGIT subsets (figure 6B and online supplemental figure S5C), consistent with the highest similarity between the DPOS and the TIGIT fractions observed through RNAseq analyzes (figure 3A).
We next defined four different clusters of clonotypes within each T-cell repertoire based on their statistically significant expansion or contraction profile on PD-1 therapy between T0 and M1: cluster 1 of emerging clonotypes (not detected at baseline but detected at M1), cluster 2 of expanding clonotypes (present at baseline and expanded in frequency on PD-1 blockade), cluster 3 of contracting clonotypes (with a decreased frequency between baseline and M1) and cluster 4 of non-expanding/non-contracting clonotypes that are not affected during the first month of PD-1 therapy. Typical signatures for each cluster are illustrated in figure 6C, upper panel. Overall, the global distribution of clonotypes within these clusters was similar for the 4 T-cell subsets. Cluster four was the most frequent class for all fractions while expanding clonotypes (cluster 2) represented the less frequent one (figure 6C). Emerging and contracting clonotypes (clusters 1 and 3, respectively) depicted similar frequencies illustrating typical behavior for a given repertoire where new clonotypes emerge replacing former ones within the entire repertoire (either following standard homeostasis mechanisms or T-cell priming and recirculation). Interestingly, the absolute numbers of these two classes of clonotypes appeared slightly higher in the DPOS population compared with the PD-1 and TIGIT repertoires (online supplemental figure S6A). Consistent with its higher diversity, the absolute number of clonotypes was higher in clusters 1, 3 and 4 for the DNEG repertoire (online supplemental figure S6A). We finally explored the distribution of the 4 clusters of clonotypes in the different subpopulations according to clinical outcome (figure 6D). Strikingly, cluster 1 of emerging clonotypes depicted significantly higher frequency for the DPOS subset in patients responding to PD-1 therapy (p=0.040). The importance for newly detected tumor-resident clonotypes in the peripheral blood was notably recently highlighted to prevent relapse in melanoma patients receiving ipilimumab and nivolumab in neoadjuvant settings.61 Accordingly, the absolute number of emerging clonotypes in the DPOS population was also higher in responding patients (p=0.06) (online supplemental figure S6B). A similar trend was observed for the PD-1 fraction, although not significant, nor in frequency or absolute number, illustrating again the preponderant importance of the DPOS population for anti-PD-1 clinical efficacy rather than PD-1 single expressing repertoire. Balancing this emergence of clonotypes, the frequency and absolute number of contracting clonotypes were slightly higher in the DPOS repertoire in responding patients (figure 6D and online supplemental figure S6B). Finally, the frequencies of non-expanding/non-contracting clonotypes (cluster 4) were lower in DNEG, PD-1 and DPOS repertoires in responding patients while TIGIT repertoire distribution remained largely unchanged. This change in DNEG repertoire was balanced within the entire repertoire by a higher frequency of contracting clonotypes and could delineate the conversion of DNEG T cells to PD-1 or DPOS repertoire following antigen encounter as suggested in a recent study.62
In conclusion, we found that cluster 1 of emerging clonotypes within the DPOS subset identified by the coexpression of PD-1 and TIGIT were associated with clinical responses. As the DPOS fraction was enriched in tumor-antigen specific T lymphocytes, we hypothesize that these emerging clonotypes could contain a fraction of antigen-specific T cells recirculating to the periphery after activation following anti-PD-1 therapy.
Discussion
Clinical efficacy of PD-1 pathway inhibitors relies on the reactivation of endogenous tumor-specific immunity and on the priming of a distinct TCR repertoire in lymphoid organs, but predicting clinical benefit remains challenging and the precise immune mechanisms associated with clinical responses incompletely understood.63 PD-1 and TIGIT inhibitory receptors are detected in a particular expression pattern on a substantial percentage of peripheral CD8 T cells, unlike other inhibitory molecules.19 Despite their described inhibitory properties on T cells, PD-1 and TIGIT also mark recently activated T cells.23 64 65 We and others have suggested a critical importance for PD-1+TIGIT+ T cells in anti-PD-1 clinical efficacy and dual targeting of PD-1 and TIGIT have been shown to synergize to restore antitumor immunity.5 13 21 66 Consequently, we sought to analyze and evaluate the clinical relevance of peripheral CD8 T cells that coexpress PD-1 and TIGIT in melanoma and MCC patients receiving anti-PD-1 inhibitors. Strikingly, we observed that the frequency of the DPOS subset in the peripheral blood after 3 weeks (1 cycle for MCC patients) or one month (2 cycles for melanoma patients) of PD-1 therapy was associated with clinical benefit in three independent cohorts and across two distinct pathologies. ROC curve analysis described the DPOS frequency as a relevant predictor when performed with samples from the combined melanoma cohorts (AUC=0.76) and the MCC cohort (AUC=0.96) but would nonetheless require additional validation cohorts. The frequency of DPOS T cells performed equally than the recently described computational method TIDE in predicting response to PD-1 blockade in melanoma patients while being more convenient for routine usage (RNA-seq analysis vs flow cytometry test).67 It also outperformed the described biomarkers such as tumor mutational burden, IFN-γ score and PD-L1 expression.67–69 These conventional biomarkers are indeed all related to and influenced by the presence and activation status of tumor-specific CD8+ T cells that we have shown here to be enriched in the DPOS subset suggesting their pivotal role for anti-PD-1 mediated antitumor efficacy. Using ROC curve analysis, we also proposed a cut-off for the frequency of DPOS T cells of 17.35% for melanoma patients (with 77.8% sensitivity and 75% of specificity, p=0.0203) and 16.25% for MCC patients (with 100% of sensitivity and 80% of specificity, p=0.0048). While the aim of our study was not formally to define this cut-off but rather to deeply characterize this subpopulation and demonstrate its interest for the immune follow-up of anti-PD-1-treated patients, we are convinced that this parameter could be further used in clinical practice, especially to predict non-responders and quickly redirect them to other therapies. In support of this, and based on this cut-off value of 17%, we also showed that circulating DPOS frequency was also associated with overall survival of melanoma patients (p=0.002).
Of note, the frequency of DPOS T cells at baseline is associated with therapeutic responses in patients with Merkel cells’ carcinoma. The same trend (not significant) is observed for patients with melanoma. Pre-existing antiviral T-responses in patients with MCC may possibly account for this difference. Indeed, the presence of oncogenic viruses in virus-associated cancers, wherein viral antigens serve as tumor-specific antigens, has been proposed as a potential mechanistic marker that can predict response to anti-PD-1 therapy.70 These pre-existing antivirus T cells are probably enriched in the DPOS subset. It is also important to note that in both cohorts of melanoma patients, some patients are treatment naïve and others have received previous lines of targeted therapies or immunotherapy. Larger cohort studies would allow subgroup analyzes of these patients to document whether these prior therapies influence the frequencies and course of this DPOS subpopulation. Indeed, several reports documented that tumor biomarkers such as tumor mutation load and TCR repertoires could be more useful in treatment-naïve patients.71
Flow cytometry and transcriptomic analysis of this circulating DPOS population from melanoma patients showed that compared with other subsets, DPOS T cells express higher levels of proliferation markers (Ki-67, HLA-DR, CD38) and inhibitory receptors but retain high coexpression of the costimulatory molecules CD27, CD28 and 4-1BB. CXCR5 was recently described as a marker of CD8+PD-1+ T cells with self-renewal capacities responsible for the proliferative burst in the blood following anti-PD-1 therapy.26 27 These Tfc cells exert antitumor activity and correlate with a favorable prognosis in cancer patients.30 Here, we demonstrate that CXCR5 expression in the blood of melanoma patients receiving anti-PD-1 therapy is largely restricted to the DPOS subset rather than to T-cells only expressing PD-1.
Interestingly, despite sorting the 4 T cell populations beforehand, our targeted transcriptomic analysis didn’t reveal any gene differentially expressed on PD-1 therapy that correlate with clinical outcome. This result is consistent with a previous report by Huang et al 18 where only a very limited number of genes were significantly modulated on PD-1 blockade when total RNA sequencing analysis was performed at the bulk population level and from the periphery. Nonetheless, this study highlighted a number of genes with altered expression and following a similar pattern than Ki67. They described a list of overexpressed genes comprizing inhibitory receptors, HLA-DR genes, CD38 and other genes involved in T cell proliferation and CD28 co-stimulation. This list is, therefore, entirely overlapping with the specific transcriptomic profile describing the DPOS subset found here. These results argue for subtle variations of the cellular composition within the entire peripheral T cell repertoire as the best marker to identify responding patients and resonates with our observation of emerging clonotypes being associated with clinical response to PD-1 inhibitors and restricted to the DPOS fraction.
Furthermore, the gene signature specific to this DPOS population (12 genes, among them CXCL13 and CXCR5) was also strongly predictive of long-term survival in melanoma patients using TCGA database (not in the context of anti-PD-1 therapy). CXCL13 expression was recently described as a key feature of CD8 PD-1high TILs that predict response to anti PD-1 in NSCLC.15 In this study, we found that CXCL13 was strongly overexpressed by the DPOS population and CXCL13 expression at baseline on this population was predictive of PD-1 therapeutic efficacy. Furthermore PD-1 median of expression was higher on the DPOS subset than on the PD-1 population. Thus, PD-1 and TIGIT coexpression appears to contain a fraction that could be the pendant of this PD-1high TIL population in the blood of cancer patients.
Clinical efficacy of PD-1 pathway inhibitors relies on the activation of endogenous tumor-specific immunity, and TCR repertoire analysis is a promising strategy to assess antitumor benefits following immunotherapy. Patients with a low diversity evenness were described as more likely to respond to PD-1 therapy72 and TCR sequencing in the blood of one melanoma patient described expansion and maintenance of tumor-reactive T cells up to 8 months following initiation of PD-1 therapy.73 Previous studies demonstrated that PD-1 therapy also drives oligoclonal expansion of a restricted number of tumor-resident T-cells and that CD8 clonal enrichment at the tumor site at baseline, notably of PD-1+ cells, was associated with response to PD-1 therapy.3 16 74 Clinical responses to PD-1 therapy were also demonstrated to be associated with the reinvigoration of circulating exhausted CD8 T-cells,17 and there is evidence that PD-1 blockade induces systemic changes crucial for efficacy including in draining-lymph nodes and/or tertiary lymphoid structures.55 75–77 Of note, CXCR5+PD-1high Tfc and PD-1high CXCL13+CD8+ T cells were shown to migrate to OLS and TLS following PD-1 blockade suggesting an active role in the recruitment of immune cells to the tumor.15 26 27 These findings are consistent with the peripheral recirculation of tumor-specific T cells activated in the lymphoid organs following PD-1 blockade and reaching the tumor site where they exert antitumor functions. Although the exact contribution of T-cell reinvigoration and T-cell priming in OLS and TLS following anti-PD-1 therapy to the antitumor efficacy in patients with cancer is still to be documented, a recent study showed that pre-existing T-cell clones in the tumor may have limited reinvigoration capacities and documented the clonal replacement of tumor-infiltrating T cells with clonotypes previously undetectable at the tumor site and emerging from the periphery in response to PD-1 blockade.62 Importantly, these new clonotypes could be identified in the periphery, highlighting the feasibility of monitoring antitumor T cell clonotypes in the blood. Indeed, recent findings demonstrated T cell clonotypic expansion at the periphery and its association with clinical response to immune checkpoint blockade.78–80
Globally, the frequency of the DPOS subset only slightly increased on PD-1 blockade, favoring the hypothesis of the priming of new highly reactive clonotypes on PD-1 therapy, replacing exhausted clonotypes. The higher frequencies of DPOS T cells at baseline in responding patients (significant in the MCC) is probably the reflection of an immunogenic and inflammatory tumor microenvironment, leading to the activation of both nearly exhausted T cells (CD39+, TOX+) and Tfc-like T cells (CXCR5+, CXCL13+, PD-1high), whose function is impaired by PD-1 expression. PD-1 therapy probably results in the contraction of exhausted clonotypes, and in the activation of new highly reactive clonotypes, strongly expressing PD-1 and TIGIT, probably primed in OLS and TLS, and reactive against tumor cells, replacing exhausted clonotypes.63
In support of this hypothesis, the DPOS subset, has a clonally enriched TCR repertoire that is largely private and is enriched for tumor-reactive T cells in comparison to DNEG, TIGIT and even PD-1 populations. The total number of responses detected, their magnitude and the diversity of recognized antigens were also increased in DPOS T cells after 1 month of PD-1 therapy. Furthermore, the increased frequency and absolute number of TRBC clonotypes emerging on PD-1 blockade within the DPOS repertoire were correlated to clinical benefit at month 1. Our findings provide a compelling rationale to measure PD-1+TIGIT+ CD8 T-cell subset in the blood of cancer patients to monitor early anti-PD1 mediated clinical efficacy, and to use DPOS T cells as a window to study the dynamic changes that underlie successful antitumor immunity. Indeed, although the value of this potential immune marker has yet to be confirmed in larger cohorts and in other indications, such a systemic marker should certainly be explored in patients treated with ICI. Although many intratumor markers have been proposed, none of them individually seems ideal to predict therapeutic efficacy, be it tumor mutational load, potential neoepitopes, PD-L1 expression or even T cell infiltration. It is more and more accepted that the dynamics of these markers during treatment would provide more relevant information. As such, systemic markers, such as the reported frequency of this DPOS sub-population, combine the advantage of the operational simplicity of such monitoring and the ability to reflect changes in patients during treatment.
Conclusion
This study demonstrates that the frequency of circulating PD-1+TIGIT+ CD8 T cells, early after treatment initiation, predicts anti-PD-1 therapy efficacy is melanoma and MCC patients. The predictive value of this T-cell subset could be further explored in other solid tumors and in adjuvant immunotherapy approaches.
References
Supplementary materials
Supplementary Data
This web only file has been produced by the BMJ Publishing Group from an electronic file supplied by the author(s) and has not been edited for content.
Footnotes
Contributors SS and NL conceived the research, developed the methods, performed the experiments, interpreted the data, wrote the manuscript and acquired funding to perform research. VV conducted bioinformatic analysis, produced metadata, interpreted the data, prepared figures and edited the manuscript. VV performed experiments and reviewed the manuscript. ZW performed RNA/TCR sequencing. CD administered access to clinical samples. NJ performed experiments. TB performed experiments. AK administered access to patient samples, reviewed patient’s clinical responses and reviewed the manuscript. CB performed ELISPOT experiments. RG administered access to facilities. OA provided access to patient samples and reviewed patient‘s clinical responses. CL administered access to clinical samples. FA administered access to clinical samples. CN administered access to clinical samples. SR provided Qiagen kits, RNAseq/TCRseq sequencing, administered access to sequencing facilities, edited and reviewed the manuscript. RG provided financial resources, analyzed data and reviewed the manuscript. NR administered access to clinical samples and edited the manuscript. MC administered access to clinical samples. SPF administered access to clinical samples. CDC administered access to clinical samples and edited the manuscript. PN provided access to patient samples, provided critical reading of the methodology and edited the manuscript. BD provided access to patient samples, reviewed patient’s clinical responses and reviewed the manuscript. SRR provided financial resources, reviewed and edited the manuscript. NL supervised the study and administered the project.
Funding This work was supported by the LabEX IGO program funded by the National Research Agency via the investment of the future program ANR-11-LABX-0016-01. SS was supported by a specific allocation from the LabEx IGO program. This work was also supported by grants from the « Region Pays de Loire», the BMS foundation, the 'Ligue GO contre le Cancer' and the SIRIC ILIAD programme (INCA-DGOS-Inserm_12558).
Competing interests SRR has served as an advisor and has patents licensed to Juno Therapeutics, a Celgene/Bristol-Myers Squibb company; is a founder and employee of Lyell Immunopharma; and has served on advisory boards for Adaptive Biotechnologies and Nohla. PN serves as a paid consultant for EMD Serono. Bristol Myers Squibb has provided research support to PN’s institution. RG has received consulting income from Juno Therapeutics, Takeda, Infotech Soft, Celgene, has received research support from Janssen Pharmaceuticals and Juno Therapeutics, and declares ownership in Cellspace Biosciences. SR and ZW are employed by QIAGEN, however, the studies were conducted in the absence of any potential conflict of interest. The remaining authors declare that the research was conducted in the absence of any commercial or financial relationships that could be construed as a potential conflict of interest.
Patient consent for publication Not required.
Ethics approval All patients were enrolled after the signature of an informed consent in accordance with French laws and after approval by the local and national ethic committees.
Provenance and peer review Not commissioned; externally peer reviewed.
Data availability statement Data are available in a public, open access repository. Data are available on reasonable request. RNA-seq and TCR-seq data were submitted to the National Center for or Biotechnology Information Gene Expression Omnibus (NCBI GEO): GEO accession number GSE141121. R code to reproduce the analyses is available on GitHub [https://valentinvoillet.github.io/Simon_et_al_2020/].
Supplemental material This content has been supplied by the author(s). It has not been vetted by BMJ Publishing Group Limited (BMJ) and may not have been peer-reviewed. Any opinions or recommendations discussed are solely those of the author(s) and are not endorsed by BMJ. BMJ disclaims all liability and responsibility arising from any reliance placed on the content. Where the content includes any translated material, BMJ does not warrant the accuracy and reliability of the translations (including but not limited to local regulations, clinical guidelines, terminology, drug names and drug dosages), and is not responsible for any error and/or omissions arising from translation and adaptation or otherwise.