Article Text

Abstract
Purpose Hyperprogression is an atypical response pattern to immune checkpoint inhibition that has been described within non-small cell lung cancer (NSCLC). The paradoxical acceleration of tumor growth after immunotherapy has been associated with significantly shortened survival, and currently, there are no clinically validated biomarkers to identify patients at risk of hyperprogression.
Experimental design A total of 109 patients with advanced NSCLC who underwent monotherapy with Programmed cell death protein-1 (PD1)/Programmed death-ligand-1 (PD-L1) inhibitors were included in the study. Using RECIST measurements, we divided the patients into responders (n=50) (complete/partial response or stable disease) and non-responders (n=59) (progressive disease). Tumor growth kinetics were used to further identify hyperprogressors (HPs, n=19) among non-responders. Patients were randomized into a training set (D1=30) and a test set (D2=79) with the essential caveat that HPs were evenly distributed among the two sets. A total of 198 radiomic textural patterns from within and around the target nodules and features relating to tortuosity of the nodule associated vasculature were extracted from the pretreatment CT scans.
Results The random forest classifier using the top features associated with hyperprogression was able to distinguish between HP and other radiographical response patterns with an area under receiver operating curve of 0.85±0.06 in the training set (D1=30) and 0.96 in the validation set (D2=79). These features included one peritumoral texture feature from 5 to 10 mm outside the tumor and two nodule vessel-related tortuosity features. Kaplan-Meier survival curves showed a clear stratification between classifier predicted HPs versus non-HPs for overall survival (D2: HR=2.66, 95% CI 1.27 to 5.55; p=0.009).
Conclusions Our study suggests that image-based radiomics markers extracted from baseline CTs of advanced NSCLC treated with PD-1/PD-L1 inhibitors may help identify patients at risk of hyperprogressions.
- immunotherapy
- biostatistics
- biomarkers
- tumor
- computational biology
- tumor biomarkers
This is an open access article distributed in accordance with the Creative Commons Attribution Non Commercial (CC BY-NC 4.0) license, which permits others to distribute, remix, adapt, build upon this work non-commercially, and license their derivative works on different terms, provided the original work is properly cited, appropriate credit is given, any changes made indicated, and the use is non-commercial. See http://creativecommons.org/licenses/by-nc/4.0/.
Statistics from Altmetric.com
Introduction
The addition of immune checkpoint inhibitors (ICIs) to the armamentarium of cancer therapies has resulted in unprecedented improvement in survival outcomes for a wide range of malignancies, including non-small cell lung cancer (NSCLC). With the approval of ICIs for clinical use in these malignancies, a phenomenon of paradoxical acceleration of disease progression after initiation of immunotherapy has been recently described by a few groups.1–4 This phenomenon was labeled ‘hyperprogressive disease’ with the reported incidence varying from 8.0% to 25.7%, depending on tumor histology and criteria used to identify hyperprogressors (HPs).2 4–6
The biological and clinical factors that contribute to the development of hyperprogressive disease with ICIs are yet to be understood. Evidence from studies published to date have shown associations between hyperprogression and advanced age,6 7 a higher number of metastatic sites at baseline4 and specific genetic alterations, such as murine double minute-2 (MDM2) amplification or epidermal growth factor receptor (EGFR) mutations.2 However, these observations have not been consistently noted in all the studies, and some of them have reported unexpected rapid disease progressions.8 There is, therefore, a pressing need to identify biomarkers that could identify and help stratify this unique group of patients in whom ICI therapy not only may lack efficacy but also could lead to rapid disease progression and worse clinical outcomes.
CT images of tumors contain a vast amount of valuable information in the form of subtle variations in shape, intensity, gradient, and texture beyond the semantic features that are routinely used by radiologists to describe radiographical appearances of tumors.9 10 Radiomics11 involves the use of computer vision and machine learning methods to quantitatively interrogate the subtle subvisual characteristics of radiographical images in a high-throughput manner in order to answer relevant clinical questions. Radiomic features have shown prognostic and predicting response to multiple different treatments across a wide variety of cancers, including lung,12–17 breast,18–21 21 brain,22–26 prostate27 28 and colorectal29 cancers. Specifically, in lung cancer,9 radiomics approaches have been used to predict the benefit of adjuvant chemotherapy, prognosticate disease risk in early-stage lung cancer,30 predict treatment response to concurrent chemoradiation in locally advanced disease15 and to predict response to immune checkpoint inhibition in advanced NSCLC.31 32
These features are sought to capture the extent of heterogeneity and other biologically relevant features, such as interaction with stromal or vascular components within the given region of interest. Our group and several others have examined the region beyond the tumor boundaries for this approach and interrogated the peritumoral or space immediately adjacent to the tumor. In our recently published work, we have shown that these peritumoral radiomic textural patterns can determine the response to ICI in patients with late-stage NSCLC.31
Another important hallmark of more aggressive cancers is the extent of neovascularization and angiogenesis present in the tumor microenvironment (TME). Our groups have looked at quantifying this vessel tortuosity as a radiomic feature—quantitative vessel tortuosity (QVT) on the CT scan as a way of representing the curvedness of the blood vessels feeding the tumor. We have previously shown that QVT features could be used to distinguish malignant adenocarcinomas with more tortuous vasculature versus benign granulomas from non-contrast chest CT scans.33 A marked decrease in QVT in patients with advanced NSCLC treated with ICI has been associated with response to therapy.34
In this study, we sought to evaluate the ability of radiomic features pertaining to intratumoral and peritumoral textural patterns and tortuosity of tumor-associated vasculature to further characterize the response patterns seen in patients with NSCLC treated with ICI. In this work, we hypothesize that hyperprogressive disease would have a unique radiomics pattern associated with it when compared with other response patterns, such as responders (stable disease (SD), partial response (PR), complete response (CR)) and non-responders (progressive disease (PD)) as determined by RECIST V.1.1.33 We studied the performance of each feature family (intratumoral, peritumoral texture, and vessel tortuosity) within unsupervised as well as within the unified supervised classification model in predicting HPs from other response patterns. We developed our radiomic model on a training set and validated our findings on a validation set in a blinded manner. Additionally, we also performed a survival analysis based on our radiomic model using the log-rank test to stratify predicted HP patients based on overall survival (OS).
Materials and methods
Study design and subjects
In this study, we retrospectively reviewed electronic medical records of 524 consecutive patients with NSCLC who received monotherapy with either a PD1 or PD-L1 inhibitor between January 1, 2015, to April 30, 2018, at Cleveland Clinic. Data pertaining to demographics, smoking history, histology, and molecular testing, number of prior lines of therapy, performance status per the Eastern Cooperative Oncology Group (ECOG) scale, response to ICI on first radiographical assessment, follow-up, and vital status were extracted from electronic medical records. We identified patients who received ≤3 cycles of therapy and also noted the reason for discontinuation of treatment.
Identifying HPs, responders and non-responders
All CT scans were independently reviewed by two clinicians (PDP and PJ) and a senior radiologist (AG). To be eligible, patients had to have CT images available at a minimum of three time points at least 2 weeks apart—a baseline CT scan immediately before starting immunotherapy, a prebaseline CT scan at diagnosis, and the first post-treatment scan after initiating the ICI. Patients without measurable disease per RECIST V.1.1 or lung lesions on baseline pretherapy scans were excluded from the analysis. RECIST V.1.1 criteria were used to calculate the sum of the largest diameters of the target lesions on each of the CT scans. New lesions on treatment were excluded from calculations.
Response assessment on all patients was performed as per RECIST V.1.1 criteria. Specifically, two target lesions per organ to a maximum of five lesions were identified and measured by a thoracic radiologist (10 years of experience), on prebaseline, baseline, and post-ICI therapy scans for every patient. The four RECIST categories were defined using the target lesions observed on three consecutive CT scans. The sum of diameters of the target lesions (longest for non-nodal lesions and the short axis for the nodal region) were compared for prebaseline, baseline, and post-ICI therapy scans. The four categories were defined as CR, that is, the disappearance of all the lesions, PR, that is, ≥30% decrease in the sum of the longest diameters of target lesions compared with baseline; PD, that is, ≥20% increase in the sum of the longest diameter of target lesions; and SD, that is, neither PR or PD.35 For the present study, the responders to ICI therapy were identified as those patients with CR, PR, and SD, and non-responders were patients with PD. To determine hyperprogressive disease, tumor-growth kinetics, which measures the change in tumor size per unit time, were calculated for all the PD lesions using the previously defined methodology.35 The details regarding the calculations of tumor growth kinetics are described in online supplemental appendix 1. TGKpre was defined as the change in tumor size per unit of time (months) between the baseline and prebaseline scans.
Supplemental material
Meanwhile, TGKpost was defined as the change in tumor size per unit time (months) between the baseline and post-ICI therapy scans. HPs were defined when TGKpost was twice of TGKpre. The details about three class selections are described in the flowchart and online supplemental appendix 1 (pp3).
Nodule identification and annotation of vasculature and peritumoral region
All the target lesions used for response assessment were manually segmented and annotated on all the slices of axial CT for the baseline CT scan. The previous published work shows that manual segmentations are still considered the gold standard for radiomics studies. We did not want to confound the radiomic analysis with possible errors on account of the automated segmentation; hence, manual segmentation was preferred over automatic segmentation analysis. The radiologists used 3D Slicer software and a manual hand tool (3D Slicer V.4.6) for the annotations. All the annotated lesions were further used for radiomic intratumoral analysis, that is, features extracted from inside the nodule.
Following annotations, the peritumoral mask was defined using morphological dilation and erosion operations (online supplemental appendix 1, pp1,2). Annular rings of 5 mm width up until a radial distance of 0–15 mm outside the nodule were identified for extracting peritumoral features. Further, 3D vasculature surrounding the nodule was segmented. A fast-marching algorithm was employed to identify the center lines of the 3D segmented vasculature for extracting QVT features.
Radiomic feature extractions
Radiomic features were extracted using software developed at the Center of Computational Imaging and Personalized Diagnostics, Case Western Reserve University (Cleveland, Ohio, USA), implemented on a MATLAB release V.2015 platform.
Textural radiomic features from Gabor, Haralick, Laws, Laplace, and Collage feature families were extracted from each annotated intratumoral and peritumoral region. To ensure the stability and reproducibility of radiomic features, we used the test–retest Reference Image Database to Evaluate Response lung CT dataset (online supplemental appendix 1, pp2).
A set of 74 QVT features were extracted from the segmented vasculature surrounding the nodule. These features pertain to the tortuosity, curvature, and branching statistics as well as the volume of the vasculature. In addition, we measured the angles of each three consecutive points of the vasculature and computed the distribution of these angles33 (online supplemental appendix 1, pp1).
Feature evaluation and classifier construction
First, to evaluate and analyze the structure of an entire dataset, unsupervised clustering was performed on the radiomics feature pool using heatmaps and K-mean clustering. External validation of the clustering analysis was performed by comparing the clustering results against ground truth to identify high-risk patient cohort within the dataset without prior knowledge of biology or outcome.
Second, the supervised experiment was performed by considering the primary endpoint of the study to differentiate HPs from the other response patterns. A radiomics model was developed using the training cohort. For the purposes of feature and classifier selection, 300 iterations of threefold cross-validation were used within the training dataset. The minimum redundancy maximum relevance feature selection algorithm was implemented within the cross-validation setting to select the top-performing radiomic features. Top features were analyzed with box and whisker plots, Wilcoxon rank-sum tests, p values,as well as feature maps.
The five machine learning classifiers implemented within the training set included Random Forest (RF), linear discriminant analysis, diagonal linear discriminant analysis, quadratic discriminant analysis, and support vector machine. The best performing classifier modeled on the training set was then validated on an independent and blinded validation set.
Statistical analysis
The statistical analysis was performed using MATLAB V.2015 and R V.3.5.3. A two-sided p value of <0.05 was considered significant for all the statistical analyses. Differences in distributions between the patient dataset and variables were assessed with the unpaired, two-tailed χ2 test, or the Fisher exact test as appropriate.
The selected top features were analyzed using box and whiskers plots, along with the Wilcoxon rank-sum tests. Next, the feature maps of the top features were compared against three classes. To validate the classifier performance, the area under the receiver operating curve (AUC), accuracy, sensitivity (true positive rate; ie, predicting HPs accurately from the rest), and specificity (true negative rate; ie, predicting other classes accurately) were calculated for training as well as validation datasets.
Further, the patients were stratified into two groups based on the labels/output predicted by the locked-down machine learning classifier. The OS was compared against the two predicted groups. The OS was defined as the time between the initiation of ICI to the death of the patient. The patients were censored if the date of death was unknown. The Kaplan-Meier (KM) survival curves were plotted for two groups using OS. The survival analysis was performed using log-rank tests and HRs with corresponding CIs.
The survival analysis and classification were further performed within individual groups of response patterns (responders, non-responders, and HPs). The classifier performance was compared for differentiating HPs from responders, HPs from other non-responders and responders from non-responders. The three models were compared with classifier AUC as well as HRs and KM curves.
The overall work pipeline is explained in figure 1.
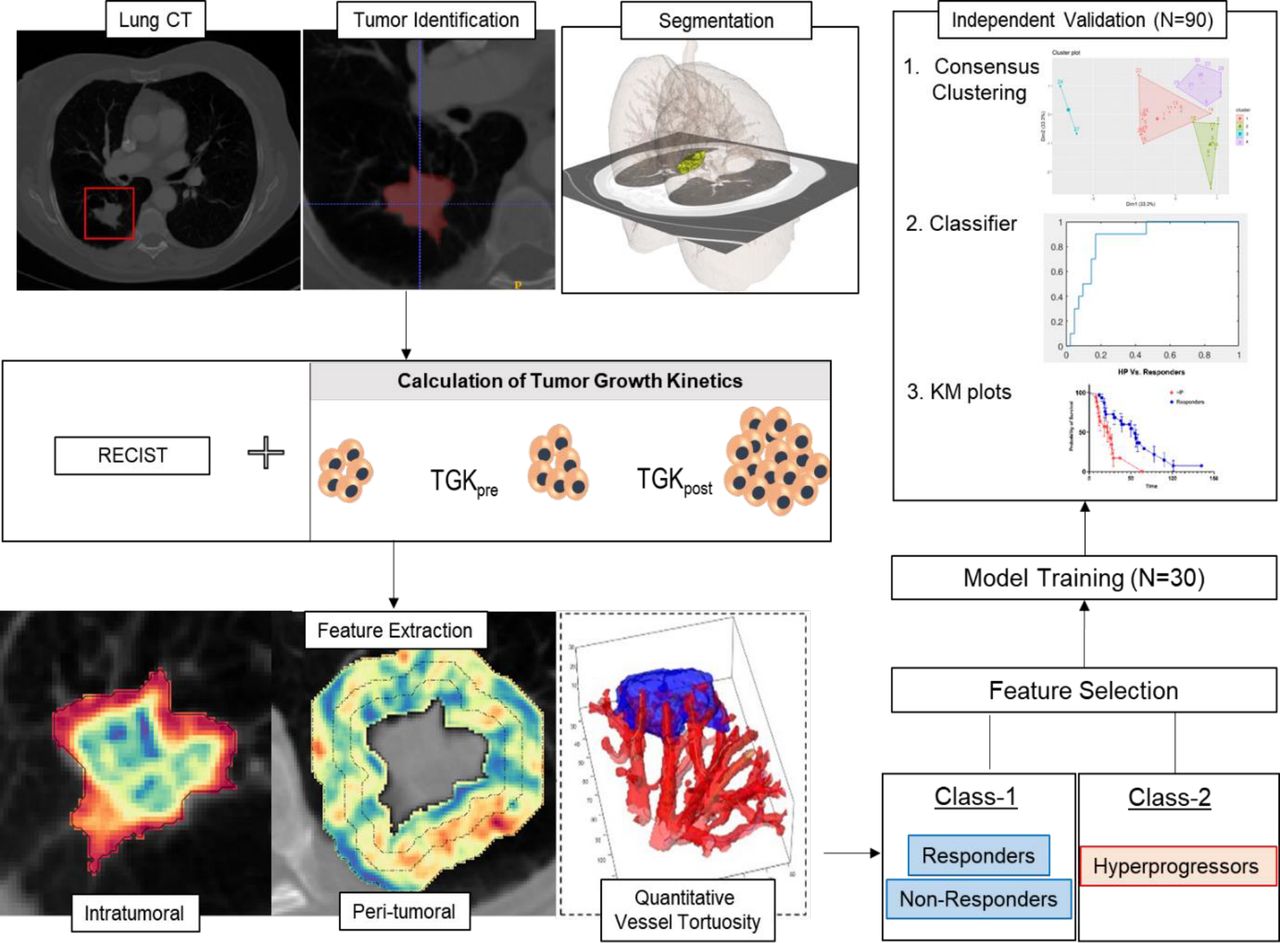
Overall workflow and pipeline of the project. The first step involves identifying and annotating lung nodules on prebaseline, baseline, and post-ICI therapy scans. The next step involves calculating TGKs and defining responders, non-responders, and hyperprogressors. After defining the three groups, intratumoral and peritumoral textural features are extracted using MATLAB V.2015a. For the peritumoral region, features were extracted from 0 to 15 mm region outside the tumor and divided into three 5 mm peritumoral rings. Feature statistics included mean, median, SD, skewness, kurtosis, and range and were calculated for each of the individual annular rings. The whole dataset was divided into training and validation sets. Top features were selected using the minimum redundancy maximum relevance feature selection algorithm using the training dataset. A classifier was trained using the training cohort, and the performance was validated using the validation set using clustering, classifiers, and KM plots. ICI, immune checkpoint inhibitor; KM, Kaplan-Meier; TGK, tumor growth kinetic; TGKpre, change in tumor size per unit time (months) between the baseline and pre-baseline scans; TGKpost, change in tumor size per unit time (months) between the baseline and post-ICI therapy scans.
Results
Patient cohort
A total of 524 patients with advanced NSCLC who received ICIs were analyzed in the study, out of which 315 received ≤3 cycles of an ICI. The patients who either did not have CT images available for analysis, or no available OS or had an unmeasurable disease or had no target lung lesions on baseline scans or poor image quality as determined by a radiologist were excluded from the analysis. The study included the remaining 109 patients after excluding these cases. After implementing RESIST V.1.1 criteria and tumor growth kinetics, a total of 19 HPs were identified. For the cohort with other response patterns (CR, PR, SD, and PD), we identified n=90 based on their first imaging assessment (usually post two cycles) after immune checkpoint blockade (figure 2).

CT scans: (A) responders, (B) non-responders and (C) hyperprogressors. The first row shows baseline CT scans and the second row represents CT scans for the same patient after two cycles of immunotherapy.
The clinical characteristics are listed in table 1. The distribution of patients in the training and testing sets is listed in online supplemental appendix 1 (pp1).
Clinical characteristics of the dataset
Experiment 1: analyzing radiomic features
Unsupervised clustering analysis on the feature set
First, the patterns of radiomic features were analyzed using clustering-based heatmap analysis. The approach involves plotting out the individual feature values for each patient within a matrix and performing unsupervised clustering. Heatmap analysis on intratumoral and peritumoral textural patterns resulted in 78.9% of HPs being colocated within cluster 1. Similarly, heatmap analysis with QVT features revealed the HPs aggregating together (figure 3A).

Unsupervised clustering analysis: (A) heatmaps for (i) radiomics intratumoral and peritumoral features where 78.9% HPs clustered together in cluster 1, (ii) quantitative vessel tortuosity features. (B) K-mean clustering analysis: (i) elbow curve representing an optimum number of clusters formed using the top three principal components after performing principal component analysis on the entire feature cohort. The optimum number of clusters were observed to be four. (ii) clusters after performing clustering using k=4. These clusters had 78.1% compactness within the clusters. Almost all the HP (80%) were clustered in clusters 3 and 4. Responders and non-responders formed clusters 2 and 1. HP, hyperprogressor.
Next, the entire feature pool, that is, the combination of intratumoral textural, peritumoral textural, and QVT radiomics were used with principal component analysis and k-means clustering to identify four clusters. The compactness within the clusters, that is, how similar are the members within the same group, was observed to be 78.1%. The validation of the constructed cluster was performed using heatmaps and silhouette coefficient (silhouette width). The silhouette plot36 suggests that the clustering using the four groups was optimal with no negative silhouette width and most cluster values of >0.5 (online supplemental appendix 1, pp4).
Within the constructed clusters, 80% of combined cluster 3 and cluster 4 comprised 80% of HPs. The remaining 20% HPs were part of cluster 1, making up 15.38% of cluster 1. Twenty percent of responders were clustered together with HPs in cluster 4. The remaining two clusters (clusters 1 and 2) comprised primarily of the responders and non-responders (figure 3B). Specifically, cluster 2 did not have a single HP within it. The detailed results showed that 53.85% cluster 1 and 42.85% cluster 2 contained non-responders, whereas 30.76% cluster 1 and 57.14% cluster 2 had responders. The unsupervised clustering analysis suggests that high-risk HPs were all clustered together, potentially suggesting that these specific patient groups had a distinct radiomic signature when compared against responders and non-responders.
Experiment 2: supervised classifier for distinguishing HPs from other response patterns
Supervised analysis for selecting the top features
The top three features during feature discovery within the training cohort included one peritumoral texture and two QVT features. The peritumoral feature observed was from the Gabor feature family from a 5–10 mm peritumoral region. The other two features were observed from the QVT feature family explaining local curvature and tortuosity of the vessels surrounding the nodule (online supplemental appendix 1, pp4). Hyperprogressive patients were observed to have high feature expressions as compared with responders and non-responders (figure 4).
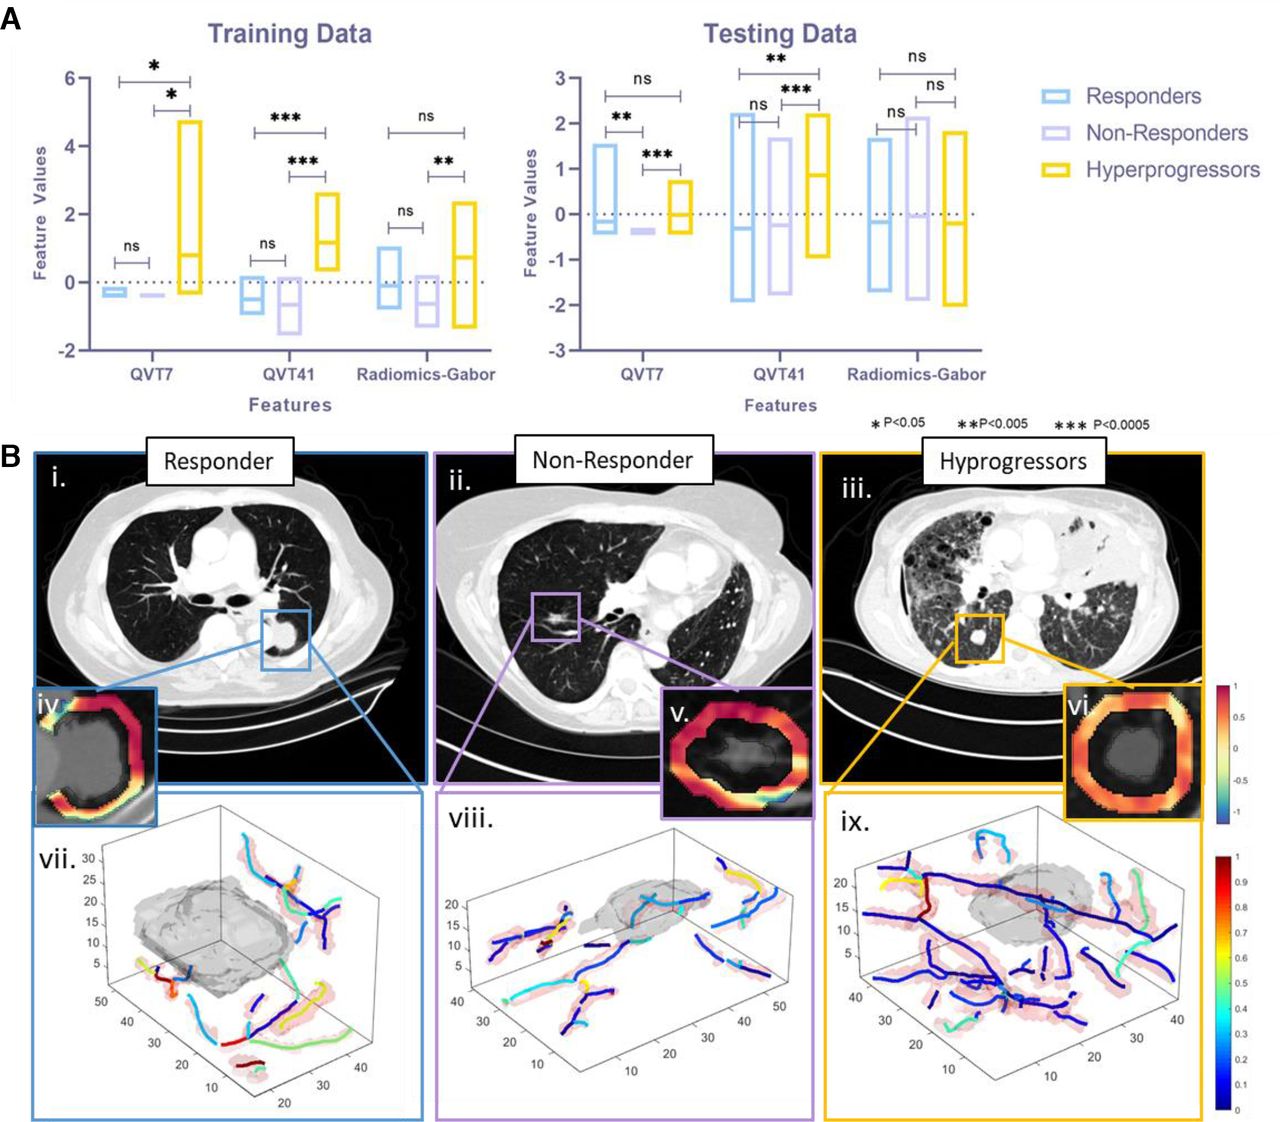
Top feature analysis: (A) The box plots for the top three selected features for (i) training cohort and (ii) validation cohort. HPs had statistically significant high-feature values when compared against both responders and non-responders in both pieces of training as well as validation sets. (B) Top feature expression maps with corresponding CT scans for (i) responders, (ii) non-responders and (iii) HPs.Corresponding peritumoral Gabor feature maps are represented in (iv) responders, (v) non-responders and (vi) HPs. similarly, corresponding vessel tortuosity expressions and expressed for (vii) responders, (viii) non-responders and (ix) HPs. HPs were observed to have more convoluted vessel maps. Similarly, radiomic Haralick texture maps represented chaotic peritumoral microarchitecture of HPs. HP, hyperprogressor; (ns, not significant * = p<0.05, ** = p<0.005, *** = p<0.0005).
The selected top features were further compared against clinical variables and tumor volume using Pearson’s correlation coefficients. (online supplemental appendix 1, pp4 5). The maximum correlation was observed within the Radiomics Gabor feature and tumor volume (rho=0.588).
Supervised classifier performance
Optimal classifier performance with the highest specificity within the training set D1 was achieved using the RF classifier with 50 trees. On the training cohort (D1, n=30), 300 iterations of threefold cross-validation yielded an average AUC of 0.85±0.06 and an accuracy of 0.86±0.06 for predicting HPs from the other response patterns. The sensitivity, that is, identifying HPs, was observed to be 0.78±0.11, whereas specificity was observed to be 0.91±0.10. The performance of all the five classifiers, along with the feature selection method, is listed in online supplemental appendix 1 pp4.
The same classifier was further used for the independent validation set. Within an independent blinded test set, (D2, n=79), the same RF classifier yielded an AUC of 0.96. The accuracy of the classifier was 0.83, whereas the sensitivity and specificity were 1.0 and 0.81, respectively. The F1 score was observed to be 0.58. In the testing set, all the HPs were identified correctly. Among the remaining cases, eight responders and six non-responders were mistakenly classified as HPs. The confusion matrix is reported in online supplemental appendix 1, pp4.
Within D2, a subset analysis for differentiating responders against HPs, AUC was observed to be 0.96, and sensitivity and specificity were 1 and 0.91, respectively. The accuracy was observed to be 0.86. For differentiating non-responders against HPs, AUC, accuracy, sensitivity, and specificity were 0.97, 1, 0.86 and 0.89, respectively.
The specific selected top feature set, along with the RF classifier, could not differentiate responders and non-responders within the validation set D2 (AUC 0.43).
Experiment 3: predicted radiomic response groups can also stratify patients with NSCLC treated with ICI based on OS
On D2, the two predicted groups by the radiomic model, RF classifier, had a statistically significant difference for predicting OS (HR=2.66, 95% CI 1.27 to 5.55, p=0.009). The predicted HPs had significantly lower OS compared with those patients identified as non-HPs by the RF classifier. The mean survival time for predicted HPs was 20 months, whereas the predicted survival meantime for non-HPs was 38 months.
Within the subset analysis of D2, radiomic analysis on predicted HPs had an HR for OS of 3.86 (95% CI 1.52 to 9.86, p=0.0046) when compared with responders alone, whereas predicted HPs had an HR of 5.93 (95% CI 2.25 to 15.64, p<0.0001) with respect to non-responders (figure 5). These results suggest that predicted hyperprogressors had statistically significant worse OS when compared against either responders or even non-responders.

Kaplan-Meier survival curves for OS according to predicted labels by random forest classifiers: OS for the test set D2 consisting of patients who were (A) combined responders, non-responders, and HPs. Within predicted two groups, predicted HPs had significantly shorter OS compared with predicted non-HP (B) subset of D2 consisting only HPs and non-responders and (C) subset of D2 consisting HPs and responders. HP, hyperprogressor; OS, overall survival.
Meanwhile, a comparison between predicted responders and non-responders based on selected top three radiomic features did result in a statistically significant difference between the two groups (HR=1.29, 95% CI 0.49 to 3.35, p=0.59).
Discussion
The introduction of ICIs has led to a paradigm shift in the management of a vast range of malignancies, including NSCLC. However, ICIs have been associated with atypical response patterns such as hyperprogression, a novel pattern of disease acceleration after the use of PD1/PD-L1 inhibitors,1 2 which has been reported across different tumor types such as melanoma, head, and neck squamous cell cancer, NSCLC, and urothelial carcinoma, to name a few. It has been postulated that this paradoxical acceleration of disease with ICI may, in fact, be responsible for the higher progression rates and mortality noted early on in patients undergoing immunotherapy in comparison to the chemotherapy, as shown in the phase III trials such as CheckMate 057 that led to the approval of these agents.37 Due to the lack of a standard definition and different criteria used to define hyperprogression, the reported incidence varies significantly among these studies. For patients with NSCLC, the previously reported incidence ranges between 8% and as high as 25.7%.2 4
In our study of patients with advanced NSCLC treated with a PD1 or PD-L1 inhibitor, we observed hyperprogression in 19 patients. Since most patients receiving ICIs at our institution have a response assessment with imaging performed within 9 weeks or three cycles of therapy, we used this time point as a cut-off for our definition of hyperprogression. Although this varies slightly from previous studies that have used a 2-month or 8-week cut-off, we believe that using the 9-week limit allowed us to capture the true incidence of hyperprogression in our cohort.
The biology of hyperprogressive disease is yet to be understood. In a previous study by Kato et. al,2 the authors noted an association with certain genetic alterations such as EGFR mutations and MDM2 amplification.2 In our study, a majority of the patients did not have any genetic alterations detected on our in-house lung hotspot panel of actionable mutations in NSCLC. Although nine patients did have EGFR sensitizing mutations, we did not observe any significant correlation with hyperprogression. The association of certain clinical variables with hyperprogression such as age,1 the number of distant metastatic sites38 has not been consistently confirmed across different studies. There is, therefore, an unmet need for biomarkers that could potentially identify patients at risk of worse clinical outcomes with therapy.
Imaging-based response assessment in patients receiving immunotherapy is fraught with challenges due to the inability of traditional criteria (RECIST) to account for atypical responses observed with these agents. In some of our previously published work,31 we have identified novel imaging-based radiomic biomarkers to assess responses to ICIs in patients with advanced NSCLC. The foundation of radiomics is that CT images contain a vast amount of information in the form of subtle variations in shape, intensity, gradient, and texture beyond the semantic features that are routinely used by radiologists to describe radiographic appearances of tumors. In the aforementioned studies, we are also tried to understand the morphological/pathological correlates of the predictive radiomic features that correspond to responses to immunotherapy. In doing so, we have identified certain radiomic features that correlate with tumor-infiltrating lymphocyte density on digitalized histopathology specimens from patients treated with ICIs.1 4 7
While the biological underpinnings of hyperprogression are yet to be uncovered, many of the current theories postulate that dysregulation of various immunoregulatory cells in the tumor microenvironment may be responsible for this phenomenon. One hypothesis that has been put forth is that of ‘contrasuppression’ or activation and proliferation of regulatory T cells in the presence of ICIs.38 Other theories suggest that an imbalance in the cytokine milieu and resultant immunosuppression may play a role in paradoxical disease progression with ICIs.15 16 Lo Russo et al 6 demonstrated the role of tumor-associated macrophage enrichment in immunodeficient mice injected with patient-derived xenografts belonging to patients with NSCLC with hyperprogression after PD1/PD-L1 blockade.
In this study, we evaluated the performance of a new radiomic model using the integration of intratumoral and novel peritumoral texture and vessel tortuosity metrics (QVT) in predicting hyperprogressive disease using only pretreatment CT scans. Our approach is novel being the first Radiomics study that included intratumoral, peritumoral textural patterns along with vessel tortuosity features to predict specific patterns associated with hyperprogressive disease.39 Our results suggest that these peritumoral texture and vasculature patterns are significantly different in HPs when compared with either responders or other non-responders.
The peritumoral area is an integral part of the TME. Recent work has suggested that TME embeds information that relates to drug resistance, and the effectiveness of chemotherapy and immunotherapy.14 17 18 40 Previous investigations of radiomic features from the TME have shown their utility in differentiating lung adenocarcinomas from granulomas, predicting response to neoadjuvant chemoradiation and surgery, pemetrexed chemotherapy in locally advanced NSCLC.14 17 18 Sun et al 40 have used a radiomic approach on tumor region and the area surrounding it to detect CD8 cells and used that signature to predict ICI response in multiple retrospective cohorts. For predicting hyperprogressive disease, our results are in line with the recent study by Tunali et al,39 where top radiomic features reported in the study were also observed from the tumor boundary.38 Our top radiomic features were also observed from peritumoral regions and represent peritumoral heterogeneity within the textural patterns. These features had higher expression in the baseline CT scans of HPs when compared with responders or non-responders. One of the unique strengths of our study was that in addition to textural feature analysis, we also used a novel approach to quantify the blood vessel morphology (QVT) in the peritumoral area. These QVT features were two of the top three distinguishing radiomic features, emphasizing the importance of peritumoral vasculature in the phenomenon of hyperprogression. QVT features showed more tortuous and disordered vessel architecture for HPs compared with responders or non-responders. We also evaluated the prognostic ability of the radiomic features by performing a survival and classification analysis within the three response categories: responders, non-responders, and HPs. The radiomics classifier correctly predicted that the HP patients would have worse OS when compared with responders and non-responders.
We acknowledge the limitations of our study, many of which are a consequence of the retrospective nature of this study and a limited number of HPs cases. Since the HP phenomenon is quite rare and observed within less than 8% cases, we were limited in the total number of HP cases in the analysis. Further, ours is a single-institution study, but further validation in independent cohorts of patients is warranted. Since the hyperprogression phenomenon is very rare and observed within less than 8% cases, we were limited in the HP cases. Further, the exclusion of patients without adequate scans for analysis could have affected the incidence of hyperprogression and the performance of our discriminative radiomic signature. While there is no standardized definition of hyperprogression, some previous studies4 5 38 have used volumetric changes to identify hyperprogressive disease. We acknowledge the limitations of using non-volumetric tumor growth kinetics for identifying hyperprogression, but believe that this would be a methodology that clinicians could easily replicate in practice to identify this subset of patients. PD-L1 expression data were unavailable for a majority of patients in our cohort. The correlation between PD-L1 expression, which is a clinically validated biomarker of benefit from PD1/PD-L1 blockade and hyperprogression, poses an interesting question which could not be addressed in our study.
Conclusions
Our findings suggest that radiomic analysis of pretherapy CT scans of patients with NSCLC who are being considered for immune checkpoint blockade could be used to identify patients who are at a higher risk of hyperprogression with this treatment. Added benefits of using radiomic analyses include the ability to analyze readily available routine CT scan images and the non-invasive nature of the risk assessment without the need for additional biopsy specimens.
Further rigorous validation in independent cohorts of patients and radiomic–histopathological correlative analyses would further strengthen the argument for using radiomic analyses in routine clinical practice.
Acknowledgments
Research reported in this publication was supported by the National Cancer Institute of the National Institutes of Health (award numbers 1U24CA199374-01, R01CA202752-01A1, R01CA208236-01A1, R01 CA216579-01A1, R01 CA220581-01A1, and 1U01 CA239055-01), National Center for Research Resources (award number 1 C06RR12463-01). VA Merit Review Award IBX004121A from the United States Department of Veterans Affairs Biomedical Laboratory Research and Development Service, the DOD Prostate Cancer Idea Development Award (W81XWH15-1-0558), the DOD Lung Cancer Investigator-Initiated Translational Research Award (W81XWH-18-1-0440), the DOD Peer Reviewed Cancer Research Program (W81XWH 16-1-0329), the Ohio Third Frontier Technology Validation Fund, the Wallace H. Coulter Foundation Program in the Department of Biomedical Engineering and the Clinical and Translational Science Award Program (CTSA) at Case Western Reserve University. The content is solely the responsibility of the authors and does not necessarily represent the official views of the National Institutes of Health, the US Department of Veterans Affairs, the Department of Defense, or the US government.
References
Supplementary materials
Supplementary Data
This web only file has been produced by the BMJ Publishing Group from an electronic file supplied by the author(s) and has not been edited for content.
Footnotes
Twitter @pranjal31vaidya
PV, KB and PDP contributed equally.
Contributors PV, KB, PDP and AM were involved in the study design. PDP, PJ and VV collected the data. AG, PDP and KB performed the annotations, radiographical evaluation and RECIST and tumor growth kinetic calculations. MA, PV and MK extracted radiographical-based features. PV, KB and AM analyzed and interpreted the data. PV, KB and PDP wrote the initial draft and all authors reviewed, contributed to, and approved the manuscript. All the authors had access to all the data, and AM was responsible for the decision to submit the manuscript.
Funding National Cancer Institute of the US National Institutes of Health, National Center for Research Resources, US Department of Veterans Affairs Biomedical Laboratory Research and Development Service, Department of Defence, National Institute of Diabetes and Digestive and Kidney Diseases, Wallace H Coulter Foundation, Case Western Reserve University, and Dana Foundation.
Competing interests PV, KB, PDP, AG, PJ, MA, and MK disclosed no conflicts of interest. VV's Activities related to the present article: disclosed no relevant relationships. Activities not related to the present article: is a consultant for BMS, Genentech, Astrazeneca, Celgene, Foundation Medicine, Taekeda, Merck, Alkermes, and Nektar Therapeutics; institution has grants or grants pending with Astrazeneca, Merck, BMS, Genentech, and Alkermes; is on the speakers bureaus of Novartis, BMS, Celgene, and Foundation Medicine; has received payment for the development of educational presentations from BMS and Foundation Medicine. Other relationships: disclosed no relevant relationships. AM's activities related to the present article: disclosed no relevant relationships; activities not related to the present article: is on the board of and is a consultant to Inspirata; institution has three NCI RO1 grants with Inspirata and one ongoing U24 with PathCore; Elucid Bioimaging and Inspirata has licensed some of institutions’ patents (both Case Western Reserve University and Rutgers University); receives royalties from Elucid Bioimaging and Inspirata; holds stock equity in Elucid Bioimaging and Inspirata. Other relationships: disclosed no relevant relationships.
Patient consent for publication Not required.
Ethics approval This study was approved by the institutional review board, and informed consent was not required due to the retrospective nature of the study.
Provenance and peer review Not commissioned; externally peer reviewed.
Data availability statement Data are available upon reasonable request. Access to datasets from the Cleveland Clinic Foundation (used with permission for this study) should be requested directly from these institutions via their data access request forms. Subject to the institutional review boards’ ethical approval, unidentified data would be made available as a test subset. However, we are including all the codes used for analyses following feature extraction on GitHub. All experiments and implementation details are described thoroughly in the Materials and methods section and online supplemental appendix 1 so they can be independently replicated with non-proprietary libraries.
Supplemental material This content has been supplied by the author(s). It has not been vetted by BMJ Publishing Group Limited (BMJ) and may not have been peer-reviewed. Any opinions or recommendations discussed are solely those of the author(s) and are not endorsed by BMJ. BMJ disclaims all liability and responsibility arising from any reliance placed on the content. Where the content includes any translated material, BMJ does not warrant the accuracy and reliability of the translations (including but not limited to local regulations, clinical guidelines, terminology, drug names and drug dosages), and is not responsible for any error and/or omissions arising from translation and adaptation or otherwise.