Article Text

Abstract
Background Though currently approved immunotherapies, including chimeric antigen receptor T cells and checkpoint blockade antibodies, have been successfully used to treat hematological and some solid tumor cancers, many solid tumors remain resistant to these modes of treatment. In solid tumors, the development of effective antitumor immune responses is hampered by restricted immune cell infiltration and an immunosuppressive tumor microenvironment (TME). An immunotherapy that infiltrates and persists in the solid TME, while providing local, stable levels of therapeutic to activate or reinvigorate antitumor immunity could overcome these challenges faced by current immunotherapies.
Methods Using lentivirus-driven engineering, we programmed human and murine macrophages to express therapeutic payloads, including Interleukin (IL)-12. In vitro coculture studies were used to evaluate the effect of genetically engineered macrophages (GEMs) secreting IL-12 on T cells and on the GEMs themselves. The effects of IL-12 GEMs on gene expression profiles within the TME and tumor burden were evaluated in syngeneic mouse models of glioblastoma and melanoma and in human tumor slices isolated from patients with advanced gastrointestinal malignancies.
Results Here, we present a cellular immunotherapy platform using lentivirus-driven genetic engineering of human and mouse macrophages to constitutively express proteins, including secreted cytokines and full-length checkpoint antibodies, as well as cytoplasmic and surface proteins that overcomes these barriers. GEMs traffic to, persist in, and express lentiviral payloads in xenograft mouse models of glioblastoma, and express a non-signaling truncated CD19 surface protein for elimination. IL-12-secreting GEMs activated T cells and induced interferon-gamma (IFNγ) in vitro and slowed tumor growth resulting in extended survival in vivo. In a syngeneic glioblastoma model, IFNγ signaling cascades were also observed in mice treated with mouse bone-marrow-derived GEMs secreting murine IL-12. These findings were reproduced in ex vivo tumor slices comprised of intact MEs. In this setting, IL-12 GEMs induced tumor cell death, chemokines and IFNγ-stimulated genes and proteins.
Conclusions Our data demonstrate that GEMs can precisely deliver titratable doses of therapeutic proteins to the TME to improve safety, tissue penetrance, targeted delivery and pharmacokinetics.
- cell engineering
- immunotherapy
- macrophages
- tumor microenvironment
This is an open access article distributed in accordance with the Creative Commons Attribution Non Commercial (CC BY-NC 4.0) license, which permits others to distribute, remix, adapt, build upon this work non-commercially, and license their derivative works on different terms, provided the original work is properly cited, appropriate credit is given, any changes made indicated, and the use is non-commercial. See http://creativecommons.org/licenses/by-nc/4.0/.
Statistics from Altmetric.com
Background
Immunotherapy for the elimination of solid tumors is an emerging field with promising, if sporadic, improved outcomes for patients.1 2 Barriers to realizing the therapeutic potential of many contemporary cancer immunotherapies include a lack of immune cell infiltration3 and an immunosuppressive tumor microenvironment (TME)4 which supports the accumulation of immunosuppressive cells,5 local secretion of anti-inflammatory cytokines, and expression of immune checkpoint proteins. Additionally, the efficacy of T cell therapies, including chimeric antigen receptor (CAR) T cells, is limited by tumor antigen loss and immune cell exhaustion.3 Antigen-independent cell therapies that persist within tumors are therefore ideal candidates to restore endogenous immune cell infiltration and anti-tumor functions.
Interleukin (IL)-12 secretion by macrophages is a seminal event in the initiation of the interferon-gamma (IFNγ) immune-activating cytokine cascade. Initially shown to support Th1 responses6 and CD4+ and CD8+ T cell recruitment,7 8 IL-12’s effects on macrophages and natural killer (NK) cells are also critical for successful anti-tumor immunity.9 10 In preclinical models, IL-12 has consistently been shown to reduce tumor burden and increase survival though early clinical trials revealed IL-12-driven systemic toxicities.11 Recent clinical studies; however, demonstrate that locally-delivered IL-12 is well-tolerated in high-grade glioma12 and metastatic melanoma,13 14 suggesting that methods to deliver IL-12 to the TME could harness the preclinical successes for use in humans.
We previously developed a genetically engineered macrophage (GEM) cellular therapy platform using human peripheral blood precursors modified with lentivirus to express surface, intracellular or secreted proteins.15 Locally injected, GEMs infiltrate tumor tissue, persist without expanding, and express lentiviral payloads for several weeks.15 We hypothesized that GEMs delivering IL-12 within the TME would improve activation of endogenous immune cells and reduce tumor burden. Our data show that IL-12-secreting GEMs maintain protein expression, improve T cell activation, induce local proinflammatory cytokine production and increase tumor cell death.
Methods
Mice
Male NOD.Cg-Prkdcscid Il2rgtm1Wjl /SzJ (NSG)16 and B6(Cg)-Tyr c-2J /J (B6 Albino) mice aged 8–12 weeks old were purchased from Jackson Laboratories. The 3–8 weeks immunocompetent Ntv-a Ink4a-Arf-/- PTENfl/fl mice on FVB/N, C57BL/6, BALB/C and 129 backgrounds were used for the mouse glioma model.17
Cell lines
293T (CRL-3216) and U-87 MG (HTB-14) cell lines were purchased from ATCC and cultured in DMEM (high glucose/no glutamine; Gibco) with 10% fetal bovine serum (FBS; Peak Serum or Hyclone), 10 mM HEPES (Gibco) and 1% GlutaMAX (Gibco). The B16.F10 (CRL-6475) cell line was purchased from ATCC and cultured in DMEM with 10% FBS, 2% GlutaMax and 1 mM sodium pyruvate (Gibco). For lentivirus production, 293Ts were passaged 1:6 every 3–4 days and used prior to passage 20. Enhanced green fluorescent protein (eGFP):ffluc Raji cells were a gift from Michael Jensen (Seattle Children’s Research Institute (SCRI), Seattle, Washington, USA). The mouse GL261 cell line was obtained from the DCTD Tumor Repository, National Cancer Institute at Frederick, Maryland and cultured in DMEM with 10% FBS and 2% GlutaMAX. GL261 conditioned media (GL261 cm) was collected 3 days following a 1:6 split of 90% confluent GL261 cells into RPMI-1640 (with HEPES and l-glutamine; Gibco) with 10% FBS (RP10).
Lentiviral vectors and virus production
Development of the mCherry and eGFP:firefly luciferase (ffluc) fusion constructs are previously described.15 The non-signaling truncated CD19 (CD19t) sequence was a gift from Michael Jensen.18 Lentiviral vectors were created by subcloning individual sequences (CD19t, T2A, murine IL-12 (mIL-12), human IL-12 (hIL-12), ffluc) or fully synthesized constructs (GeneArt; CD19t-T2A-hIL-12, eGFP:ffluc-T2A-hIL-12, anti-cytotoxic T-lymphocyte-associated protein 4 (α-CTLA-4; Ipilimumab)-T2A-CD19t) and antitumor necrosis factor alpha (α-TNF-α; Adalimumab)-T2A-CD19t)) into the epHIV7.2 backbone.15 Antibody sequences were obtained from Drugbank19 (accession numbers DB00051, DB06186), designed as described,20 and codon optimized using IDT’s codon optimization tool. Single-chain mIL-12 and hIL-12 constructs were derived from pUNO1-hIL12(p40p35) and pUNO1-mIL12(p40p35) vectors (Invivogen). Production of lentivirus packaged with Vpx to provide efficient transduction of macrophages and quantification of lentiviral particles (LPs)/mL were performed as described15 with minor modifications: 4 hours prior to transfection, 293Ts were plated at 2×10⁷ cells per 15 cm dish. Media was changed 16 hours after transfection and lentivirus-containing supernatant collected twice in 48 hours. The Fred Hutchinson Cancer Research Center CCEH-Vector Production core was also contracted to produce lentivirus.
Human macrophage/GEM culture
Peripheral blood mononuclear cells (PBMCs) were isolated from Leukocyte Reduction System chambers (Bloodworks Northwest) with a Lymphoprep (Stemcell Technologies) density gradient applied to SepMate-50 tubes (Stemcell Technologies) and cryopreserved in FBS/10% dimethylsulfoxide (DMSO; Sigma). CD14+ monocyte isolation from cryopreserved PBMCs was performed using EasySep Human CD14 Positive Selection Kits (Stemcell Technologies), according to the manufacturer’s instructions. With minor variations in timing, macrophages were generated by culturing CD14+ monocytes in RP10 with 10 ng/mL recombinant human (rh) granulocyte-macrophage colony-stimulating factor (GM-CSF; R&D Systems) for 6 days at 37°C, 5% CO2, refreshing cytokine on day 3. Macrophages were detached using 0.25% Trypsin-EDTA (Gibco) and cell scrapers, and replated in RP10. For transduction, lentivirus was added to culture and macrophages harvested for downstream assays 5–7 days later, replacing media every 2–4 days. For downstream assays, macrophages were detached using 0.25% Trypsin-EDTA, TrypLE, TrypLE Select or Versene (Gibco) and cell scrapers. To test IL-12 receptor (IL-12R) expression, macrophages were cultured in 100 ng/mL lipopolysaccharide (LPS) (Sigma) and 20 ng/mL each rhIFNγ, rhIL-4, rhIL-10 and rh transforming growth factor beta 1 (TGF-β1) (all R&D).
Macrophage and T cell coculture
CD3+ T cell isolation from cryopreserved PBMCs was performed using the EasySep Human CD3 Positive Selection Kit (Stemcell Technologies). For single-dose hIL-12 assays, CD3+ T cells were expanded by culture with Dynabeads Human T-Activator CD3/CD28 (Dynabeads; Gibco) for 1 week, followed by 1-week rest. For multi-dose hIL-12 assays, CD3+ T cells were expanded by 3 days of culture with 25 µL/mL ImmunoCult Human CD3/CD28 T Cell Activator (ImmAct; Stemcell Technologies), followed by 2.5 weeks rest and cryopreservation; on thaw, T cells were cultured for 4 days prior to use. Expansions and assays were performed in RP10 with 30 U/mL rhIL-2. For assays, T cells were stained with CellTrace Violet.
Macrophage and CAR T cell killing assay
For CAR T production, CD8+ and CD4+ T cells were isolated from PBMCs by either a custom sequential positive selection program using a RoboSep-S and EasySep CD8 and CD4 Positive Selection Kits (Stemcell Technologies) or manually by sequential positive selection using CD4 and CD8 MicroBeads (Miltenyi Biotec). The negative cell fraction was cryopreserved in FBS/10% DMSO for subsequent CD14+ isolation. T cells were stimulated with Dynabeads and cultured in RPMI-1640 (Gibco) with 10% FBS (VWR Seradigm), 2 mM l-glutamine (Gibco), 0.5 ng/mL rhIL-15 (Miltenyi Biotec) and either 50 U/mL rhIL-2 (CD8+ T cells; Chiron Corporation) or 5 ng/mL rhIL-7 (CD4+ T cells; Miltenyi Biotec). T cells were transduced with CD19 CAR-HER2tG lentivirus via spinoculation with protamine sulfate (APP Pharma), expanded, enriched for the HER2tG+ subset using biotinylated Trastuzumab antibody (online supplemental table 1) and anti-Biotin Microbeads (Miltenyi Biotec), and further expanded prior to cryopreservation or use in luciferase killing assays. Briefly, CAR T cells were added to eGFP:ffluc GEMs or eGFP:ffluc Raji cells and killing was measured by luminescence 10 min after luciferin addition, using lysis in 1% SDS as a positive control.
Supplemental material
Mouse macrophage culture
Bone marrow was flushed from mouse tibias and femurs21 and cultured in RP10 with recombinant murine (rm) macrophage CSF (rm-CSF: 20, 50, or 100 ng/mL; Peprotech) or rmGM-CSF (20 ng/mL; Peprotech) for 6–7 days, with a cytokine refresh on day 3. Differentiated bone marrow-derived macrophages (BMDMs) were lifted and replated in RP10 with mM-CSF (20–100 ng/mL), which was refreshed every 3–4 days. Media was supplemented with 1% penicillin-streptomycin (P/S; Gibco) as required. Transduction with 0–2500 LPs/initially plated bone marrow cells or BMDMs was performed in the presence of 0–2 ug/mL polybrene (Sigma). To test IL-12R expression, BMDMs were cultured in GL261 cm, 100 ng/mL LPS (Sigma), 50 ng/mL rmIFNγ and 10 ng/mL each rmIL-4, rmIL-13, rmIL-10, and rmTGF-β1 (all R&D). To determine optimal mM-CSF dosage, the CellTiter-Glo Assay (Promega), was used according to manufacturer’s instructions.
Flow cytometry
Cells were incubated with either human or mouse BD Fc Block (BD Biosciences) for 10 min at room temperature, followed by antibody staining at 4°C for 20 min (online supplemental table 1). Cells were fixed in 2% paraformaldehyde and run on a BD LSRFortessa using the BD FACSDiva software. Analysis was performed using FlowJo, V.9, V.10 (BD Biosciences).
Quantification of lentiviral integration
DNA was isolated using the Qiagen QIAamp DNA Blood Mini Kit according to the manufacturer’s instructions. The SCRI Therapeutic Cell Production Core performed the quantitative PCR assay to quantify the number of lentiviral integrations per macrophage, as measured by the woodchuck hepatitis virus post-transcriptional regulatory element (WPRE) copy number per macrophage genome.22 Standard curves of epHIV7 and pCMV6-AC plasmids, containing one copy/molecule of WPRE and human albumin, respectively, were used to interpolate the starting quantities (Sq) of WPRE and albumin in 50 ng of genomic DNA. The number of integrations/cell was then calculated by: (WPRE Sq / albumin Sq)*2.
Mouse models
Unless otherwise indicated, cells were injected in USP phosphate buffered saline (PBS; Amresco). For the intracranial U87 model, U87 injection (day 0) and GEM injection (day 6) were performed as described.15 For the subcutaneous U87 model, 200 µL U87 cells (in 1:1 Matrigel (Corning):USP PBS) were subcutaneously injected into the flank. Seventeen to eighteen days later, 50 (intratumorally) or 200 (intravenously) µL GEMs were injected. GEMs were detected using bioluminescent imaging (IVIS Spectrum, Caliper Life Sciences) following subcutaneous injection of D-Luciferin in the scruff (Perkin Elmer). Images were analyzed using Living Image Software (Caliper Life Sciences). For the subcutaneous B16.F10 model, 100 µL B16.F10s were subcutaneously injected into the flank. Eight days later, 50 µL GEMs were injected intratumorally into tumors≤100 mm3. Mice were euthanized on 20% wt loss or when subcutaneous tumors reached 2000 mm3. For the RCAS/TVA glioma model, tumors were initiated as previously described.17 23 Briefly, DF1 cells bearing RCAS-PDGFB or RCAS-Cre in PBS (Gibco) were injected 3 mm lateral to the bregma at a depth of 1 mm and 9 days later PBS or syngeneic GEMs were injected intratumorally. Tumor formation was monitored by daily weights. Animals were sacrificed on development of neurological symptoms as defined by the Institutional Animal Care and Use Committee. Brains were formalin-fixed and paraffin-embedded (FFPE) using 10% neutral buffered formalin (Sigma Aldrich).
Human slice culture model
Culture of freshly resected human tumors was performed as previously described with minor modifications.24 25 Briefly, immediately following surgical resection, 6 mm punch biopsies were placed in Belzer UW Cold Storage solution, and 250 µm axial slices were cut using a Vibratome (Leica Biosystems). Sections were placed atop a permeable PTFE membrane with 0.4 mm pores (Millicell; MilliporeSigma), in slice culture media (defined24) at 37°C. The following day, 5 ng/mL rhIL-12, or 1×10⁵ GEMs were added to sections. GEMs without eGFP:ffluc were stained with CFSE (BioLegend). Media was exchanged after 72 hours. Tumor slices were fixed in 10% neutral-buffered formalin and embedded in paraffin, placed in RNALater (Ambion) for downstream RNA analysis, or used for live imaging analysis.
Live imaging analysis
Tumor slices were removed from their wells and cultured in 500 µL slice culture media containing epithelial cell adhesion molecule (EpCAM)-Alexa 647 and SR-FLICA reagents (online supplemental table 1) for 3 hours on a rocker in a humidified 37°C incubation chamber. Hoechst 33 342 (ImmunoChemistry Technologies) was added 15 min prior to imaging. After incubation, slices were transferred to µ-Slide 8 Well clear bottom imaging slides (Ibidi) and imaged using a Leica SP8x confocal microscope with a 10×0.4 NA dry objective. Three to four 20 uM z-stack series were obtained for each slice and used to generate maximum intensity projections. Images were randomized. Hoechst+EpCAM+, Hoechst+EpCAM+SR-FLICA+, and eGFP+ or CFSE+ (GEMs) cells were counted with ImageJ software by an investigator blinded to experimental conditions.26
Protein quantification
Cytokines and chemokines were analyzed using the Milliplex Map Human Cytokine/Chemokine Magnetic Bead Panel or Bio-Rad Bio-Plex reagent kits, according to manufacturers’ instructions (online supplemental table 1), and run on a Bio-Plex 200 System (Bio-Rad). Antibodies were quantified using 100 µL undiluted supernatant on ELISAs for Ipilimumab (Biovision) and Adalimumab (Eagle Biosciences), according to manufacturer’s instructions with construction of the Ipilimumab standard curve using 10 and 100 µL of standards. Concentrations were calculated using a four or five-parameter logistic standard curve and technical duplicates were used for all assays.
Differential gene expression using NanoString
For lysates, 35,000 cells/µL were lysed in Buffer RLT (Qiagen) with 1% 2-mercaptoethanol (Bio-Rad). Lysates were loaded directly onto the cartridge. For tumor slice culture, slices were homogenized in TRizol (Ambion) with an electric tissue homogenizer and following the addition of 70% ethanol, RNA was isolated using the RNeasy Mini Kit (Qiagen), according to the manufacturer’s instructions. For FFPE samples, RNA was isolated from two 20 µm sections using the RNeasy FFPE Kit (Qiagen), according to the manufacturer’s instructions. RNA concentration and the DV200 value were measured on an Agilent TapeStation 4200 or Nanodrop. The amount of RNA loaded on the cartridges was normalized by percent fragmentation for human slice culture and mouse FFPE samples. Samples were analyzed using NanoString panels (online supplemental table 1), run on an nCounter Sprint Profiler, and data analyzed using the nSolver V.4.0 software (NanoString) and Microsoft Excel. Raw counts underwent background thresholding, positive control normalization, and CodeSet content normalization per the manufacturer’s recommended protocol.
Statistics
Statistical analyses were performed with GraphPad Prism 7 (GraphPad). Analysis of supernatant cytokine/chemokine concentrations was performed using non-parametric methods: Kruskal-Wallis (unmatched samples) or Friedman (matched samples), and Dunn’s multiple comparisons test. Analysis of survival curves was performed using the log-rank (Mantel-Cox) test with Holm-Sidak’s multiple comparisons test. All other statistical analyses were performed using parametric methods: unpaired two-tailed t test for two groups; regular or repeated measures one-way analysis of variance (ANOVA) adjusted for multiple comparisons with either Tukey’s, Dunnet’s, or Sidak’s multiple comparisons tests; or a two-way repeated measures ANOVA with Sidak’s multiple comparisons test. Select statistical analysis of gene expression was performed using a two-way repeated measures ANOVA adjusted for multiple comparisons by controlling the false discovery rate (Q=0.05, Benjamini and Yekutieli method). Genes used for analysis required a q<0.05 and a≥ twofold change in expression compared with the control. Asterisks indicate p value significance level: *≤0.05, **≤0.01, ***≤0.001, ****≤0.0001 and non-significant (ns) >0.05.
Results
GEMs express immunomodulatory proteins
To produce GEMs, human monocyte-derived macrophages were transduced with lentivirus encoding CD19t, eGFP:ffluc, CD19t/hIL-12, ffluc/CD19t, or α-CTLA-4/CD19t (figure 1A). We previously demonstrated that >95% of macrophages are transduced using a multiplicity of infection of 1.15 To standardize across lentiviruses that could not be titrated using flow cytometry, we measured virus-associated p24 particles and quantified transduction dose using LPs/macrophage. CD19t surface expression on >90% of macrophages required 250 CD19t and 750 CD19t/hIL-12 LPs/macrophage (figure 1B). hIL-12 secretion and lentiviral/WPRE integration events increased with lentiviral concentration, reaching an average of up to 90 fg/macrophage/24 hours hIL-12 and 52 integrations/macrophage (figure 1C, online supplemental figure 1A). Titration of the lentiviral dose allowed targeting integration events at or below the FDA-recommended level (<5 integrations/genome27) achieving five integrations/macrophage while maintaining high levels of hIL-12 secretion (23 fg/mac/24 hours) with 50 CD19t/hIL-12 LPs/macrophage. hIL-12 secretion peaked 8–14 days after transduction (37.5 ng/24 hours/5×105 GEMs) (figure 1D, online supplemental figure 1B) before decreasing, potentially due to transient transcription from non-integrated lentiviral vectors. GEMs sustained secretion of hIL-12 above 10 ng/24 hours for 5 weeks and above 3 ng/24 hours for 12 weeks (figure 1D). The decrease in hIL-12 secretion was associated with decreased GEM confluence, suggesting that some cell death had occurred. Collectively, these data support the feasibility of titrating protein doses by adjusting lentiviral concentration or GEM cell number.
Supplemental material
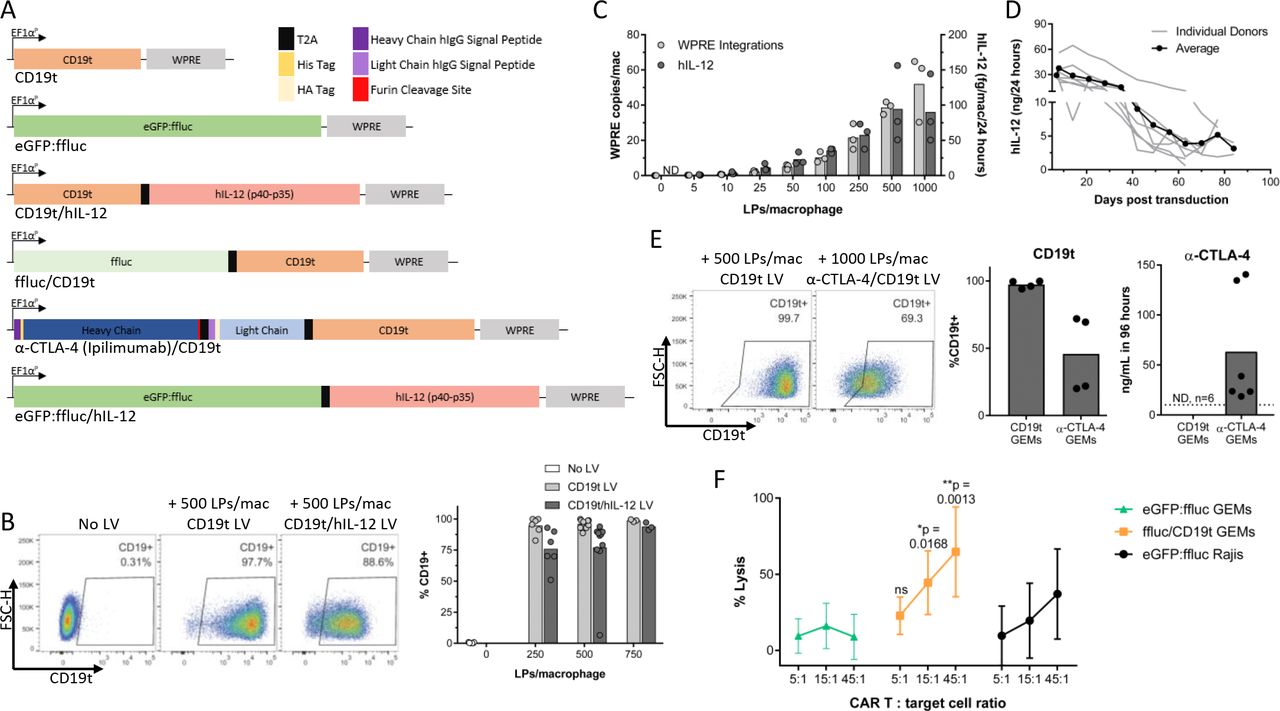
Lentiviral transduction of human macrophages provides long-term expression of surface, intracellular, and secreted proteins. (A) Expression constructs delivered to human macrophages by lentiviral transduction. (B) Six to twelve days after transduction with CD19t or CD19t/hIL-12 lentivirus, macrophages were detached using TrypLE and surface CD19t measured by flow cytometry (n=3–10 donors, compiled from five independent experiments). (C) hIL-12 levels in supernatant and genomic lentiviral integrations were assessed 8 days after transduction of macrophages with CD19t/hIL-12 lentivirus (n=3 donors, 1 experiment). (D) hIL-12 levels in supernatant from 5.0×10⁵ macrophages transduced with 500 LPs/macrophage CD19t/hIL-12 lentivirus (n=7 donors, 1 experiment). (E) Five-6 days after transduction of 5.0×10⁵ macrophages with 500 (n=4 donors) or 1000 (n=2 donors) LPs/macrophage CD19t lentivirus or 1000 LPs/macrophage α-CTLA-4/CD19t lentivirus, media was replaced to 1 mL and collected 96 hours later. Antibody levels were quantified by ELISA, limit of detection represented by dashed line (n=2–6 donors per timepoint, compiled from two experiments) and surface CD19t measured by flow cytometry 7 days after transduction (n=4 donors transduced with 500 LPs/macrophage CD19t and 1000 LPs/macrophage α-CTLA-4/CD19t, from one experiment). (B–E) Data points represent individual donors, bars represent the mean. (F) Five to eight days after transduction of macrophages, 1×10⁴ GEMs or eGFP:ffluc Raji (CD19t+) cells were incubated with a 1:1 mixture of CD19 CD4+ and CD8+ CAR T cells for 4 hours prior to detection of viable cells by luciferase assay. Each data point represents the mean (SD) of 3 individual donors (n=6 technical replicates per donor, 1 experiment). Two-way repeated measures ANOVA with Sidak’s post hoc test comparing each 5:1, 15:1 and 45:1 condition between ffluc/CD19t and eGFP:ffluc GEM groups, ns: p>0.05. ANOVA, analysis of variance; CTLA-4, cytotoxic T-lymphocyte-associated protein 4; EF1αP, EF1-α promoter; eGFP, enhanced green fluorescent protein; hIL-12, human interleukin-12; LLOQ, lower limit of quantitation; LPs, lentiviral particles; LV, lentivirus; Mac, macrophage; ND, non-detect.
To determine if GEMs could secrete full-length antibodies to improve targeted delivery of checkpoint blockade antibodies and reduce effective concentrations, we transduced macrophages with a lentiviral vector encoding α-CTLA-4. Transduction of 5×10⁵ GEMs with α-CTLA-4/CD19t lentivirus resulted in CD19t expression on 46% of GEMs and secretion of 59 ng/mL antibody over 96 hours (figure 1E). Similarly, transduction of 5×10⁵ GEMs with α-TNF-α/CD19t lentivirus resulted in CD19t expression on 67% of GEMs and 40 (48 hours) and 60 (72 hours) ng/mL antibody (online supplemental figures 1C–E). CD19t also identifies adoptively transferred cells and provides a target for GEM elimination. When cultured with CD19 CAR T cells, GEMs expressing CD19t were killed within 4 hours, and almost completely eliminated by 24 hours, while GEMs lacking CD19t were resistant (figure 1F, online supplemental figure 1F).
GEMs traffic to and persist long-term in the solid TME
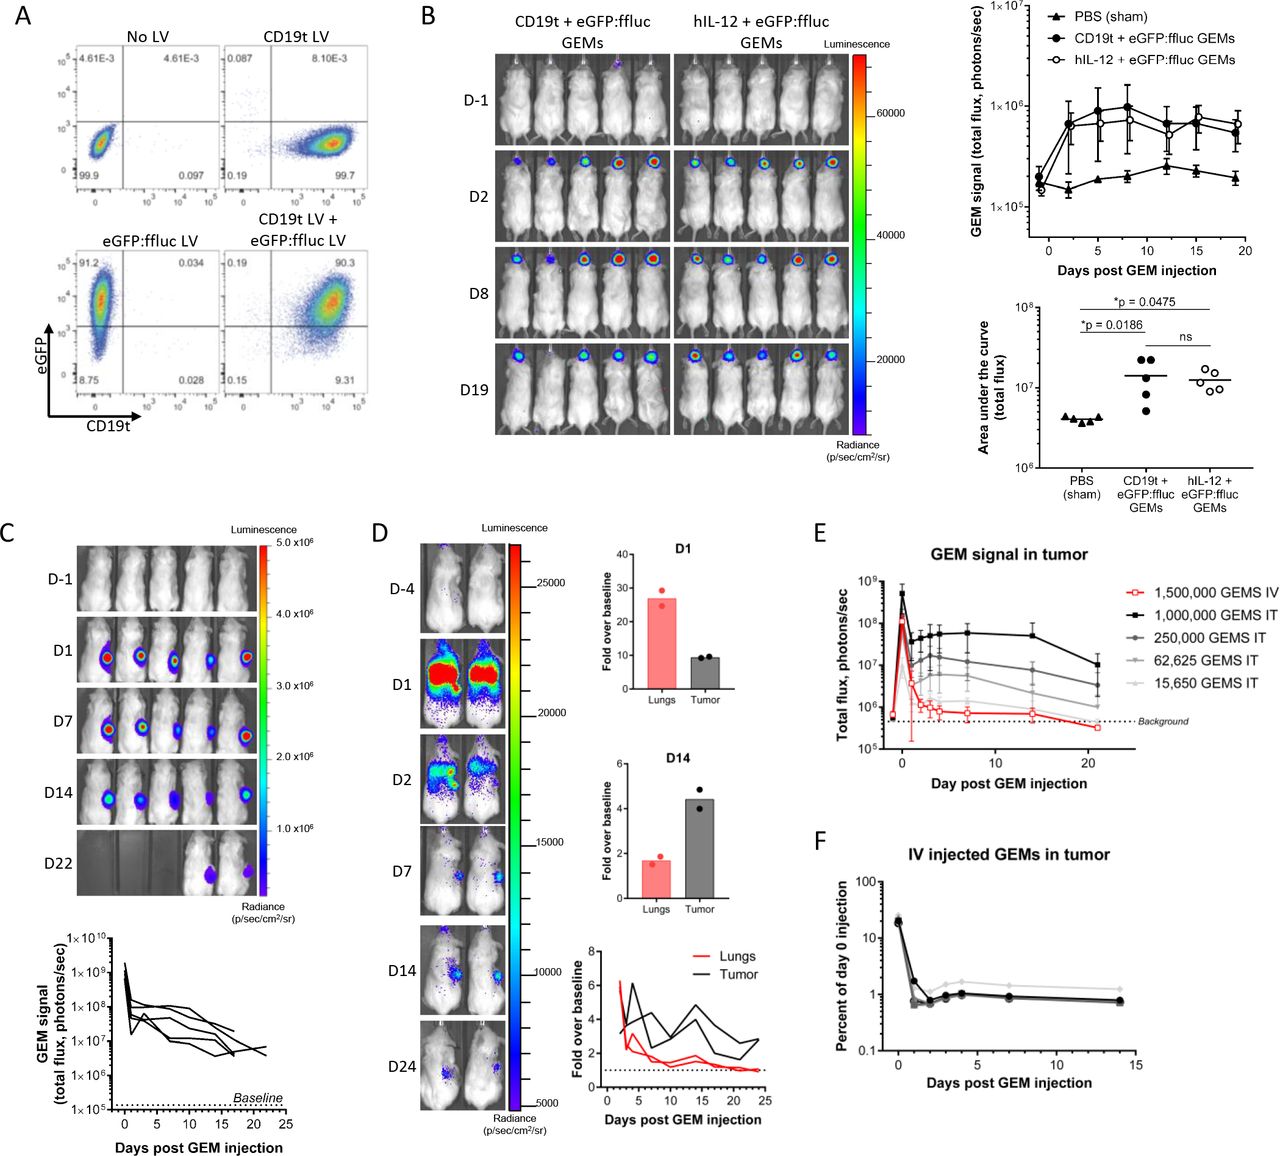
We hypothesized that the natural accumulation of macrophages in the glioblastoma TME28 would support GEM retention in the tumor. To test this, we injected GEMs expressing eGFP:ffluc and either CD19t or hIL-12 into established intracranial U87 xenograft tumors. Cotransduction of macrophages with eGFP:ffluc and CD19t lentiviruses resulted in 90% of GEMs expressing high levels of both transgenes (figure 2A). In vivo, GEMs were readily detectable at the time of animal sacrifice on day 19 (figure 2B). To determine if intratumorally injected GEMs persist in extracranial tumors lacking the physical constraints of the blood–brain barrier (BBB), we tracked eGFP:ffluc GEM persistence in U87 flank tumors. When animals were sacrificed due to tumor volume 17–22 days after GEM injection, GEM bioluminescence remained 39-fold greater than baseline (figure 2C). Consistent with our previous observation,15 we did not detect GEMs outside of either intracranial or subcutaneous tumors (figure 2B,C), suggesting that locally injected GEMs could improve local therapeutic targeting and avoid off-target effects.

GEMs exhibit stable transgene expression, persistence and trafficking to solid tumors in vivo. (A) CD19t and eGFP expression were quantified 7 days after single or dual transduction of macrophages with 500 LPs/macrophage CD19t, eGFP:ffluc or both lentiviruses (n=1 donor, 1 experiment). (B–F) Mice were implanted with human U87 cells and then injected with eGFP:ffluc-expressing GEMs. In vivo presence of macrophages was measured by bioluminescent imaging. (B) PBS, 1.5×10⁵ CD19t+eGFP:ffluc GEMs, or 1.5×10⁵ hIL-12 +eGFP:ffluc GEMs were injected into established intracranial U87 tumor seeded with 2.0×10⁵ cells. Each data point represents the mean (SD) of n=5 mice from one experiment (top). Area under the curve was quantified for each mouse, data points represent individual mice, bars represents the mean (bottom). One-way ANOVA with Tukey’s multiple comparisons test, ns: p>0.05. (C) 1.0×10⁶ eGFP:ffluc GEMs were injected into established U87 flank tumors seeded with 1×10⁶ cells. Each line represents one mouse (n=5 mice, 1 experiment). (D) 5×10⁶ eGFP:ffluc GEMs were injected into the tail vein in mice with established U87 flank tumors seeded with 5×10⁶ cells. Fold change in bioluminescent signal was calculated over baseline (D-4) at D1 (top) and D14 (middle) and is shown for D2–D24 (bottom). Lines and data points represent individual mice, bars represent the mean (n=2 mice, 1 experiment). (E, F) 1.565×10⁴–1.0 x 10⁶ eGFP:ffluc/hIL-12 GEMs were injected intratumorally or 1.5×10⁶ eGFP:ffluc/hIL-12 GEMs were injected via the tail vein in mice with established U87 flank tumors seeded with 1×10⁶ cells; (E) each data point represents the mean (SD) of n=3–6 mice from one experiment. (F) Intravenously injected GEMs as a percentage of the 1.5×10⁶ eGFP:ffluc/hIL-12 GEMs injected on day 0; each line represents one mouse. ANOVA, analysis of variance; D, day; eGFP, enhanced green fluorescent protein; GEMs, genetically engineered macrophages; IT, intratumoral; IV, intravenous; LV, lentivirus.
Since macrophages are integral components of many solid tumors, we hypothesized that GEMs would traffic to the solid TME after systemic delivery. Twenty-four hours after intravenous injection of 5.0×10⁶ eGFP:ffluc GEMs, although predominantly localized to the lungs, GEMs were detectable in the flank tumor. Three days after injection, most of the remaining GEMs had localized to tumor where they remained until animals were sacrificed (figure 2D). Similar results were obtained following the intravenous injection of 1.5×10⁶ eGFP:ffluc/hIL-12 GEMs (online supplemental figure 2A). To quantify the number of GEMs that trafficked to the tumor, we injected U87 subcutaneous tumors with different starting numbers of eGFP:ffluc/hIL-12 GEMs and measured their bioluminescence in the tumor over 3 weeks (figure 2E). Using the day 0 cell number to bioluminescence ratio, we calculated the number of cells present in the tumor at subsequent days from the bioluminescent signal in the tumor. These values were then used to construct standard curves for each day to quantify the number of intravenously injected GEMs that trafficked to the tumor (online supplemental figure 2B). Within 24 hours, 0.99% of intravenously injected GEMs trafficked to the tumor where they persisted for 7 (0.97%) and 14 days (0.83%) (figure 2F).
Supplemental material
Constitutive secretion of hIL-12 does not modify macrophage phenotype
We evaluated human macrophage and GEM phenotype for potential effects from hIL-12 signaling. IL-12R is composed of two subunits, IL-12Rβ1 and IL-12Rβ2, and though the heterodimer is required for high affinity binding and signaling, the IL-12Rβ2 homodimer may also transmit IL-12 signaling.29 Although we did not detect the IL-12R heterodimer on macrophages, nor on CD19t or hIL-12 GEMs, we could not rule out signaling through IL12-Rβ2 homodimers (figure 3A,B and online supplemental figures 3A,B).29 To address this, we compared protein secretion, surface markers, and gene expression between untransduced macrophages, CD19t GEMs, and hIL-12 GEMs. Analysis of media from cultured GEMs for 28 different analytes showed that transduction with the hIL-12-encoding lentivirus significantly impacted only hIL-12 concentrations (online supplemental table 2, figure 3C). Expression of CD11b, programmed death-ligand 1 (PD-L1), antigen presentation molecules (CD40, CD80, CD86, HLA-DR/HLA-DP/HLA-DQ or HLA-DR), and scavenger receptors (CD163, CD206, CD209) were equivalent before and after transduction (figure 3D). Of 249 genes evaluated using a Nanostring gene expression panel, 166 were detectable in at least 33% of samples and only 3/166 genes showed ≥2 fold statistically significant regulation: IL12A was upregulated in hIL-12 GEMs, and MX1 and HLA-DRB1 increased independently of payload (figure 3E), indicating minimal hIL-12 autocrine or paracrine effects. While we cannot exclude potential effects of secreted hIL-12 on GEMs in vivo, these data demonstrate that human macrophages do not express the IL-12R heterodimer required for signaling in vitro.
Supplemental material
Supplemental material
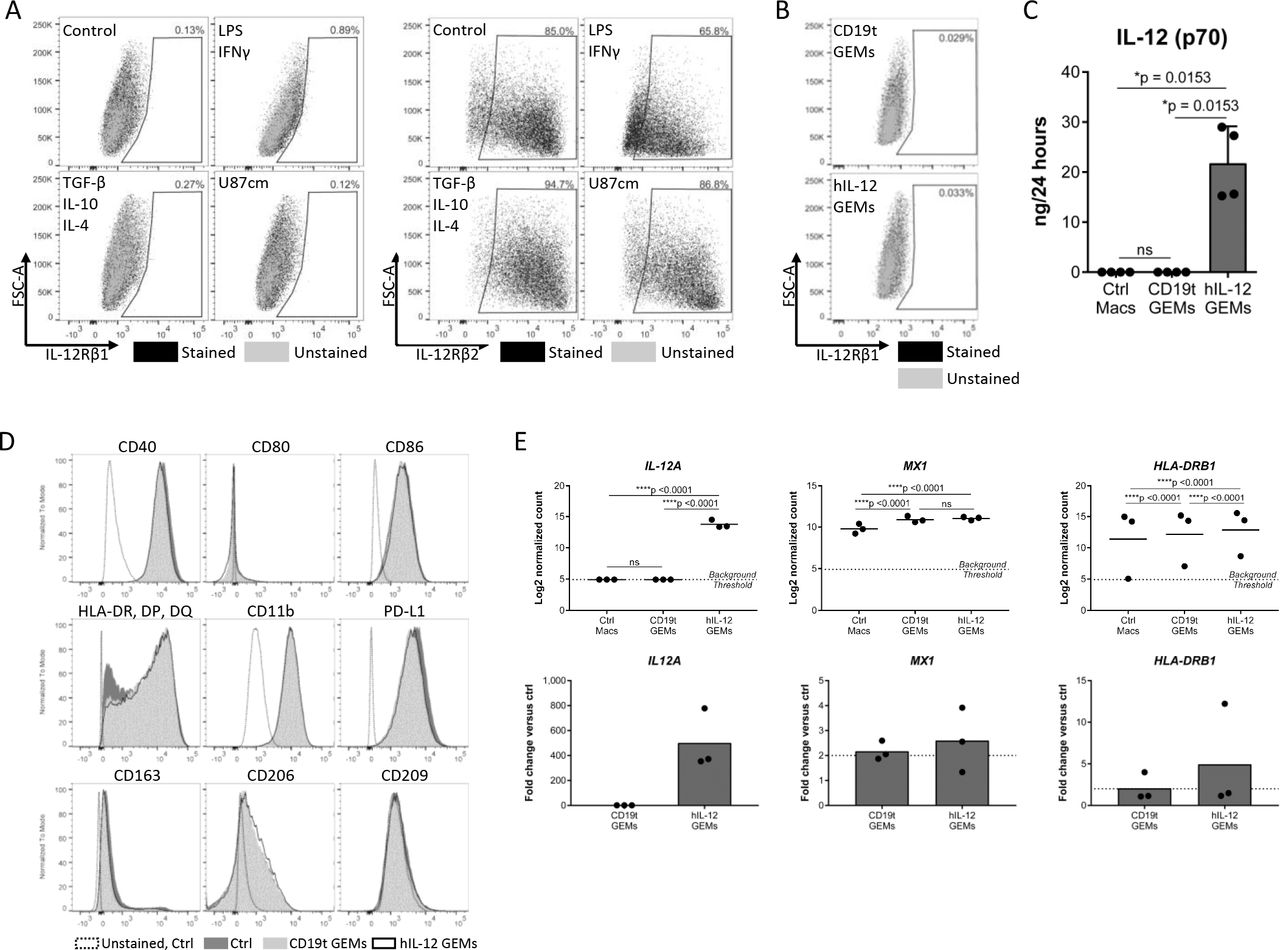
Macrophage phenotype is not altered by constitutive secretion of hIL-12. (A) Macrophages were treated as indicated for 24 hours and detached using TrypLE. IL-12Rβ1 (left, n=6 donors compiled from two independent experiments, showing representative results from one donor) and IL-12Rβ2 (right, showing one combined sample from n=3 donors, 1 experiment) were measured by flow cytometry. (B) IL-12Rβ1 expression on CD19t and IL-12 GEMs 7 days after transduction, cultured in P/S (n=1 donor). (C) Five to seven days after transduction of 5.0×10⁵ macrophages with 250 or 500 (representative data) LPs/macrophage CD19t or CD19t/hIL-12 lentivirus, media was replaced to 1 mL and collected 24 hours later. Cytokine and chemokine levels in the media were quantified by multiplex analysis. IL-12 (p70) was the only analyte detectable in at least 33% of samples with statistically significant regulation; data points represent individual donors, bars represent the median (n=3–5 donors, data compiled from two experiments, showing representative results from one experiment). Kruskal-Wallis test with Dunn’s post hoc test, values <LLOQ and >ULOQ were set to the LLOQ and ULOQ, respectively, for statistical analysis, ns: p>0.05. Expanded data and statistics are shown in online supplemental table 2. (D) Expression of surface markers on untransduced macrophages (Ctrl), CD19t GEMs and hIL-12 GEMs 7–9 days after transduction. Showing representative results from one donor (n=6–7 donors compiled from two independent experiments, showing representative results from one donor). (E) Gene expression of untransduced (Ctrl Macs), CD19t GEMs, and hIL-12 GEMs 7 days after transduction. Genes shown were detectable in at least 33% of samples, showed statistically significant regulation by a two-way repeated measures ANOVA corrected for multiple comparisons, and changed by least 2-fold. Data points represent individual donors, bars represent the mean (n=3 donors, 1 experiment), ns: p>0.05. ANOVA, analysis of variance; Ctrl, control; GEMs, genetically engineered macrophages; hIL, human IL; IL-12, interleukin 12; LLOQ, lower limit of quantitation; LPs, lentiviral particles; Macs, macrophages, ns, not significant; PD-L1, programmed death-ligand 1; ULOQ, upper limit of quantitation.
hIL-12 GEMs activate T cells in vitro
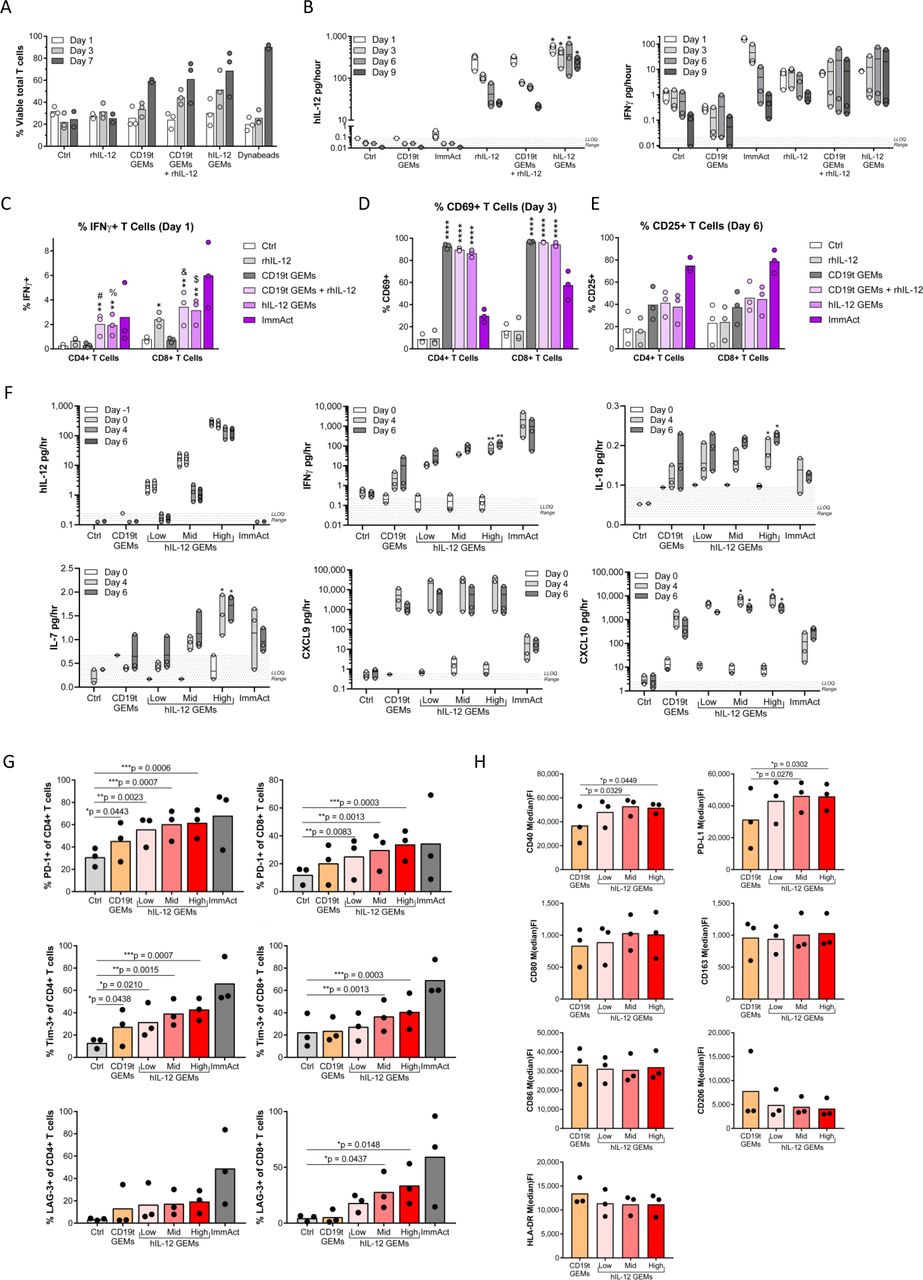
To confirm that hIL-12 secreted by human GEMs activates T cells, we cultured human peripheral blood T cells with autologous GEMs. T cell viability was increased on days 3 and 7 when cocultured with either CD19t or hIL-12 GEMs as compared with T cells cultured alone or with rhIL-12 (figure 4A), suggesting an IL-12-independent supportive effect of macrophages on T cells. To evaluate effects of GEMs on T cell activation, we cultured ex vivo expanded T cells with GEMs. We confirmed hIL-12 was produced in the co-cultures containing hIL-12 GEMs (D1, 555; D3, 410; D6, 303 and D9, 241 pg/hour) (figure 4B). T cells cultured in any condition containing hIL-12 produced greater concentrations of IFNγ at all time points compared with conditions without hIL-12, confirming that engineered hIL-12 secreted by macrophages retained its expected function (figure 4B). IFNγ in the media was likely underrepresented due to GEM and T cell uptake of IFNγ, as intracellular cytokine staining showed a significant increase of IFNγ+T cells (figure 4C). CD4+ T cell IFNγ production was dependent on the presence of GEMs and hIL-12 (figure 4C). The early activation marker CD69 was significantly increased on T cells co-cultured with GEMs, which was hIL-12 independent (figure 4D). A similar, though not statistically significant trend was detected for the later activation marker CD25 (figure 4E).

hIL-12 GEMs support T cell viability, activation and IFNγ production while maintaining a proinflammatory polarization in vitro. (A) Immediately following positive selection from cryopreserved PBMCs, 1×10⁶ CD3+ T cells were cultured with media only (Ctrl), 5 ng/mL rhIL-12, or 1.25×10⁵ autologous CD19t GEMs, CD19t GEMs and rhIL-12, or hIL-12 GEMs, or 1:1 Dynabeads (n=3 donors, 1 experiment). Media and treatments were changed on days 1, 3, 5, and seven and T cell viability measured by flow cytometry. (B–E) After expansion, 1×10⁶ CD3+ T cells were cultured with media only (Ctrl), 5 ng/mL rhIL-12, or 1.25×10⁵ autologous CD19t GEMs, CD19t GEMs and rhIL-12, or hIL-12 GEMs, or 25 µL/mL ImmAct (n=3 donors, 1 experiment). Media and treatments were changed on days 3 and 6. (B) hIL-12 and IFNγ levels in the supernatant, (C) intracellular IFNγ, (D) CD69, and (E) CD25 expression on CD4+ and CD8+ T cells 5 hours following treatment with 10 ug/mL Brefeldin A. (F–H) After expansion, 4.0×10⁶ CD3+ T cells were cultured with media only (Ctrl), or 5×10⁵ autologous CD19t GEMs (60.5 LPs/macrophage) or hIL-12 GEMs (1.6, 7, and 60.5 LPs/macrophage for low, mid and high hIL-12 production), or 25 µL/mL ImmAct (n=3 donors, 1 experiment). Media was changed every 48 hours starting at day 0 and collected on days −1, 0, 4 and 6 for cytokine analysis (F) and GEMs and T cells analyzed by flow cytometry on day 6 (G, H). For supernatant cytokines (B, C, F), each time point was analyzed using Friedman’s repeated measures test, with Dunn’s multiple comparisons test to compare to Ctrl. For (B) the exact p value for all *=0.0268. For (F), exact p-values: IFNγ **=0.0078, IL-18 *=0.0018, IL-7/D4 *=0.0393, IL-7/D6 *=0.0119, CXCL10/Mid *=0.0180, and CXCL10/High *=0.0393. For flow cytometry CD4+ and CD8+ T cells (C–E, G) were independently analyzed and macrophages (H) were analyzed using a one-way repeated measures ANOVA, with Dunnett’s multiple comparisons test to compare to Ctrl (T cells) or CD19t GEMs (macrophages). For IFNγ, exact p value for *0.0292 and for ** are #=0.0024, %=0.0033, &=0.0018, and $=0.0036. For CD69, exact p value for all ****0.0001. For all panels: Transduction with 500 LPs/macrophage unless otherwise noted; data points represent individual donors, bars represent the mean; the ImmAct condition was excluded from statistical analysis; only significant results are indicated, ns: p>0.05. ANOVA, analysis of variance; Ctrl, control; GEMs, genetically engineered macrophages; hIL-12, human interleukin-12; IFNγ, interferon-gamma; ImmAct, ImmunoCult Human CD3/CD28 T Cell Activator; LPs, lentiviral particles; ns, not significant; PBMCs, peripheral blood mononuclear cells; PD-1, programmed cell death protein 1.
To assess the feasibility of titrating hIL-12 dose delivered by GEMs, we cultured autologous T cells with hIL-12 GEMs transduced to target hIL-12 secretion over a three-log span (2.1, 16.9, 264 pg/day, average of days −1 and 0; figure 4F). Increasing hIL-12 secretion by GEMs resulted in increased supernatant levels of IFNγ, chemokines downstream of IFNγ (C-X-C motif chemokine ligand (CXCL)nine trended towards increasing, CXCL10), the T-cell supporting cytokine IL-7, and IL-18, which enhances IFNγ production from T cells especially in the presence of IL-1230 (figure 4F). After 6 days, T cells were assessed by flow cytometry for the presence of classical exhaustion markers as a read-out for high-level activation. Increasing hIL-12 secretion by GEMs resulted in an increased percentage of CD8+ T cells expressing programmed cell death protein 1 (PD-1), lymphocyte-activation gene 3, and T-cell immunoglobulin and mucin-domain containing-3 (Tim-3), and increased percentages of CD4+ T cells expressing PD-1 and Tim-3 (figure 4G). Coculture with T cells induced a modest increase of CD40 and PD-L1 on hIL-12 GEMs; however, most antigen presentation molecules (CD80, CD86, HLA-DR) and scavenger receptors (CD163, CD206) remained unchanged (figure 4H), suggesting that GEMs are not polarized to an M2 phenotype.
Mouse bone marrow-derived IL-12 GEMs induce an IFNγ-driven response and slow tumor growth, enhancing survival in vivo
To study GEMs in an intact TME, we developed a parallel mouse GEM system. Consistent with previous work,31 differentiation of mouse BMDMs with rmGM-CSF yielded F4/80+ macrophages and CD11c+ dendritic cells, while differentiation with mM-CSF increased the purity of F4/80+ macrophages (online supplemental figure 4A). In contrast to human monocyte-derived macrophages, BMDMs required continuous cytokine supplementation to support viability (online supplemental figure 4B,C) and high-level transduction efficiency with CD19t/mIL-12 (figure 5A) required polybrene (online supplemental figure 4D). Once the engineering process was optimized, mIL-12 GEMs responded to dose titration like hIL-12 GEMs (figure 5B). Since mouse IL-12Rβ1 and IL-12Rβ2 bind mIL-12 with different affinities than their human homologs and may have different expression patterns,32 we measured the surface expression of mouse IL-12Rβ1 and IL-12Rβ2 on BMDMs. Though expression was low, BMDMs coexpressed IL-12Rβ1 and IL-12Rβ2 under multiple conditions including IFNγ/LPS-stimulated upregulation of IL-12Rβ1, as expected33 (figure 5C, online supplemental figure 5A,B), suggesting that unlike hIL-12 GEMs, mIL-12 GEMs could experience autocrine or paracrine signaling effects.
Supplemental material
Supplemental material
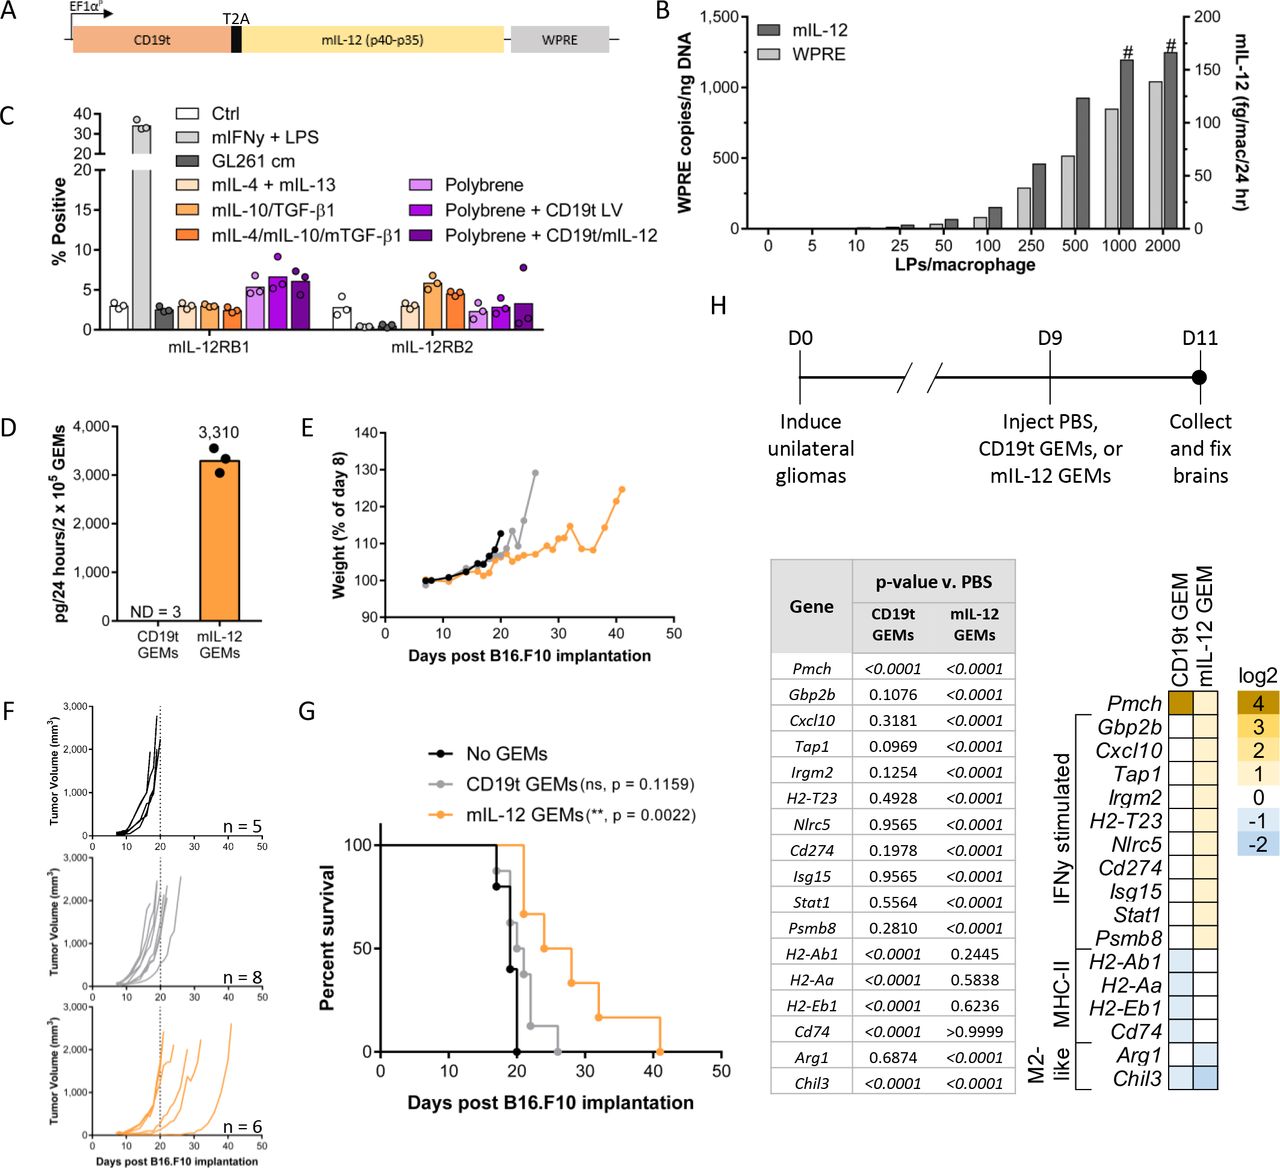
Mouse GEMs secreting mIL-12 increase survival and stimulate IFNγ-driven responses in vivo. (A) mIL-12 levels in supernatant and lentiviral integrations per 50 ng input genomic DNA were assessed 8 days after transduction of B6 Albino BMDMs (n=1 mouse). The # symbol indicates mIL-12 was extrapolated beyond the standard curve. (B) IL-12Rβ1 and IL-12Rβ2 expression on B6 Albino BMDMs measured by flow cytometry 8 days after transduction and 24 hours after the addition of cytokines or GL261 cm. Each data point represents an individual mouse (n=3 mice, 1 experiment), bars represent the mean. (C) Expression construct encoding mIL-12 and CD19t delivered to murine macrophages by lentiviral transduction. (D–G) 2×10⁵ CD19t GEMs or mIL-12 GEMs (pooled from n=3 B6 Albino mice) were injected into established B16.F10 flank tumors seeded with 2.5×10⁵ cells in B6 Albino mice (n=5–8 mice/group as shown in (F), 1 experiment). (D) Prior to injection (n=2 technical replicates per condition) and following replating of cells lifted for injection (n=1 technical replicate per condition), supernatant from GEMs was measured for mIL-12 levels and used to calculate the mIL-12 secreted by 2.0×10⁵ mIL-12 GEMs over a 24-hour period in vivo. Data points represent technical replicates, bars represent the mean. (E) Mouse weight as a percentage of day 8, immediately prior to GEM injection. Data points represent the mean (SD). (F) Tumor burden, each line represents one mouse. Dashed line on each graph is at day 20. (G) Survival curves. CD119t and mIL-12 GEM groups compared with the ‘No GEMs’ group using the log-rank (Mantel-Cox) test with the Holm-Sidak correction for multiple comparisons, ns: p>0.05. (H, top) PBS, 7.5×10⁴ syngeneic CD19t GEMs, or 7.5×10⁴ syngeneic mIL-12 GEMs were injected into established intracranial tumors (n=3–4 mice/group, 1 experiment). Brains were collected into formalin 2 days later. (H, bottom) Gene expression from RNA extracted from FFPE sections. Genes shown were detectable in 45% or greater of the samples, significantly changed (p<0.05) compared with the PBS group by two-way repeated measures ANOVA corrected for multiple comparisons, and changed by at least 2-fold compared with the PBS control group. Heat map represents log2 fold change compared with PBS group. ****P<0.0001, NS: p>0.05. ANOVA, analysis of variance; BMDMs, bone marrow-derived macrophages; Ctrl, control; D, day; FFPE, formalin fixed and paraffin embedded; GEMs, Mac, macrophage; IFNγ, interferon-γ; IL-12, interleukin 12; LPS, lipopolysaccharide; PBS, phosphate buffered saline; WPRE, woodchuck hepatitis virus post-transcriptional regulatory element.

hIL-12 GEMs induce IFNγ responses and tumor cell death in human tumors ex vivo. (A) Process for ex vivo slice culture of human tumor samples. The day after slicing and culturing, rhIL-12, CD19t GEMs or hIL-12 GEMs were added to slice cultures. (B, C) Live fluorescent imaging (red, EpCAM+ tumor; green, CFFE+ GEMs; cyan, SR-FLICA+ activated caspases) was used to quantify tumor cell death on day 6 of co-culture, measured as the percentage of SR-FLICA+ tumor cells. Showing representative images from one tumor core (n=5 tumor cores), bar is 100 µm. (D, E) hIL-12, IFNγ, CXCL9 and CXCL10 levels in supernatant. (F) Gene expression analysis on day 3 (1–2 slices/treatment, n=4 tumor cores). To account for differences in gene expression between patients, fold change values for each condition and experiment were averaged. Genes were selected for analysis if they were expressed in at least 25% of samples in each tumor core and if fold change values changed more than twofold compared with the PBS group. Heat map represents log2 fold change compared with PBS group, fold change values were averaged from four independent experiments. For (C), each data point represents the mean of 3–5 high-powered fields quantified for one slice/condition. Statistical significance by one-way repeated measures ANOVA with Sidak’s multiple comparisons correction, all pairwise comparisons made are depicted on graph. For (D, E) each data point represents the mean of supernatant from 1 to 4 slices/condition. Statistical significance independently calculated for D3 and D6 by the repeated measures Friedman test with Dunn’s multiple comparisons correction, for the same pairwise comparisons made in (C). Only significant results are indicated, and they are all significant with respect to the ctrl group. Exact p values: %=0.0194, #=0.0132, and &=0.0282; and ns: p>0.05. For (D), ‘- tumor slice’ samples were not included in the statistical calculations. ANOVA, analysis of variance; Ctrl, control; CXCL9, C-X-C motif chemokine ligand 9; D, day; ePCAM, epithelial cell adhesion molecule; GEMs, genetically engineered macrophages; hIL-12, human interleukin-12; IFNγ, interferon-gamma; IL-12, interleukin-12; ns, not significant; PBS, phosphate buffered saline.
To validate our GEM delivery platform, we used the syngeneic B16.F10 melanoma model. Eight days after subcutaneous implantation of B16.F10 tumors, we intratumorally injected 2×10⁵ CD19t GEMs or mIL-12 GEMs delivering 3310 ng/day mIL-12 (figure 5D). Mice that received mIL-12 GEMs did not demonstrate weight loss, indicating an absence of mIL-12-induced toxicity (figure 5E). mIL-12 GEMs slowed tumor growth (figure 5F) and increased survival compared with control mice (figure 5G). To determine whether mIL-12 GEMs activated host immunity in tumors residing behind the BBB, we used the immunocompetent RCAS/TVA glioma model that develops progressive tumors arising from oncogene driven transformation in situ.17 23 Gene expression in tissue extracted from tumor-bearing mice showed that mIL-12 GEMs up-regulated many IFNγ-inducible genes, including the IFNγ-responsive transcription factor signal transducer and activator of transcription (Stat1) and Cxcl10, and down-regulated genes associated with M2-like macrophages, including arginase 1 (Arg1), the target of an inhibitor being tested in solid tumor patients (NCT02903914) (figure 5H). These data suggest that mIL-12 GEMs initiate local pro-inflammatory responses in the TME, potentially supporting the recruitment and activation of anti-tumor immune cells. hIL-12 GEMs induce death of solid tumor in ex vivo human slice culture model.
hIL-12 GEMs induce death of solid tumor in ex vivo human slice culture model
The disparities between engineering mouse and human macrophages and the potential for IL-12R signaling highlights the importance of evaluating cancer therapeutics in the context of a human fully immune-intact tumor setting. To do this, we tested GEMs in human tumor slices from freshly resected advanced gastrointestinal malignancies which retain an intact TME and allow for longitudinal imaging and supernatant collection (figure 6A, adapted from Seo et al 34). EpCAM and activated caspase (SR-FLICA) double positive cells were quantified to measure tumor cell death in slice cultures with CD19t or hIL-12 GEMs, or rhIL-12 (figure 6B). Approximately half of the GEMs detected at day 3 remained on day 7, independent of hIL-12 secretion (online supplemental figure 6A,B). The addition of either 5 or 50 ng/mL rhIL-12 resulted in comparable tumor cell death (online supplemental figure 6C), so 5 ng/mL was used in subsequent experiments. Both rhIL-12 and hIL-12 GEMs, but not CD19t GEMs, significantly increased tumor cell death relative to untreated slice cultures (figure 6C, online supplemental figure 6D). Supernatant contained significant quantities of hIL-12 in the hIL-12 GEM group, but not the CD19t GEM or rhIL-12 groups, consistent with rapid rhIL-12 turnover (figure 6D). IFNγ increased with hIL-12 GEM treatment (figure 6E). As in figure 4, IFNγ concentrations are likely underrepresented due to cells internalizing secreted IFNγ. CXCL9 and CXCL10 supernatant levels increased with both rhIL-12 and hIL-12 GEM treatment, suggesting that hIL-12 GEMs could recruit T cells in vivo (figure 6E). Furthermore, hIL-12 GEMs induced an IFNγ-driven gene signature, including T and NK cell-recruiting chemokines (CXCL9, CXLC10 and CXCL11) 35 36 and STAT1 (figure 6F). Although tumor slices can vary significantly due to genetics, clinical history and treatment regimens, hIL-12 GEMs consistently induced IFNγ-mediated immune responses even with the removal of one patient with discordant gene expression (online supplemental figure 6E).
Supplemental material
Discussion
This study describes a GEM immunotherapy platform that locally delivers titratable doses of IL-12 to solid tumors. While the presence of macrophages in many solid tumors28 37–39 suggests that solid TMEs support long-lived macrophages, access to, infiltration of, and persistence in the solid tumor is a significant barrier for both native T cells and immunotherapies like checkpoint inhibitors and CAR T cells. Our in vivo studies demonstrate that GEMs survive in solid tumors and traffic to subcutaneous tumors. Elegant work from Klichinsky et al 40 using CAR-expressing engineered macrophages suggests that inclusion of a targeting modality could eliminate potential toxicities of systemically administered GEMs and further, could be evaluated as a method to direct GEM trafficking across the BBB. Expression of CD19t provides another safety-switch allowing for GEM elimination by antibodies, antibody-drug conjugates, or CAR T cells, as demonstrated here. GEMs can also be engineered to restrict payload expression to the TME through hypoxia-inducible promotors or chimeric receptors designed to bind proteins enriched in the TME. Given that intravenously delivered GEMs initially traffic to the lung, conditional payload expression is of particular interest for the GEM platform.
The use of IL-12 as a therapeutic payload has significant precedent. Although early IL-12 clinical trials were associated with toxicities,41 more recent trials demonstrate that locally-delivered IL-12 is well tolerated, promoting CD8+ T cell infiltration and increasing serum IFNγ.12 Indeed, recent therapeutic approaches have focused on improving targeting of IL-12 to tumors, such as the use of nanoparticles or oncolytic viruses.42 In preclinical models, tumor-targeted IL-12 combined with tumor resection decreases regulatory cells in the TME while increasing survival, intratumoral CXCL9 and IFNγ, and CD8+ T cell infiltration.43 The conserved IFNγ secretion driven by mouse and human GEMs, as well as the impact on tumor burden (in mice) or death (in human slice cultures), demonstrate that GEMs deliver their payload and stimulate antitumor immune responses. Local IL-12 production may also have efficacy in metastatic or multifocal disease.44 Furthermore, while evaluation of GEMs from in vivo conditions is necessary, our initial results suggest that IL-12 GEMs are resistant to immunosuppressive skewing.
hIL-12 GEMs could also improve existing therapies. Tumor-localized expression of IL-12 from an engineered NK cell line45 or from CAR T cells themselves enhances the antitumor effects of CAR T cells.46 47 And, although innovating CAR T cell technologies improve targeting tumors with limited antigens48 and killing of low-antigen density tumors,49 the TME promotes rapid T cell exhaustion. As this can be reduced via c-Jun overexpression in CAR T cells,50 similar modifications could also improve efficacy if delivered with hIL-12 GEMs. Additionally, as phagocytic professional antigen presenting cells, hIL-12 GEMs could present evolving antigens to T cells, potentially activating endogenous T cells. Therefore, not only is IL-12 a well-characterized proof-of-concept therapeutic payload, but secretion by GEMs in the tumor also has potential to recapitulate efficacy with more effective titration (eg, relative to rapidly expanding CAR T cells46) and fewer interventions than current local delivery approaches (eg, transient plasmid electroporation14).
Conclusion
We present a durable cellular immunotherapy platform that infiltrates solid tumors and stably delivers titratable levels of therapeutic proteins that could be used alone or coadministered with other immunotherapies to stimulate an antitumor immune response. Our GEM platform supports tailored expression of intracellular, surface, and/or secreted proteins with the potential to modulate the TME in various tumor subtypes and deliver therapeutics for other indications like autoimmune or infectious diseases.
Acknowledgments
We would like to thank Yevgeniy Yuzefpolskiy and Kenneth Brasel for providing their expertise and advice while developing the mouse GEM system. We would also like to thank Joseph Cheng and Blake Baxter for their advice on the culturing of and the analysis of T cells. We would finally like to acknowledge the NIH S10 grant (S10 OD016240) funding the Leica SP8X confocal microscope and Nathaniel Peters at the University of Washington W.M. Keck Microscopy Center for assistance with live image confocal microscopy.
References
Supplementary materials
Supplementary Data
This web only file has been produced by the BMJ Publishing Group from an electronic file supplied by the author(s) and has not been edited for content.
Footnotes
Contributors CAC conceived the idea, designed experiments, interpreted data, and provided funding and resources. KJB, CMC, SAK, KPL, NAPL, HC and KRD designed and performed experiments and analyzed and interpreted data. CIE designed and performed experiments. KWM, KSS, VJH and SDB designed experiments and interpreted data. LRM and BMP performed experiments and analyzed data. SKD assisted on slice culture experiments. JKY generated CAR T cells. ADD procured PBMCs. JSC, RHP and VGP designed experiments, interpreted data, and provided funding and resources. MCJ and ECH provided funding and resources. RGE provided resources. KJB and CAC wrote the manuscript with input from KPL, CIE, SAK, CMC, VJH, KSS, HC, ADD and JKY. All authors contributed feedback for the final manuscript.
Funding This work was supported by the Washington Research Foundation, Stand Up to Cancer, the Sarah M. Hughes Foundation, the Higgins Research Fund, and the Pediatric Brain Tumor Research Fund (all to CAC); the United States Army Medical Research Acquisition Activity (USAMRAA; CA150370P2 to VGP); and the National Institute of Neurological Disorders and Stroke, the National Institutes of Health (R25NS079200 to CIE), and the National Cancer Institute, National Institutes of Health (U54CA193461-03 and R01CA195718-02 to ECH).
Disclaimer Funders did not participate in any aspect of this work.
Competing interests The authors declare the following competing interests: CAC, KWM, NAPL and MCJ are inventors on 'Genetic Engineering of Macrophages for Immunotherapy,' Patent Number: US20170087185A1, which pertains to the development and use of GEMs as immunotherapy. CAC receives research support and is on the scientific advisory board for BlueRock Therapeutics. MCJ receives research support from Juno Therapeutics, A Bristol-Myers Squibb Company.
Patient consent for publication Not required.
Ethics approval Mice were housed and handled in accordance with Seattle Children’s Research Institute (SCRI) Institutional Animal Care and Use Committee (IACUC) protocol #15181 and Fred Hutchinson Cancer Research Center (FHCRC) IACUC protocol #50842. For collection of human tumor tissues, patients were consented under a FHCRC/University of Washington Institutional Review Board protocol #1765.
Provenance and peer review Not commissioned; externally peer reviewed.
Data availability statement Data are available in a public, open access repository. All data relevant to the study are included in the article or uploaded as online supplemental information. Source data will be made available upon direct request to the corresponding author.
Supplemental material This content has been supplied by the author(s). It has not been vetted by BMJ Publishing Group Limited (BMJ) and may not have been peer-reviewed. Any opinions or recommendations discussed are solely those of the author(s) and are not endorsed by BMJ. BMJ disclaims all liability and responsibility arising from any reliance placed on the content. Where the content includes any translated material, BMJ does not warrant the accuracy and reliability of the translations (including but not limited to local regulations, clinical guidelines, terminology, drug names and drug dosages), and is not responsible for any error and/or omissions arising from translation and adaptation or otherwise.