Article Text

Abstract
Background We present a radiomics-based model for predicting response to pembrolizumab in patients with advanced rare cancers.
Methods The study included 57 patients with advanced rare cancers who were enrolled in our phase II clinical trial of pembrolizumab. Tumor response was evaluated using Response Evaluation Criteria in Solid Tumors (RECIST) 1.1 and immune-related RECIST (irRECIST). Patients were categorized as 20 “controlled disease” (stable disease, partial response, or complete response) or 37 progressive disease). We used 3D-slicer to segment target lesions on standard-of-care, pretreatment contrast enhanced CT scans. We extracted 610 features (10 histogram-based features and 600 second-order texture features) from each volume of interest. Least absolute shrinkage and selection operator logistic regression was used to detect the most discriminatory features. Selected features were used to create a classification model, using XGBoost, for the prediction of tumor response to pembrolizumab. Leave-one-out cross-validation was performed to assess model performance.
Findings The 10 most relevant radiomics features were selected; XGBoost-based classification successfully differentiated between controlled disease (complete response, partial response, stable disease) and progressive disease with high accuracy, sensitivity, and specificity in patients assessed by RECIST (94.7%, 97.3%, and 90%, respectively; p<0.001) and in patients assessed by irRECIST (94.7%, 93.9%, and 95.8%, respectively; p<0.001). Additionally, the common features of the RECIST and irRECIST groups also highly predicted pembrolizumab response with accuracy, sensitivity, specificity, and p value of 94.7%, 97%, 90%, p<0.001% and 96%, 96%, 95%, p<0.001, respectively.
Conclusion Our radiomics-based signature identified imaging differences that predicted pembrolizumab response in patients with advanced rare cancer.
Interpretation Our radiomics-based signature identified imaging differences that predicted pembrolizumab response in patients with advanced rare cancer.
- immunotherapy
Data availability statement
Data are available upon reasonable request. The datasets used and/or analyzed during the current study are available from the corresponding author on reasonable request and approval from study sponsor according to available guidelines at time of request.
This is an open access article distributed in accordance with the Creative Commons Attribution Non Commercial (CC BY-NC 4.0) license, which permits others to distribute, remix, adapt, build upon this work non-commercially, and license their derivative works on different terms, provided the original work is properly cited, appropriate credit is given, any changes made indicated, and the use is non-commercial. See http://creativecommons.org/licenses/by-nc/4.0/.
Statistics from Altmetric.com
Introduction
Rare cancers together account for 22% of all cancer diagnoses1 and 25% of all adult cancers,2 representing a higher percentage than any single common cancer, such as lung (12.9%), breast (15.2%), and colon (8.3%) cancers.3 The prognosis of rare cancer is poor; the 5-year survival rate for these cancers is 15%–20% lower than for the more common cancers.4 Immunotherapy, in particular immune checkpoint inhibitors, has revolutionized cancer treatment.5–8 Recently our group published the first paper on immunotherapy in advanced rare cancer, where we demonstrated a 14% objective response rate in these patients as well varying rates of treatment resistance and toxicity.9 In general, the reported immunotherapy response rates has been shown to range from 13.3% to 87% depending on the type of cancer.5 10–13 To date, no single biomarker has been found to accurately predict immunotherapy response.14 Having the ability to predict treatment failure and therapeutic efficacy would enable clinicians to administer alternate therapeutics and prevent patients who are unlikely to benefit from being exposed to potentially life-threatening toxic effects of the treatment, such as encephalopathy, pneumonitis, hypophysitis, hepatitis, colitis, and pancreatitis.15 Recently some studies have been published attempting to identify immune biomarkers that can potentially predict response to immunotherapy; these include programmed death protein ligand 1 (PD-L1) expression level,6 16 immunosuppressive factors (Forkhead box P3 (FOXP3), indolamine 2,3-dioxygenase),17 interferon-gamma,18 microsatellite instability (mismatch-repair status),19 and tumor mutation burden.20 However, the more well-known of these biomarkers, such as PD-L1 expression in selected tumor types and microsatellite instability, have a low predictive value in assessing response.21 22 In addition, these biomarkers require an invasive procedure (surgery or biopsy), and they represent only a small, static “snapshot” of the entire tumor which can be very heterogeneous. Thus, there is an urgent need to develop non-invasive, robust biomarkers that account for tumor heterogeneity to identify patients who will benefit from immunotherapy.
Imaging studies are a non-invasive means of assessing immunotherapy response.23 24 However, current imaging assessment criteria, including Response Evaluation Criteria in Solid Tumors (RECIST) and immune-related RECIST (irRECIST) are used throughout treatment to assess response only longitudinally during the course of treatment.23 24 No criteria for robustly predicting immunotherapy response a priori (before receiving therapy) have yet been established.
Radiomics is a high-throughput computational method that unlocks microscale quantitative data hidden within conventional imaging25 to provide a deeper understanding of cancer biology,26 genomics,27 spatial heterogeneity,27 tumor type,28 and immune infiltration.29 Radiomics-based approaches have several advantages; it is non-invasive, and features are extracted from standard medical images, making it ideal for easier clinical translation as a non-invasive method to predict response. Further, radiomics capture the entire three-dimensional tumor landscape inclusive of spatial heterogeneity27 and allows for better evaluation of the tumor and its microenvironment.30 Radiomics has been shown to help predict immunotherapy response and outcome in multiple cancers, including melanoma,31 32 non-small cell lung cancer (NSCLC),32 33 and advanced solid tumors.29 However, to the best of our knowledge, no study has been published on radiomics biomarkers predicting immunotherapy response in advanced rare cancers.
In this study, we sought to identify a CT based radiomics texture signature that can robustly predict treatment response to immunotherapy, specifically pembrolizumab, in patients with advanced rare solid cancers. We used CT-based radiomics features to create a non-invasive predictive model for classifying 57 patients with advanced rare cancers as likely “controlled disease” or “progressive disease” to immunotherapy. To the best of our knowledge, this is the first study to predict pembrolizumab treatment response in advanced rare cancers.
Materials and methods
Study design and patient population
This retrospective study was conducted in compliance with US Health Insurance Portability and Accountability Act regulations. All patients included in the study were enrolled in our phase II clinical trial of pembrolizumab (ClinicalTrials.gov number NCT02721732) at UTMDACC between August 2016 and July 2018; the safety and efficacy outcomes for that trial were reported previously.9 Inclusion criteria for the present study were age ≥18 years; histopathologically proven rare cancer; availability of contrast-enhanced CT scans obtained prior to anti-programmed cell death protein 1 (PD-1) treatment; and absence of CT image artifacts (such as motion or streak artifacts) that would hinder imaging analysis. Written informed consent was obtained before the initiation of the clinical trial from all patients, and the patients’ clinical, radiological, and histopathological data were retrieved from the medical records.
Imaging analysis
During the clinical trial, tumor response to pembrolizumab was evaluated using both RECIST 1.1 and irRECIST. At that time, patients were categorized as either controlled disease (defined as patients demonstrating stable disease, partial response, or complete response) or progressive disease.
For the radiomics analysis, target lesions on the contrast-enhanced CT scans obtained before anti-PD-1 treatment were segmented using the 3D Slicer 4.8.1 module (http://slicer.kitware.com/midas3/item/330416). Lesion segmentation was performed and subsequently reviewed by a board-certified radiologist (R.R.C.; >10-year experience). Each target lesions were segmented slice by slice and given a color label using 3D Slicer v4.8.1. In patients who had more than one target lesion, all lesions were segmented in the same manner and given the same color label in order to predict response of target lesion tumor burden. Additional volumes of interest were segmented for within-phase normalization; the normal pectoralis major muscle was segmented for chest lesion normalization, and the normal paraspinal muscle was segmented for abdominal/pelvic lesion normalization. The contour outlines of the segmented tumors and the normal muscle were saved as an output label volume for radiomics analysis. Radiomics analysis was performed as we described previously.27 Intensity-level histogram and gray-level co-occurrence matrices (GLCMs) were used for radiomics feature extraction. In brief, a total of 10 first-order features were extracted based on Papoulis et al34 and include: minimum, maximum, mean, SD, skewness, kurtosis, and four percentiles (1%, 5%, 95%, 99%). A total of 300 GLCM second-order features were extracted based on Haralick et al,35 Clausi,36 and Soh et al,37 and include: autocorrelation, contrast, correlation, cluster shade, cluster prominence, dissimilarity, energy, entropy, homogeneity, maximum probability, variance, sum average, sum variance, sum entropy, difference variance, difference entropy, information measure of correlation 1 and 2, inverse difference moment, and normalized inverse difference moment. Each feature is calculated in four angles (angle between the voxel of interest and the in-plane neighbor) of 0°, 45°, 90°, and 135°; rotation-invariant features were calculated using average, median and range resulting in 60 rotation-invariant features. To increase the signal-to-noise ratio, original images discretized into five grey-levels (8, 16, 32, 64, and 256 grey-levels) at which we obtain the 60 rotation-invariant features. Finally, because the GLCM is not dependent on the volume of interest (VOI), we computed 300 volume-dependent second-order features by dividing each second-order feature by the volume of the segmented VOI; thus, a total of 610 radiomics features were obtained. Radiomics analysis was performed using our in-house software in matlab (version 2017b; MathWorks; Natick, Massachusetts, USA) (figure 1).
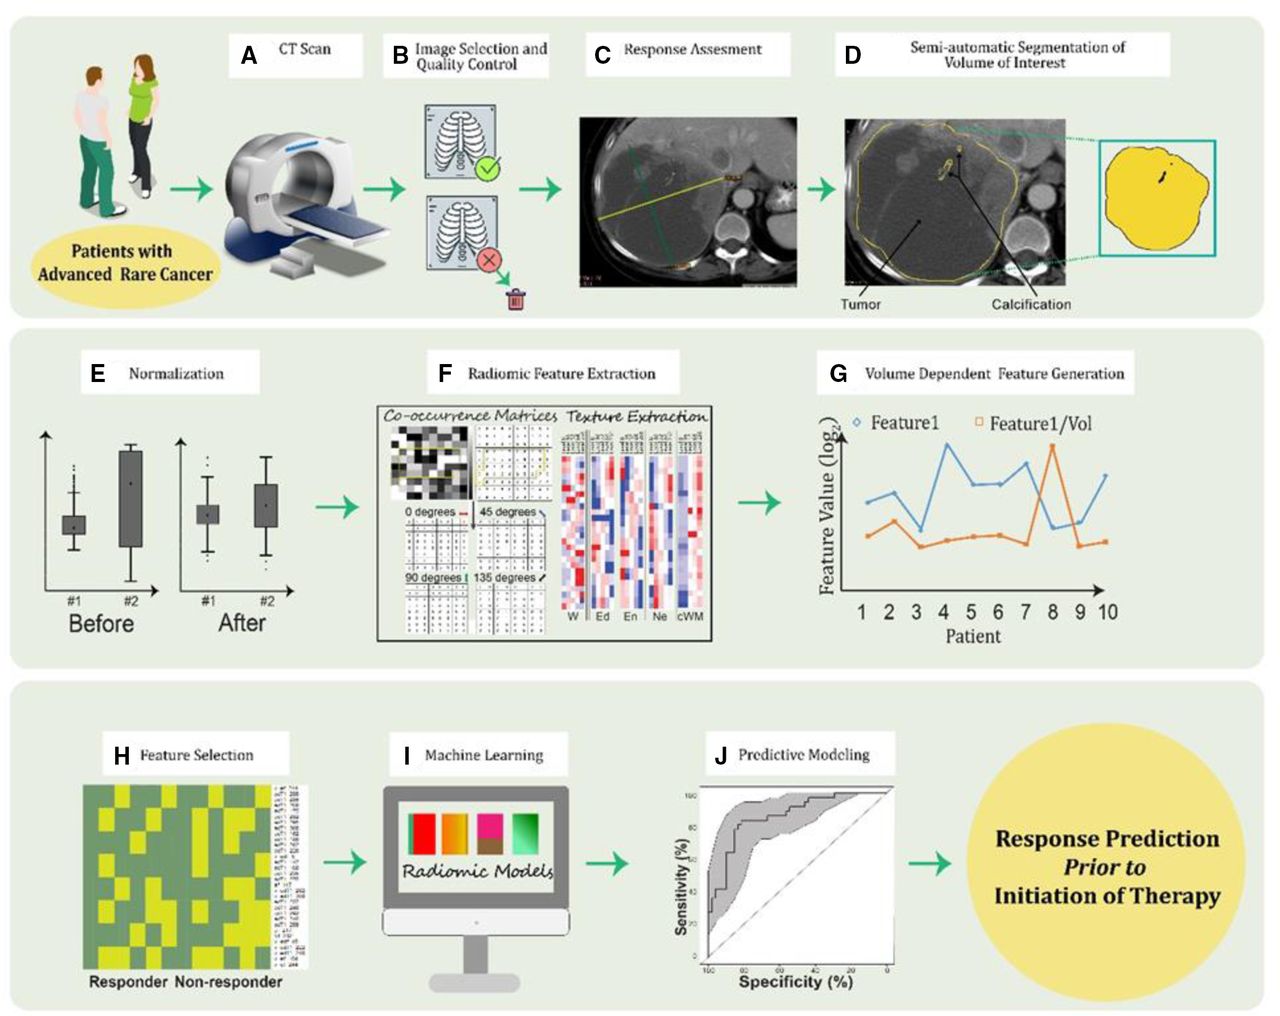
Radiomic pipeline for advanced rare tumor.
Bioinformatic analysis
Given the large multi-dimensional dataset, we used regression analysis with the least absolute shrinkage and selection operator (LASSO) feature selection method to find the most meaningful predictors of response.38 The selected features where used to build a classification model for the prediction of tumor response to pembrolizumab; with XGBoost (eXtreme Gradient Boosting) machine-learning algorithm as it offers various potential benefits such as implementing tree-boosting technique, enabling regularization (L1−L2), cross-validation, parallel computation, missing value imputation, and tree pruning.39 It is recognized as the most popular and widely used tool in many competitions held worldwide primarily due to its nature in handling the overfitting of the model through L2 or also called as ridge regularization. The tree-boosting techniques in XGBoost are implemented using gradient boosting machines through which the boosted trees are said to continuously learn from the new data that are added during the training of the model. All these attributes within the XGBoost algorithm eventually accounts for the improvement in the model’s performance and computational speed. To look for the effectiveness of the XGBoost algorithm, we built classification models with other classifiers like Support Vector Machines, Decision Trees and Random Forest, and compared the XGBoost’s model performance with the model performance from other classifiers.
Since, we had a small dataset with 57 patients, we used leave-one-out cross validation (LOOCV) method to evaluate the robustness of the estimates as the cross-validation technique for building our radiomics models. In the LOOCV process, we are holding out a single patient sample as the test sample and then fitting a model on the remaining patient samples that serves as the training test using the radiomics texture features from the LASSO feature selection. After the training, we are obtaining the prediction on the held-out patient sample or the test sample. In order that we develop our model for the future clinical implementation, we thus selected our final model to be the one that was built with least number of texture features and the one that required less computation time. Each model’s accuracy was predicted using the area under the receiver operating characteristic [ROC] curve (AUC), sensitivity, and specificity; p value was also obtained.
Additionally, we performed LASSO feature selection and LOOCV simultaneously for prediction of the response and calculated AUC, sensitivity, specificity, and p value. R software (V.3.4.0, R Foundation for Statistical Computing, Vienna, Austria) was used for all of the analysis: XGBoost package (V.0.6.4.1) and the Machine Learning package mlr (V.2.11) were used for feature selection and model building and finally, ROC analysis was performed using pROC package (V.1.9.1).
Univariate and multivariate analysis
Shapiro-Wilk’s test was applied to analyze the distribution of the continuous variables (top 10 LASSO features from RECIST radiomics model, top 10 LASSO features from irRECIST radiomics model and age) before deciding the appropriate test for univariate and multivariate analysis.
For multivariate analysis, multivariate ANOVA test was performed on 57 patients by considering all the top 10 LASSO features collectively from the RECIST and irRECIST models to see if there are any statistically significant differences between the patient’s groups in terms of clinical variables (gender, race, and number of prior therapies).
Univariate analysis was performed to assess the differences between the clinical covariates for the features used in radiomics models. One-way ANOVA test was used for clinical variables (ie, gender, race, number of prior therapies), and Pearson correlation coefficient was performed for the continuous variable (age).
Additionally, Welch two sample t-test was applied to analyze if the radiomics features used for model generation were independently associated with the treatment response.
Univariate and multivariate analysis with overall survival and radiomics texture features
A univariate analysis was performed using univariate Cox regression model to assess the significant difference and independent association of each of the 10 radiomics texture features that were used in our predictive RECIST and irRECIST models with overall survival (OS). The OS for the 57 patients were calculated in months and the OS status (0=alive and 1=deceased) was assigned for each patient. The radiomics texture features that were significant from the univariate Cox regression model were later used for constructing a multivariate Cox regression model to predict the OS outcome. Further, we categorized the 10 radiomics texture features from the RECIST and irRECIST models into high versus low groups using their median as the cut-off. Using the univariate Kaplan-Meier curves and the log-rank test, we analyzed for the association between high versus low groups of each radiomics texture feature with OS.
Results
Patient population
Of the 127 patients with advanced rare cancers enrolled in the pembrolizumab clinical trial, 70 patients were excluded; contrast-enhanced CT scans obtained prior to anti-PD-1 treatment was not available for 48 patients and 22 patients had CT image artifacts that would hinder imaging analysis. Fifty-seven patients met the inclusion criteria for the present study. Their demographic data are outlined in table 1. A total of 37 patients were classified as controlled disease and 20 patients as progressive disease per evaluation by RECIST. Similarly, 33 patients were classified as progressive disease and 24 patients as controlled disease per evaluation by irRECIST. Patients’ responses based on RECIST and irRECIST by cancer type are given in table 2.
Patients’ demographic characteristics (N=57)
Pembrolizumab response status based on RECIST and irRECIST for 57 patients with rare cancers
Radiomics predicts response
A total of 610 features (10 histogram-based features and 600 second-order texture features) were calculated from each extracted VOI. Among these 610 radiomics features, LASSO feature selection identified 44 features that were most discriminatory between the response outcomes in patients assessed by RECIST (table 2). Of these 44 selected features, the most relevant, most significant 10 features (table 3) robustly discriminated controlled disease and progressive disease using a classification model based on the XGBoost machine-learning method. LOOCV demonstrated that our radiomics model had high accuracy, sensitivity, and specificity (94.7%, 97.3%, and 90%, respectively; p<0.001) (figure 2A). When patients were grouped according to irRECIST (table 2), LASSO feature selection identified 56 features. XGBoost classification model using the 10 top discriminatory features (table 4) predicted controlled disease and progressive disease with robust accuracy, sensitivity, and specificity (94.7%, 93%, and 95%, respectively; p<0.001) (figure 2B).
Top 10 features (from 44 features extracted in patients assessed by Response Evaluation Criteria in Solid Tumors)

(A) Receiver operating characteristic (ROC) curve representing the performance of the predictive model when using the top 10 least absolute shrinkage and selection operator (LASSO) features in the Response Evaluation Criteria in Solid Tumors (RECIST) group. (B) ROC curve representing the performance of the predictive model when using the top 10 LASSO features in the immune-related RECIST group.
Top 10 features (from 56 features extracted in patients assessed by immune-related Response Evaluation Criteria in Solid Tumors)
Fifteen features were common to both the group of 44 discriminatory features for patients assessed by RECIST and the group of 56 discriminatory features for patients assessed by irRECIST (figure 3B, table 5). The predictive model generated with these 15 features, effectively discriminated between controlled disease and progressive disease and achieved high accuracy, sensitivity, and specificity in patients assessed by RECIST (94.7%, 97%, and 90%, respectively; p<0.001) and those assessed by irRECIST (96%, 96%, and 95%, respectively; p<0.001) (figure 3A,C).

(A) Receiver operating characteristic (ROC) curve representing the performance of the predictive model when using the common 15 least absolute shrinkage and selection operator (LASSO) features in the Response Evaluation Criteria in Solid Tumors (RECIST) group. (B) Fifteen common LASSO features between 44 features and 56 features obtained from 57 patients assessed by RECIST and immune-related RECIST (irRECIST), respectively. (C) ROC curve representing the performance of the predictive model when using the common 15 LASSO features in the irRECIST group.
Shared 15 features (between features obtained from patients assessed by Response Evaluation Criteria in Solid Tumors (RECIST) and immune-related RECIST)
In the radiomics analysis with LASSO and LOOCV performed concurrently, we achieved an accuracy, sensitivity, and specificity in patients assessed by RECIST (89.7%, 70%, and 100%, respectively; p<0.001) and those assessed by irRECIST (87.7%, 87.5%, and 87.8%, respectively; p<0.001) (online supplemental figure S1A,B, respectively).
Supplemental material
Online supplemental table 1 shows the accuracy, sensitivity, specificity, AUC, and p value for the models generated by using other classifiers (support vector machines, decision tree, and random forest) to predict treatment response based on RECIST and irRECIST.
Univariate and multivariate analysis
Shapiro-Wilk’s test demonstrated that 10 lasso features from RECIST and irRECIST model are normally distributed whereas the age is not normally distributed (online supplemental table 2).
Multivariate analysis determined that all the top 10 LASSO features (collectively) from the RECIST model does not account for any statistically significant (p value <0.05) differences between the patient groups with regard to number of prior therapies, race, and gender (online supplemental table 3A). Multivariate analysis showed that all the top 10 LASSO features (collectively) from the irRECIST model does not account for any statistically significant (p value <0.05) differences between the patient groups in terms of number of prior therapies and race however; these features account for statistically significant difference between men and women as demonstrated in online supplemental table 3B.
Univariate analysis over clinical variables versus discriminatory 10 radiomics features (from 44 features extracted in patients assessed by RECIST) that used for radiomics model showed that there are no statistically significant differences with respect to the clinical variables (p value <0.05). However, for the features; range of cluster prominence (P_F 84) and range of sum average (Ar_F152), one-way ANOVA test showed that these features are statistically significant in terms of the gender (online supplemental table 4A). Similarly, there are no significant differences between the meaningful 10 radiomics features (from 56 features extracted in patients assessed by irRECIST) that used for radiomics model with respect to the clinical variables (p value <0.05). Except, for the range of sum average (Ar_F152 feature), ANOVA test demonstrated that this feature is statistically significant in the sense of the gender (online supplemental table 4B).
Welch two sample t-test showed that 5 out of the 10 LASSO features from RECIST model (P_F269, P_F289, PV_F35, PV_F89, and PV_F109) and 4 out of the 10 LASSO features from irRECIST model (P_F89, P_F269, P_F289, and PV_F81) are statistically significant (p value <0.05) and are independently associated with treatment response (p value <0.05) as shown in online supplemental table 5.
Univariate and multivariate analysis with OS and radiomics texture features
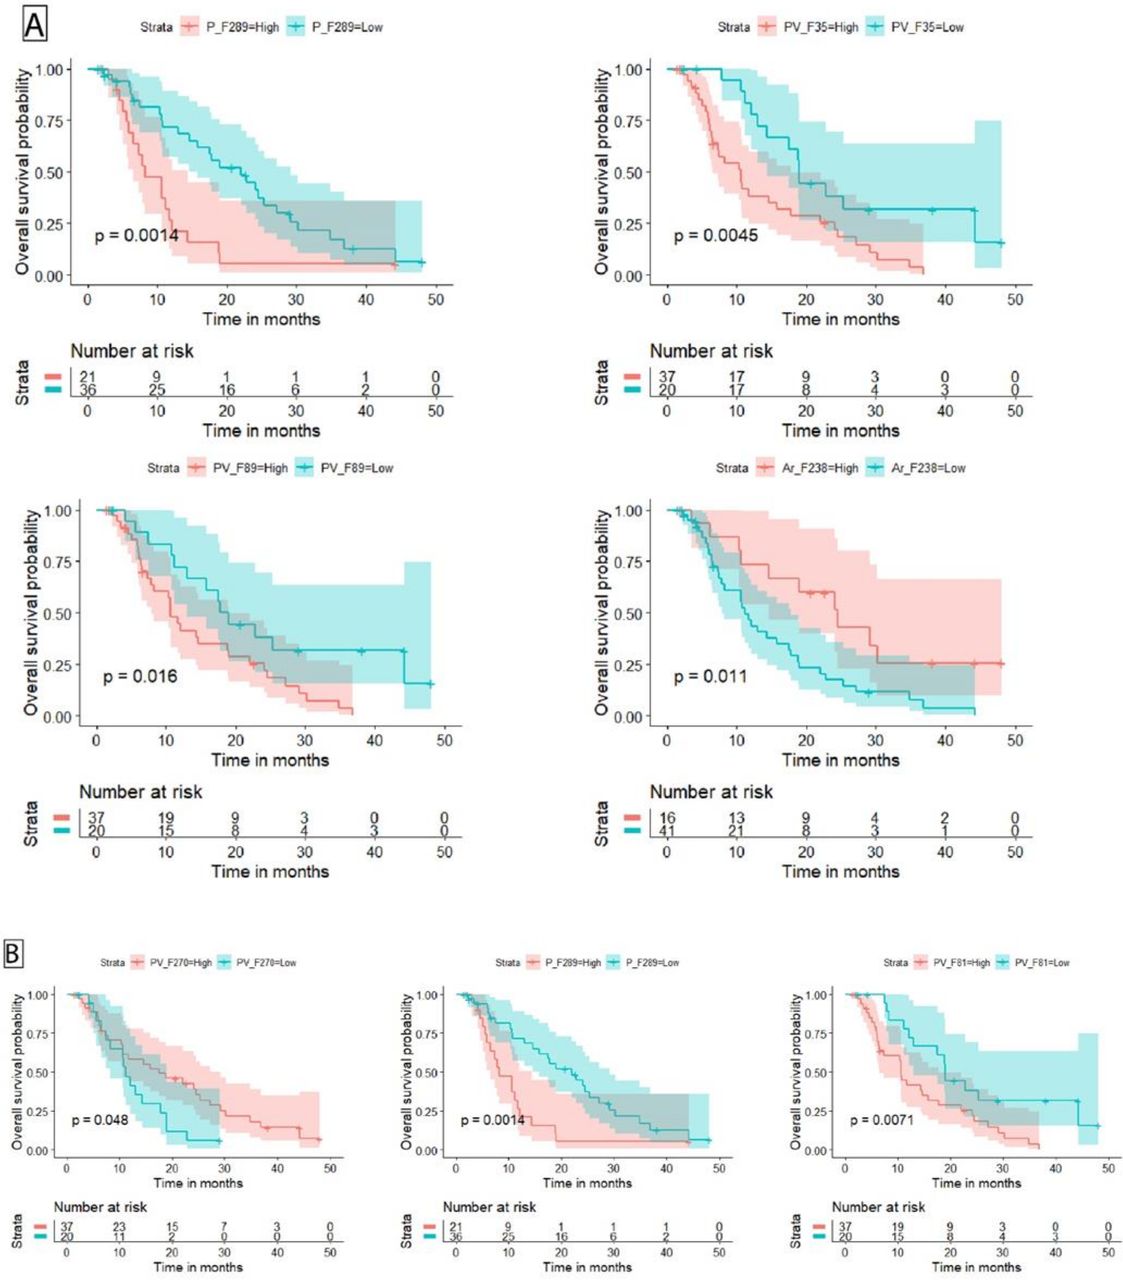
Of the 57 patients, 13 patients were identified to be alive and 44 patients were deceased. The univariate Cox regression models built by 10 radiomics texture features from RECIST model with OS had identified 6 out of 10 texture features to have significant association with OS as shown in online supplemental table 6. The p value for all three overall tests (likelihood (p value=0.001), Wald (p value=0.03), and score (p value=0.02)) from the multivariate Cox regression model are significant, indicating that the multivariate Cox regression model created with the six significant radiomics texture features from RECIST model with OS was significant, as shown in online supplemental table 7. From the multivariate Cox analysis as shown in online supplemental table 7, the texture feature PV_F35 remain significant (p value=0.0493). The univariate log-rank test for the high versus low groups of the 10 radiomics texture features from RECIST model with OS showed that, 4 out of 10 texture features; P_F289 (p value=0.0014), PV_F35 (p value=0.0045), PV_F89 (p value=0.016), and Ar_F238 (p value=0.011) were found to be significantly associated with high versus low groups texture feature with OS, as shown in online supplemental table 8. The Kaplan-Meier survival curves and p values from the log-rank test for the four significant radiomics texture features from RECIST can be seen in figure 4A.

(A) The Kaplan-Meier curves for overall survival (OS) with radiomic texture features from Response Evaluation Criteria in Solid Tumors (RECIST) model. (B) The Kaplan-Meier curves for OS with radiomic texture features from immune-related RECIST model.
The univariate Cox regression models generated by 10 radiomics texture features from irRECIST model with OS had determined 5 out of 10 texture features to have significant association with OS; as demonstrated in online supplemental table 9. The p value for all three overall tests (likelihood (p value=8e-05), Wald (p value=0.04), and score (p value=6e-04)) from the multivariate Cox regression model are significant, indicating that the multivariate Cox regression model built using the five significant radiomics texture features from irRECIST model with OS was significant, as detailed in online supplemental table 10. From the multivariate Cox analysis as shown in online supplemental table 10, two of the texture features; PV_F81 (p value 0.00696) and ArV_F36 (p value=0.02417) remain significant. The univariate log-rank test for the high versus low groups of the 10 radiomics texture features from irRECIST model with OS showed that, 3 out of 10 texture features; P_F289 (p value=0.0014), PV_F81 (p value=0.0071), and PV_F270 (p value=0.048) were found to be significantly associated with high versus low groups texture feature with OS, as shown in online supplemental table 11. The Kaplan-Meier survival curves and p values from the log-rank test for the three significant radiomics texture features from irRECIST can be seen in figure 4B.
Discussion
The results of our study demonstrate that quantitative radiomics texture analysis on standard-of-care CT scans obtained prior to the initiation of therapy can successfully predict pembrolizumab response. To our knowledge, this is the first study to use a radiomics-based approach to predict immunotherapy response in patients with advanced rare solid cancers. Radiomic signatures based on top 10 LASSO-selected features predicted immunotherapy response with high accuracy, sensitivity, and specificity in patients assessed by RECIST (94.7%, 97.3%, and 90%, respectively) and in patients assessed by irRECIST (94.7%, 93.9%, and 95.8%, respectively). Furthermore, the shared features of the RECIST and irRECIST groups also highly predicted pembrolizumab response with the accuracy, sensitivity, specificity, and p value of 94.7%, 97%, 90%, p<0.001and 96%, 96%, 95%, p<0.001, respectively.
The future clinical use of our radiomics-based approach to predict immunotherapy response is supported by previous studies in patients with other diseases.29 32 40 Sun et al29 generated a radiomics-based treatment response prediction model using machine learning. They found that their baseline radiomics score was able to predict CD8 gene expression. Patients with higher radiomics score had higher CD8 gene expression and better response to immunotherapy compared with patients with progressive disease or stable disease (p=0.049); the baseline radiomic score however, was not significantly higher in the patients with controlled disease (stable disease, partial response, complete response) compared with patients with progressive disease (p=0.05). However, that latter study was for the most part correlative and the sensitivity, specificity, and accuracy of their radiomic model was not reported. In another retrospective study, Mu et al40 described a multi-parametric radiomic signature based on positron emission tomography (PET)/CT images to predict durable clinical benefit of immunotherapy response in patients with advanced NSCLC (AUC ranging from 0.81 to 0.86). They found that compared with that of the multi-parametric radiomics signature, the AUCs of the CT-only-based features used to predict response were lower (AUCs ranging from 0.64 to 0.69). These AUCs are also lower compared with our study (0.95 and 0.99 in the irRECIST and RECIST groups, respectively), likely because the CT images used from PET/CT studies have lower resolution than the diagnostic CT studies as used in the present study and were non-contrast enhanced CTs.
Finally, Trebeschi et al,32 looked at radiomics to assess immunotherapy response (rule out progression) in patients with NSCLC and melanoma. The model was able to predict progressive disease in NSCLC primary tumor with an AUC of 0.79 and p=0.05. But, their radiomics based prediction model achieved poor performance on both pulmonary and hepatic melanoma lesions (AUC of 0.55). The authors did not report the sensitivity and specificity of the models. These results are consistent with our study in terms of highlighting the potential of CT-based radiomics features in predicting response to immunotherapy. In our cohort, we assessed immunotherapy response by analyzing each patient’s entire (whole body) tumor burden. That was achieved by segmentation of all target lesions (defined by RECIST 1.1 and irRECIST) and further extraction of distinct radiomics features as illustrated in online supplemental figures S2-4. The high accuracy of our model for classifying controlled disease and progressive disease in the RECIST and irRECIST based groups suggests that radiomics analysis has a potential role in making clinical decisions and in selecting patients who would likely benefit from therapy prior to the initiation of such treatment. Additionally, the radiomics approach is cost and time-effective, as it uses standard-of-care images that are already being obtained for diagnosis and follow-up.
The present study had some inherent limitations. The rare cancer study had a heterogeneous patient population with biologically different diseases. However, despite the latter, our radiomics model was highly predictive of patient response to anti-PD-1 therapy. In addition, given the nature of the clinical trial study, the sample size was relatively small. Finally, although promising, our single- institution cohort was retrospectively evaluated; therefore, validation is required, preferably prospectively with a larger data set acquired from multiple institutions. These validation studies using a larger prospective data set in a multi-institutional patient population are currently underway at our institution to ensure reliability and generalizability of our model.
In summary, this study presents radiomics-based signature that can successfully predict immunotherapy response in patients with advanced rare cancers. The proposed predictive radiomics-based signature is cost-effective, non-invasive and can potentially play a significant role in the clinical setting, allowing oncologists to predict treatment response a priori and enable better patient stratification, management, and clinical decision-making. Although our predictive models had high accuracy in retrospectively discriminating controlled disease and progressive disease to pembrolizumab, prospective studies on a larger data set in a more homogeneous patient population are needed to ensure its reliability and generalizability.
Data availability statement
Data are available upon reasonable request. The datasets used and/or analyzed during the current study are available from the corresponding author on reasonable request and approval from study sponsor according to available guidelines at time of request.
Ethics statements
Ethics approval
The protocol was approved by the FDA and the Institutional Review Board at The University of Texas MD Anderson Cancer Center. The study was conducted in accordance with the Declaration of Helsinki and the International Conference on Harmonization Good Clinical Practice guidelines. All the study participants provided written informed consent before enrollment.
Acknowledgments
Sunita Patterson and Joseph Munch, Department of Scientific Publications at MD Anderson, provided editorial assistance. We thank the patients and their families and caregivers for participating in the study.
References
Supplementary materials
Supplementary Data
This web only file has been produced by the BMJ Publishing Group from an electronic file supplied by the author(s) and has not been edited for content.
Footnotes
Twitter @naelshafeey@mdanderson.org, @AnaingMD
Contributors RRC contributed to conception and design, provision of study materials or patients, collection and assembly of data, data analysis and interpretation, manuscript writing, final approval of manuscript, and is accountable for all aspects of the work. CR contributed to conception and design, provision of study materials or patients, collection and assembly of data, data analysis and interpretation, manuscript writing, final approval of manuscript, and is accountable for all aspects of the work. MAk contributed to manuscript writing, final approval of manuscript, and is accountable for all aspects of the work. MAyoub contributed to manuscript writing, final approval of manuscript, and is accountable for all aspects of the work. SA contributed to manuscript writing, final approval of manuscript, and is accountable for all aspects of the work. NE contributed to manuscript writing, final approval of manuscript, and is accountable for all aspects of the work. PM contributed to manuscript writing, final approval of manuscript, and is accountable for all aspects of the work. POZ contributed to manuscript writing, final approval of manuscript, and is accountable for all aspects of the work. CN contributed to manuscript writing, final approval of manuscript, and is accountable for all aspects of the work. RV contributed to manuscript writing, final approval of manuscript, and is accountable for all aspects of the work. SB contributed to manuscript writing, final approval of manuscript, and is accountable for all aspects of the work. CP contributed to manuscript writing, final approval of manuscript, and is accountable for all aspects of the work. JRA contributed to manuscript writing, final approval of manuscript, and is accountable for all aspects of the work. VS contributed to manuscript writing, final approval of manuscript, and is accountable for all aspects of the work. DDK contributed to manuscript writing, final approval of manuscript, and is accountable for all aspects of the work. BS contributed to manuscript writing, final approval of manuscript, and is accountable for all aspects of the work. JH contributed to manuscript writing, final approval of manuscript, and is accountable for all aspects of the work. AN contributed to conception and design, provision of study materials or patients, collection and assembly of data, data analysis and interpretation, manuscript writing, final approval of manuscript, and is accountable for all aspects of the work.
Funding Merck Sharp & Dohme Corp., a subsidiary of Merck & Co. provided the study drug and funded the study. This research was funded in part by startup funding from The University of Pittsburgh Hillman Cancer Center (RRC) and the Hillman Cancer Center’s NCI Cancer Center Support Grant (CCSG) P30CA047904 (RRC). Support was also provided by the National Institutes of Health/National Cancer Institute under award number P30CA016672 to The University of Texas MD Anderson Cancer Center (used the Biostatistics Resource Group) and The University of Texas MD Anderson Cancer Center Institutional Research Grant (IRG) program.
Competing interests CN reports grant support and personal fees from General Electric Healthcare, outside the submitted work. SB reports grant support from National Institutes of Health, outside the submitted work. JRA reports personal fees from Novartis, Eli Lilly, Orion Pharmaceuticals, Servier Pharma, Peptomyc, and Merck Sharpe, on the advisory board for Novartis, Eli Lilly, Orion Pharmaceuticals, Servier Pharma, Peptomyc, Merck Sharpe & Dome, Kelun Pharma/Klus Pharma, Pfizer, Roche Pharma, and Elipses Pharma, research funding from Bayer, Novartis, Spectrum Pharmaceuticals, Tocagen, Symphogen, BioAtla, Pfizer, GenMab, CytomX, KELUN-BIOTECH, Takeda-Millenium, GLAXOSMITHKLINE, Ipsen, from null, outside the submitted work. VS reports clinical trial research funding from Novartis, Bayer, GlaxoSmithKline, Nanocarrier, Vegenics, Celgene, Northwest Biotherapeutics, Berghealth, Incyte, Fujifilm, Pharmamar, D3, Pfizer, Multivir, Amgen, Abbvie, Alfa-sigma, Agensys, Boston Biomedical, Idera Pharma, Inhibrx, Exelixis, Blueprint medicines, Loxo oncology, Takeda and Roche/ Genentech, National Comprehensive Cancer Network, NCI-CTEP and UT MD Anderson Cancer Center, outside the submitted work. JH reports grants from Immune Deficiency Foundation, Jeffery Modell Foundatoin and Chao Physician-Scientist, and Baxalta, and has served as an advisory board member for Takeda, CSL Behring, and Horizn Pharma outside the submitted work. AN reports research support and non-financial support from Merck Sharp & Dohme Corp., grants from NCI/NIH, research support from The University of Texas MD Anderson Cancer Center, during the conduct of the study; grants from NCI, research support from EMD Serono, MedImmune, Healios Onc. Nutrition, Atterocor, Amplimmune, ARMO BioSciences, Karyopharm Therapeutics, Incyte, Novartis, Regeneron, Merck, Bristol Myers Squibb, Pfizer, CytomX Therapeutics, Neon Therapeutics, Calithera BioSciences, TopAlliance BioSciences, Eli Lilly, Kymab, PsiOxus, Arcus Biosciences, NeoImmuneTech, ImmuneOncia, and Surface Oncology, non-financial support for travel and accommodation from ARMO BioSciences, and has served as an advisory board member for Novartis, CytomX Therapeutics, Genome and Company, STCube Pharmaceuticals, OncoSec KEYNOTE-695, and Kymab outside the submitted work. RRC, CR, MAk, MAyoub, SA, NE, PM, POZ, RV, CP, BS, DDK declare no competing interests.
Provenance and peer review Not commissioned; externally peer reviewed.
Supplemental material This content has been supplied by the author(s). It has not been vetted by BMJ Publishing Group Limited (BMJ) and may not have been peer-reviewed. Any opinions or recommendations discussed are solely those of the author(s) and are not endorsed by BMJ. BMJ disclaims all liability and responsibility arising from any reliance placed on the content. Where the content includes any translated material, BMJ does not warrant the accuracy and reliability of the translations (including but not limited to local regulations, clinical guidelines, terminology, drug names and drug dosages), and is not responsible for any error and/or omissions arising from translation and adaptation or otherwise.