Article Text

Abstract
Background Statins preferentially promote tumor-specific apoptosis by depleting isoprenoid such as farnesyl pyrophosphate and geranylgeranyl pyrophosphate. However, statins have not yet been approved for clinical cancer treatment due, in part, to poor understanding of molecular determinants on statin sensitivity. Here, we investigated the potential of statins to elicit enhanced immunogenicity of KRAS-mutant (KRASmut) tumors.
Methods The immunogenicity of treated cancer cells was determined by western blot, flow cytometry and confocal microscopy. The immunotherapeutic efficacy of mono or combination therapy using statin was assessed in KRASmut tumor models, including syngeneic colorectal cancer and genetically engineered lung and pancreatic tumors. Using NanoString analysis, we analyzed how statin influenced the gene signatures associated with the antigen presentation of dendritic cells in vivo and evaluated whether statin could induce CD8+ T-cell immunity. Multiplex immunohistochemistry was performed to better understand the complicated tumor-immune microenvironment.
Results Statin-mediated inhibition of KRAS prenylation provoked severe endoplasmic reticulum (ER) stress by attenuating the anti-ER stress effect of KRAS mutation, thereby resulting in the immunogenic cell death (ICD) of KRASmut cancer cells. Moreover, statin-mediated ICD enhanced the cross-priming ability of dendritic cells, thereby provoking CD8+ T-cell immune responses against KRASmut tumors. Combination therapy using statin and oxaliplatin, an ICD inducer, significantly enhanced the immunogenicity of KRASmut tumors and promoted tumor-specific immunity in syngeneic and genetically engineered KRASmut tumor models. Along with immune-checkpoint inhibitors, the abovementioned combination therapy overcame resistance to PD-1 blockade therapies, improving the survival rate of KRASmut tumor models.
Conclusions Our findings suggest that KRAS mutation could be a molecular target for statins to elicit potent tumor-specific immunity.
- immunotherapy
- dendritic cells
- antigen presentation
- CD8-positive T-lymphocytes
- drug therapy
- combination
Data availability statement
All data relevant to the study are included in the article or uploaded as supplementary information. The datasets used and/or analyzed during the current study are available from the corresponding author on reasonable request.
This is an open access article distributed in accordance with the Creative Commons Attribution Non Commercial (CC BY-NC 4.0) license, which permits others to distribute, remix, adapt, build upon this work non-commercially, and license their derivative works on different terms, provided the original work is properly cited, appropriate credit is given, any changes made indicated, and the use is non-commercial. See http://creativecommons.org/licenses/by-nc/4.0/.
Statistics from Altmetric.com
Background
Statin is the 3-hydroxy-3-methylglutaryl (HMG) coenzyme A reductase inhibitor of the mevalonate pathway instrumental in producing isoprenoid, coenzyme Q, dolichols, and cholesterol.1 Although the initial drug discovery of statins was carried out with no thought of cancer therapeutics, several studies have demonstrated that statins provoked effective tumor-specific apoptosis.1 One of the mechanisms of the antitumor effect of statin is that it extensively inhibits diverse post-translational prenylation of oncoproteins highly expressed in tumors, exhibiting proapoptotic effects in tumor cells compared with normal cells.2 3 It was found that statin-induced apoptosis was rescued by exogenous isoprenoid such as farnesyl pyrophosphate and geranylgeranyl pyrophosphate (FPP and GGPP) responsible for protein prenylation termed farnesylation and geranylation, respectively.4 Statins are clinically approved and available as generic drugs, providing immediate and affordable opportunities to incorporate cancer treatments. Despite these advantages, statins are not used to treat cancer patients because it is still ambiguous as to which molecular subtype of cancer determines the sensitivity to statins.
The KRAS (Kirsten rat sarcoma 2 viral oncogene homolog) protein, one of the oncoproteins that can be affected by statin, is closely associated with malignant tumors, and treatments for KRAS-mutant (KRASmut) tumors remain challenging.5 Since protein prenylation anchors the KRAS proteins on the cell membrane, enabling them to initiate downstream signaling, statins have the potential to be a promising therapeutic option for KRASmut tumors.5 However, statin sensitivity on KRASmut tumor cell death is still controversial. For example, while some reports demonstrated that statin exhibited enhanced cytotoxicity in tumor cells with activated RAS,6 7 other studies have found that induction of tumor cell apoptosis by statins is independent of RAS activity.8 9 Understanding the causes of these discrepancies is certainly important, but fundamentally, it is also necessary to consider whether an evaluation of in vitro tumor cell apoptosis is an appropriate means of determining statin sensitivity. Considering that in vivo antitumor effect greatly depends on whether cancer cell death is immunogenic or tolerogenic,10 an assessment of immunogenicity in statin treated-tumor cells may be needed to find a proper determinant of statin sensitivity.
Accumulating reports suggest that some therapies that cause severe endoplasmic reticulum (ER) stress can elicit immunogenic cell death (ICD), while many other therapies do not.10 Cancer cells undergoing ICD express or release danger-associated molecular pattern signals such as calreticulin (CRT), high-mobility group box 1 (HMGB1), ATP, and heat-shock protein 70 (HSP70), thereby promoting the functions of antigen-presenting cells (APCs) as well as activating tumor-specific T-cell immunity.10 Interestingly, it was demonstrated that statin significantly reduced coenzyme Q, causing severe oxidative stress in tumor cells.11 Furthermore, RAS signaling in human cancer cells acts as a negative regulator of ER stress,12 highlighting that inhibition of RAS prenylation by statin might elicit ER stress in KRASmut tumor cells. Likewise, a first-in-class oral KRASG12C inhibitor enhanced immunogenicity of KRAS mutated tumors, leading to a remarkable infiltration of antitumor immune cells.13 This evidence led us to hypothesize that statin could increase the immunogenicity of KRASmut cancer cells through severe ER stress, resulting in the activation of APC-mediated T-cell immunity.
Herein, we assessed the potential immunological effects of statin on KRASmut tumors. Using NanoString analysis, we analyzed how statin influenced the gene signatures associated with the antigen presentation of dendritic cells (DCs) in vivo and evaluated whether statin could induce CD8+ T-cell immunity. We further determined the immunotherapeutic efficacy of a combination therapy of statins and chemotherapeutic drugs in several KRASmut tumor models, including syngeneic colorectal cancer (CRC) and genetically engineered lung and pancreatic tumors. Then, we evaluated whether this combination therapy enhances immune checkpoint blockade (ICB) therapy against tumors showing resistance to PD-1 blockade. Our findings suggest the potential of a novel therapeutic strategy utilizing statins as treatment for KRAS mutation in tumors.
Methods
Cells
The CT26, HCT116, HT29, Colo205, SW48, RKO, SW480, SW620, LS513, LS1034, SW1116, LoVo, and LS174T cell lines were obtained from the American Type Culture Collection, whereas Calu-1 and H23 cell lines were purchased from the Korean Cell Line Bank. MC38 cell lines were obtained from Kerafast. RKO, MC38, and LS174T cell lines were cultured in DMEM-high glucose (Hyclone) supplemented with 10% fetal bovine serum (FBS, Gibco) and 1% antibiotics–antimycotics (Gibco). CT26, HCT116, HT29, Colo205, SW48, SW480, SW620, LS513, LS1034, SW1116, LoVo, Calu-1, and H23 cell lines were cultured in RPMI-1640 (Welgene) medium supplemented with 10% FBS (Gibco) and 1% antibiotics–antimycotics (Gibco). Patient-derived cancer cells (PDCs) were established, and the genetic identification and culture method were described previously.14 15 Bone marrow-derived macrophages or dendritic cells (BMDMs or BMDCs) differentiation method and cell viability and apoptosis analysis method were described in detail in the online supplemental material.
Supplemental material
Reagents
The Active Ras Pull-Down and Detection Kit (16117) was purchased from ThermoFisher Scientific. The negative control DsiRNA (51-01-14-03) and the siRNA targeting murine KRAS were obtained from Integrated DNA technologies. The sequences of the siRNA targeting murine KRAS were 5′-GUGCAAUGAGGGACCAGUA-3′ (sense), and its complementary anti-sense 5′-UACUGGUCCCUCAUUGCAC-3′. The transfections were conducted using Lipofectamine RNAiMAX transfection reagent (ThermoFisher) in accordance with the manufacturer’s protocol. The used antibody information was described in detail in the online supplemental material.
Analysis of immunogenicity of tumor cells
To evaluate the in vitro CRT expression, CT26 tumor cells were treated with simvastatin (10 µM) for 4 or 24 hours or KRAS siRNA (100 nM) for 24 hours. Calu-1 and H23 tumor cells were treated with simvastatin (10 µM) or AMG-510 (10 µM, HY-114277) for 24 hours. In the case of combination treatment, CT26 cancer cells are treated with simvastatin (1 µM); after 12 hours, oxaliplatin (300 µM) is added and then left for 12 hours. To evaluate the in vivo CRT expression, tumors from tumor-bearing mice treated with simvastatin were isolated and dissociated into single cells using a Tumor Dissociation Kit (Miltenyi Biotech). The tumor cells were collected by excluding the immune cells, endothelial cells, and fibroblasts using CD45 (130-052-301), CD31 (130-097-418), and CD90.2 microbeads (130-121-278). The detailed CRT staining protocol was described in the online supplemental material. To assess the release of HMGB1 and HSP70 from cancer cells, CT26 tumor cells were treated with simvastatin (10 µM) for 24 hours, and western blot was performed to detect HMGB1 and HSP70 in collected supernatant.
Phagocytosis assay
BMDMs were stained with green 5-chloromethylfluorescein diacetate (CMFDA) (1 µM, C2925) for 25 min at room temperature 24 hours before coculture with CT26 cells, whereas the BMDCs were stained similarly on the day of coculture. CT26 cells were treated with simvastain (10 µM) and/or FPP (13058-04-3, 5 µM) or GGPP (G6025, 5 µM) for 4 hours. Treated CT26 cells were stained with pHrodo Red, succinimidyl ester (pHrodo-SE) (P36600, 120 ng/mL) for 30 min and added to the BMDMs or BMDCs for 1 hour at a ratio of 1:2. The medium was refreshed with pH 10 phosphate-buffered saline. At least seven images per sample were randomly taken and analyzed under a fluorescence microscope (Nikon). Phagocytosis (%) was calculated by the following formula; the number of phagocytosed cancer cells (red)/total number of BMDMs or BMDCs (green) × 100.
Animals
Male C57BL/6 mice and BALB/c (6–8 weeks old) were purchased from OrientBio, whereas the B6.129-Krastm3Bbd/J mice were purchased from the Jackson Laboratory. The Pdx1-Cre Ink4a/Arflox/+and LSL-KrasG12D Ink4a/Arflox/lox mice were kindly provided by Dr ANCA (INSERM, France). These mice were intercrossed to generate the KIC (p48Cre;LSL-KrasG12D;Cdkn2af/f) mice.16 All mice were maintained in a pathogen-free room at the Korea Institute of Science and Technology (KIST). We performed all animal studies under the Institutional Animal Care and Use Committee (IACUC) guidelines of the KIST. The method of in vivo tumor model experiments and flow cytometry analysis were described in detail in the online supplemental material.
Nanostring nCounter mouse myeloid innate immunity gene expression analysis
DCs were sorted from tumors of CT26 or MC38 tumor-bearing mice via CD11c microbeads (130-125-835). The QIAZOL reagent (Qiagen Ltd) was used to extract the total RNA from DCs. The quantification of samples was assessed by Qubit Fluorimetric Quantitation (Thermo Scientific) and Nanodrop (Thermo Scientific). To analyze the gene expression profiles of six samples, the NanoString nCounter System was used by evaluating 100 ng total RNA from the sample with nCounter mouse myeloid innate immunity panel (LBL-10 398-02), which is optimized for evaluation of genes representing the overall myeloid innate immunity pathways. The correction of background was done by subtracting the geometric mean of eight negative-control probes. The values of gene expression were normalized with six positive-control probes and 32 housekeeping genes by the nSolver program, followed by log2-transformation and standardization within each sample. The fold changes and p values were displayed via volcano plots.
Cross-priming assay
DCs were extracted from the TDLNs of CT26 or MC38 tumor-bearing mice with CD11c microbeads (130-125-835). CD8+ T cells were sorted from the spleen of control mice by using the CD8α+ T-Cell Isolation Kit (130-104-075). DCs (5×10⁴) and T cells (2.5×10⁵) were coincubated using the RPMI-1640 medium containing GM-CSF (20 ng/mL) for 72 hours. The supernatant was collected, and interferon-γ (IFN-γ) was analyzed with an IFN-γ ELISA kit (R&D Systems) following the protocol from provider. The expression of CD107α on CD8+ T cells was analyzed using flow cytometry (Accuri C6) with APC antimouse CD107α and FITC (Fluorescein isothiocyanate) antimouse CD3 antibodies.
Multiplex immunohistochemistry (multiplex IHC)
Paraffin blocks of tumor tissues were sliced into 4 µm thick slides and heated at 60°C for 1 hour. The slides were dewaxed with xylene and stained with Leica Bond Rx Automated Stainer (Leica Biosystems). Afterwards, the slides were baked for 30 min, dewaxed, placed in Bond Epitope Retrieval 2 (Leica Biosystems) and Bond Epitope Retrieval 1 (Leica Biosystems) sequentially. The slides were incubated with the PD-L1 primary antibodies (13 684S) and CD8 (98 941S) and detected using the corresponding polymer horseradish peroxidase. Visualization was performed with using the Opal TSA Plus dye 690 and 720, respectively (Akoya Biosciences). Anti-CD8 antibody was incubated after incubation with the Opal TSA-DIG reagent (Perkin-Elmer). The nuclei were stained using DAPI (4′,6-diamidino-2-phenylindole) before the slides were covered using HIGHDEF IHC fluoromount (Enzo). The images were gained with PerkinElmer Vectra V.3.0 Automated Quantitative Pathology Imaging System (Perkin-Elmer) and evaluated with the InForm software V.2.2 and TIBCO Spotfire (Perkin-Elmer).
Statistical analysis
All statistical analyses were performed on Prism 8 (GraphPad). Student’s t-test was used to analyze the comparisons between two groups, whereas one-way analysis of variance was used to analyze those among at least three groups, followed by Tukey’s post-hoc test. Tumor-free frequency and survival benefit were evaluated using Kaplan–Meier analysis with log-rank test. The error bars are shown as SE of the mean (SEM). P values<0.05 were considered statistically significant.
Results
KRAS mutation renders tumors susceptible to statin
We first evaluated the association between the antiproliferative effects of statin treatment and various KRAS mutations using CRC cell lines (figure 1A,B). Simvastatin treatment significantly decreased the proliferation and promoted the apoptosis of KRASmut cancer cells in comparison with that its effects on KRAS wild type (KRASwt) cancer cells (figure 1C–E). The simvastatin-induced apoptosis in KRASmut CT26 cancer cells was partially abrogated by GGPP but completely abrogated by FPP, indicating that the tumor cell death by statins is more dependent on FPP depletion in CT26 cells (figure 1D).
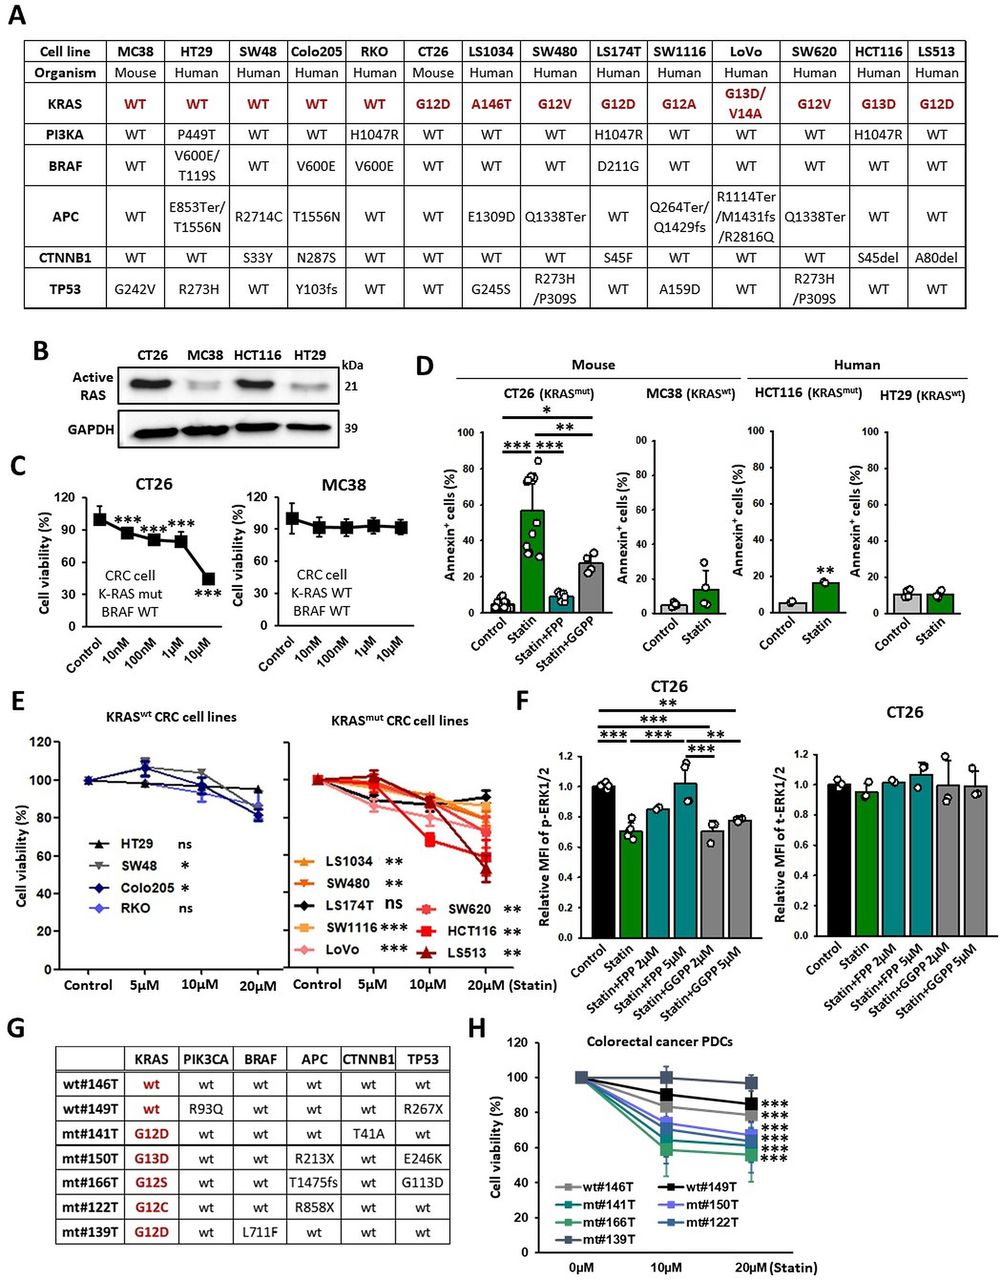
KRAS mutation renders tumors susceptible to statin. (A) Genetic information on the CRC cell lines. (B) Western blotting detecting active RAS form (GTP-bound Ras GTPase) on indicated tumor cell lines. (C) CCK8 assay results of KRASmut and KRASwt cancer cells (CT26: n=8; MC38: n=16). (D) CT26 (KRAS mutation, mouse), MC38 (KRAS wild type, mouse), HCT116 (KRAS mutation, human), and HT29 (KRAS wild type, human) cells were treated with simvastatin (10 µM) and FPP (5 µM) or GGPP (5 µM) for 24 hours, stained with Annexin-V-647, and analyzed using flow cytometry (n=4–12). (E) CCK8 assay of KRASmut and KRASwt CRC cell lines (n=3). (F) Levels of p-ERK1/2 and t-ERK1/2 on CT26 cells were assessed using flow cytometry (n=2–6). (G) Genetic information on PDCs. (H) PDCs were treated with simvastatin at the indicated conditions, and cell viability (%) was assessed using the Water Soluble Tetrazolium Salts cell proliferation assay (n=15–36). The data are shown as mean±SEM. Student’s t-test (D, H) or one-way ANOVA with Tukey’s post-hoc test (C–F) determined statistical significance. The experiment was conducted at least three times with similar results. ANOVA, analysis of variance; CRC, colorectal cancer; FPP, farnesyl pyrophosphate; GGPP, geranylgeranyl pyrophosphate; PDCs, patient-derived cancer cells.
To determine whether statin can suppress KRAS signaling by blocking isoprenylation, we observed the level of phosphorylated-ERK1/2 (p-ERK1/2), a protein located downstream in the RAS signaling pathway. We found that p-ERK1/2 levels were significantly reduced by simvastatin in KRASmut cancer cells (CT26, HCT116, and SW480) but not in KRASwt cancer cells (HT29 and Colo205) (figure 1F and online supplemental figure 1A,B). In addition, the inhibitory effect of simvastatin on KRAS activity in CT26 and HCT116 cancer cells was impaired by FPP but not by GGPP (figure 1F and online supplemental figure 1A). These findings imply that FPP depletion by simvastatin can inhibit the RAS signaling pathway in the KRASmut cancer cells.
To assess potential activity of statin in more clinically relevant models, we used PDCs with various oncogenic driver mutations (figure 1G). Consistent with the results obtained using cell lines, simvastatin substantially decreased the viability of KRASmut PDCs (141T, 150T, 166T, and 122T) compared with those of KRASwt PDCs (146T and 149T) (figure 1H). Interestingly, 139T PDCs (KRASG12D) harboring the BRAF (v-raf murine sarcoma viral oncogene homolog B1) mutation did not respond to simvastatin (figure 1H). Likewise, simvastatin failed to induce cytotoxicity in LS174T cell lines that carried both KRAS and BRAF mutations (figure 1E). These results suggest that genetic activation of the signaling pathways downstream of KRAS may also affect the susceptibility of cancer cells to statins.
Statin induces immunogenic cancer cell death
To investigate whether statin could provoke ICD in KRASmut cancer cells, we analyzed the levels of ICD markers following simvastatin treatment. One of the most characteristic ICD events is the transfer of CRT, an “eat-me” signal, from the ER lumen to the plasma membrane in the preapoptotic cell.17 18 The phosphorylation of PERK-elf2-α, an ER stress response, has been reported to trigger CRT/ERp57 exposure on the plasma membrane.19 We demonstrated that simvastatin increased the signaling of the elf2-α phosphorylation (p-elf2-α) pathway including ATF4 and CHOP in KRASmut cancer cells (figure 2A,B), which was not observed in KRASwt cells (online supplemental figure 1C), subsequently leading to a significant increase in the expression of CRT and ERP57 (figure 2C,D and online supplemental figure 1D) on the plasma membrane of tumor cells. However, FPP blocked this translocation, whereas GGPP did not (figure 2C,D and online supplemental figure 1D). Moreover, simvastatin evoked the release of HMGB1 and HSP70 proteins from CT26 tumor cells, which serve as damage-associated molecular patterns signals to activate the functions of APCs (figure 2E).10 Likewise, treatment with simvastatin effectively decreased p-ERK1/2 levels in CT26 tumor cells in vivo and increased expression of CRT on membranes (figure 2F–H).

Statin induces immunogenic cell death of cancer cells. (A–C) CT26 cells were treated with simvastatin (10 µM) and FPP (5 µM) or GGPP (5 µM) for 4 hours. (A) Representative western blot image showing the levels of ER-stress response markers (elf2α, p-elf2α, ATF4, and CHOP) and a loading control (Glyceraldehyde 3-phosphate dehydrogenase). (B) Quantification of p-elF2α evaluated by western blotting. (C) Expression of CRT (n=5–11) and ERP57 (n=4–5) was assessed using flow cytometry. (D) Representative confocal image of expression of CRT (green) and wheat germ agglutinin (red). (E) CT26 cells were treated with simvastatin (10 µM) for 24 hours. Representative western blot image of the levels of HMGB1 and HSP70 in cell lysates. (F–H) CT26 tumor-bearing syngeneic mice were injected with simvastatin (20 mg/kg) for seven times daily. After 24 hours, the tumors were extracted. (F) The levels of ERK1/2, p-ERK1/2, and (G, H) CRT in the CT26 tumors as assessed using flow cytometry (ERK1/2: n=8; p-ERK1/2: n=8; CRT: n=8). (I) CT26 cells were treated with con-siRNA (100 nM), KRAS-siRNA (100 nM), and simvastatin (10 µM) for 24 hours. Expression of CRT (n=4) or ERP57 (n=4) was assessed using flow cytometry. (J–L) Calu-1 and H23 cancer cells were treated with AMG-510 (10 µM) and simvastatin (10 µM) for 24 hours or 48 hours. (J) Annexin-V assay results indicated the conditions of CT26 cancer cells (n=3–5). CRT and ERP57 expression on (K) Calu-1 and (L) H23 tumor cells after 24 hours was assessed using flow cytometry (n=3–5). The data are shown as mean±SEM. Student’s t-test (B, F, G) or one-way ANOVA with Tukey’s post-hoc test (C and I–L) determined statistical significance. The experiment was conducted at least three times with similar results. ANOVA, analysis of variance; CRT, calreticulin; ER, endoplasmic reticulum; FPP, farnesyl pyrophosphate; GGPP, geranylgeranyl pyrophosphate; HMGB1, high-mobility group box 1; HSP70, heat-shock protein 70.
A previous study has demonstrated that RAS signaling negatively regulates ER stress responses, including the phosphorylation of elf2-α, thereby preventing ER stress-associated cell death.12 To determine whether KRAS inhibition could induce ER stress responses, we treated KRASG12D (CT26) and KRASG12C cancer cells (Calu-1 and H23) with the specific KRAS inhibitors; KRASG12D siRNA and AMG-510 (KRASG12C inhibitors), respectively. These KRAS inhibitors, like simvastatin, effectively induced the apoptosis of KRASmut cancer cells and exposed CRT and ERP57 on plasma membranes in preapoptotic states (figure 2I–L and online supplemental figure 1E). These findings indicate that KRAS acts as a negative regulator of ER stress responses in KRASmut tumors.
Statin enhances the functions of DCs against cancer
To verify that simvastatin can increase the phagocytosis of cancer cells, we performed in vitro phagocytosis assays using pHrodo-SE that emits higher signals in the low-pH conditions in the phagosome.20 We found that CT26 cells pretreated with simvastatin were readily engulfed by BMDMs and BMDCs (figure 3A,B), and that FPP impaired such effects (figure 3A,B), indicating that statin-induced-FPP depletion in KRASmut tumor cells boosted cancer cell clearance. These results strongly suggest that statins can efficiently elicit ICD in KRASmut tumors via suppressing the isoprenylation of KRAS.
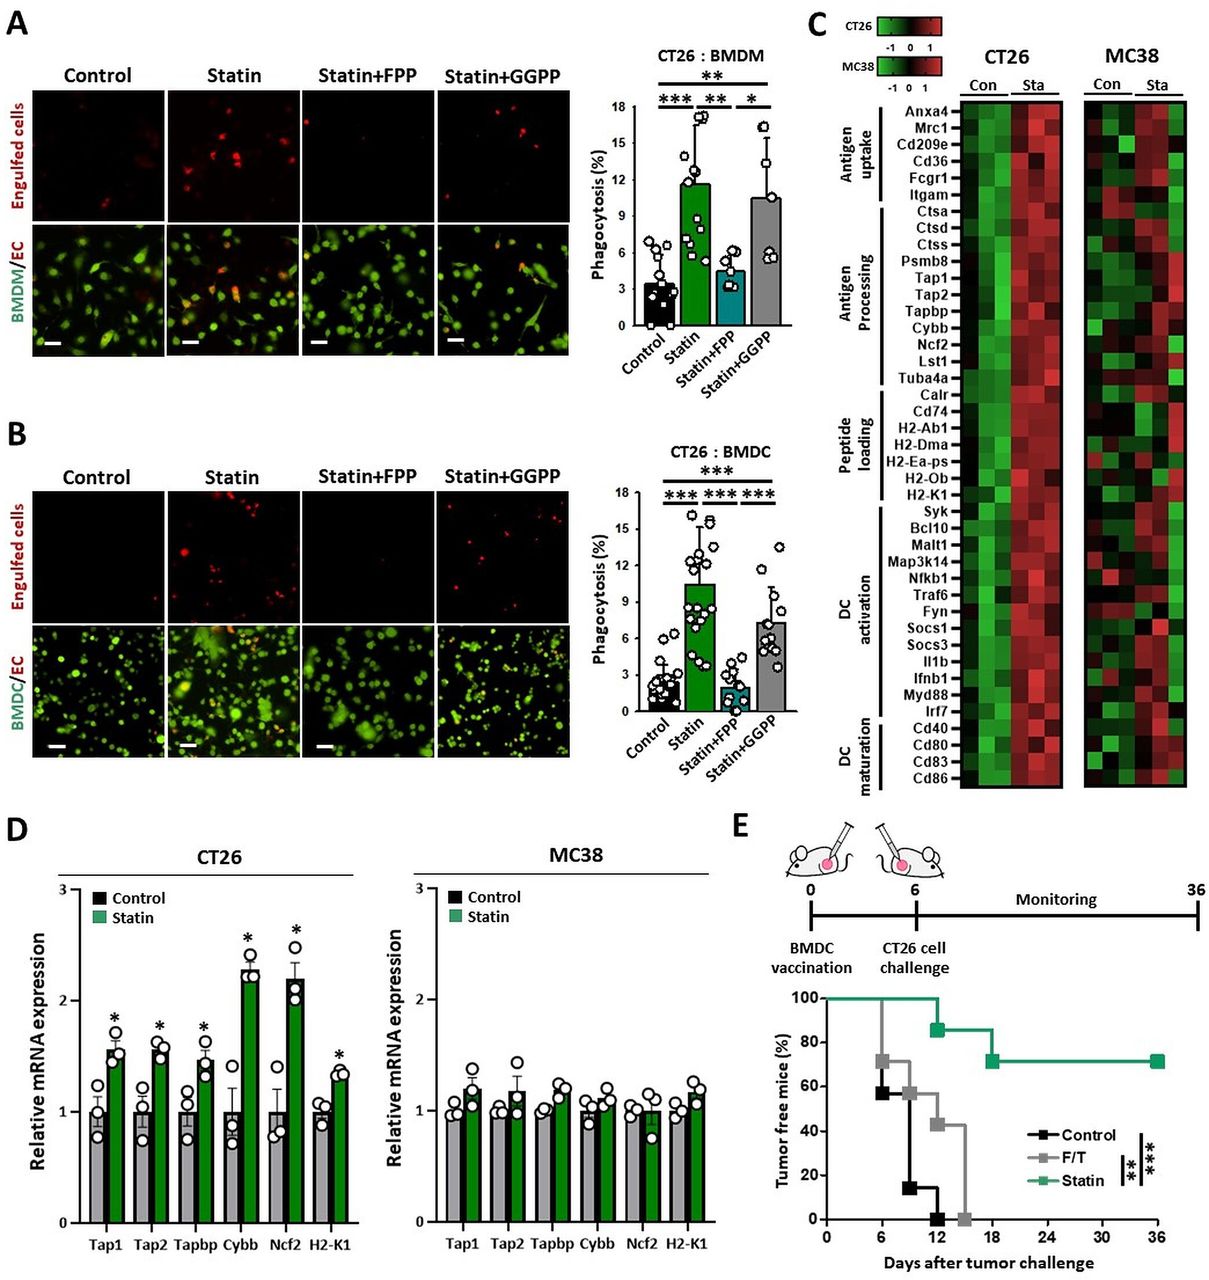
Statin enhances the functions of DCs against cancer. (A, B) CMFDA-stained BMDMs or BMDCs were coincubated with CT26 cells treated with the indicated drugs. Representative immunofluorescence images of pHrodo-SE-labeled CT26 cells (red) against green CMFDA-labeled BMDMs or BMDCs (left). Scale bar: 50 µm. Phagocytosis (%) was calculated based on the total number of BMDMs (A; n=7–14) or BMDCs (B; n=12–23) containing CT26 cells (right). (C, D) CT26 and MC38 tumor-bearing syngeneic mice were injected with simvastatin (20 mg/kg) for seven times daily. After 24 hours, DCs (CD11c+ cells) were sorted from extracted tumor tissues. (C) Gene expression in DCs (CD11c+ cells) sorted from CT26 or MC38 tumors using the NanoString nCounter System (CT26: n=3; MC38: n=3). (D) Cross-presentation-related mRNA expression in DCs (CD11c+ cells) sorted from CT26 or MC38 tumors determined by NanoString nCounter System (CT26: n=3; MC38: n=3). (E) Prophylactic vaccine effect of BMDCs coincubated with CT26 cells that were treated with simvastatin (10 µM) or frozen and thawed vs challenged CT26 cells (n=7). These data are shown as mean±SEM. One-way ANOVA with Tukey’s post-hoc test (A, B), Student’s t-test (D), or Kaplan–Meier analysis followed by long-rank test (E) determined statistical significance. The experiment was conducted at least three times with similar results. ANOVA, analysis of variance; BMDCs, bone marrow-derived dendritic cells; BMDMs, bone marrow-derived macrophages; DCs, dendritic cells.
ICD of cancer cells allows APCs to recognize tumor cells as danger signals, thereby triggering tumor-specific T-cell immunity.10 To elucidate the sequence of the immunological events induced by simvastatin treatment, we analyzed its effect on DCs in CT26 tumor tissues. To test whether statin can activate tumor DCs in vivo, we analyzed the gene signatures of DCs isolated from tumor tissues (figure 3C). DCs from CT26 tumors (KRASmut) of simvastatin-treated mice had a higher expression of genes closely related to antigen uptake, antigen processing, peptide loading, DC activation, and DC maturation compared with the controls (figure 3C and online supplemental figure 2) and exhibited enhanced expression of cross-presentation related genes, such as Tap1, Tap2, Tapbp, Cybb, Ncf2, and H2-K1, (figure 3D and online supplemental figure 3) and H2Kd proteins (figure 4A) in DCs of CT26 tumors. In contrast, in the MC38 tumor (KRASwt) model, simvastatin did not substantially change the expression of these genes (figure 3C,D and online supplemental figure 2). These results suggest that the statin-induced KRASmut cancer cell death is immunogenic to efficiently activate DCs in vivo.
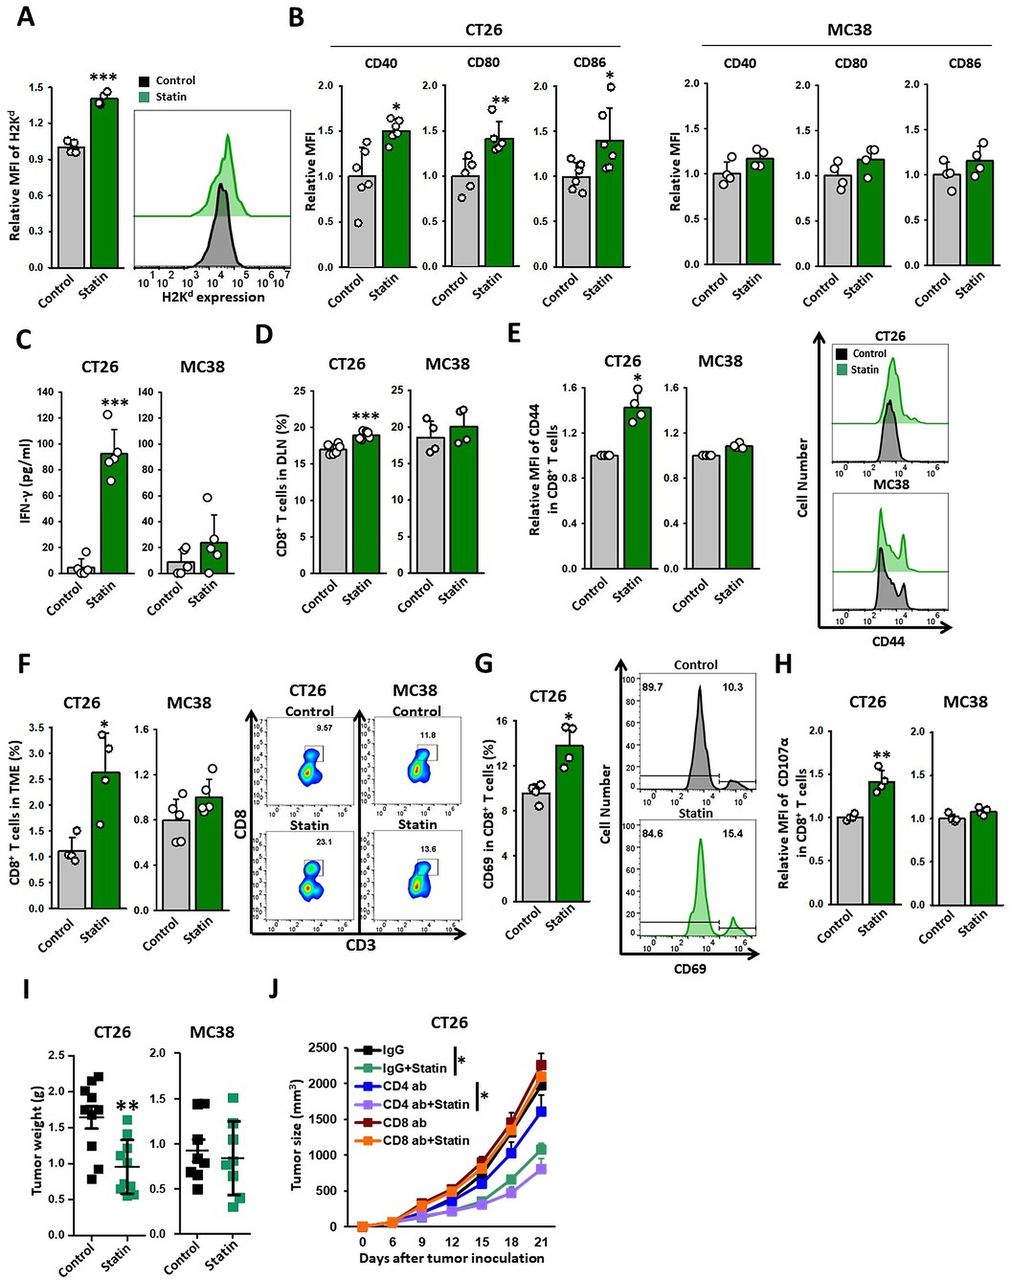
Statin triggers CD8+ T-cell-mediated eradication of KRAS mutant tumors. (A–I) CT26 and MC38 tumor-bearing syngeneic mice were injected with simvastatin (20 mg/kg) for seven times daily. TDLNs and tumor tissues were extracted 1 day after the end of treatment and analyzed using flow cytometry. (A) Expression of H2Kd in DCs (CD11c+ cells) of CT26 tumors (n=4). (B) Expression of CD40, CD80, or CD86 in DCs (CD11c+ cells) of TDLN (CT26: n=5–6; MC38, n=4). (C) DCs (CD11c+ cells) of TDLN were coincubated with CD8+ T cells from CT26 or MC38 tumor models for 72 hours. The cross-prime ability of DCs from TDLN was determined based on the released IFN-γ analyzed using IFN-γ ELISA kit (CT26: n=5; MC38: n=5). (D) Percentage of CD8+ T cells in the TDLNs of CT26 and MC38 tumor models (CT26: n=6; MC38: n=4). (E) Expression of CD44 on CD8+ T cells (CD45.2+CD3+CD8+) in TDLN (left) (CT26: n=4; MC38: n=4). Representative histograms of CD44 expression on CD8+ T cells isolated from CT26 and MC38 TDLN. (Right) (F) Proportion of CD8+ T cells (CD45.2+CD3+CD8+) in tumors (left) (CT26: n=4; MC38: n=5). Representative plots of CD8+ T cells. (Right) (G) The expression of CD69 on CD8+ T cells in CT26 tumors (CT26: n=4). (H) The expression of CD107α on CD8+ T cells in CT26 and MC38 tumors (CT26: n=4; MC38: n=4). (I, J) CT26 tumor models were injected with simvastatin (20 mg/kg), neutralizing CD4 (10 mg/kg), neutralizing CD8 (10 mg/kg), or control IgG. (I) Tumor weight (g) was measured at the end of the experiment (CT26: n=10; MC38: n=8). (J) Tumor volume (mm3) was measured in indicated periods (n=7). These data are shown as mean±SEM. Student’s t-test (A–H) or one-way ANOVA with Tukey’s post-hoc test (J) determined statistical significance. The experiment was conducted at least three times with similar results. ANOVA, analysis of variance; DCs, dendritic cells; IFN-γ, interferon-γ; TDLN, tumor-draining lymph nodes.
To evaluate the ability of the dying cells to initiate adaptive immunity in vivo, we assessed whether simvastatin-based DC vaccines could promote a prophylactic vaccine effect against KRASmut cancers. BMDCs coincubated with statin treated-cells or control CT26 cells were subcutaneously injected into the left flank of immunocompetent, BALB/C mice. After 7 days, the immunized and control mice were challenged with live CT26 cells in the right flank. Remarkably, approximately 70% of the mice vaccinated with simvastatin-based DC vaccines were protected from the tumor growth of CT26 cells, whereas other groups were not (figure 3E). These results demonstrate that simvastatin has the potential to generate DC-mediated T-cell immunity to prevent tumor growth.
Statin activates DC-mediated CD8+ T-cell immunity
DCs carrying tumor antigens migrate to the tumor-draining lymph nodes (TDLNs), where they induce T cells to recognize and eradicate tumors.21 22 To assess whether statin therapy potentiates the functions of DCs that are necessary to achieve potent T-cell immunity against cancer, we evaluated the immunological benefits of simvastatin on DC maturation in TDLNs. Although simvastatin did not directly induce DC maturation in vitro (online supplemental figure 4A), systemic administration of simvastatin significantly increased the levels of DC maturation markers, such as CD40, CD80, and CD86, in the CT26 tumor model whereas did not in MC38 (figure 4B). Previous studies have demonstrated that lipophilic statins mediated GGPP depletion, including simvastatin, promoted antigen presentation in APCs by suppressing Rab5 signaling.23 Likewise, we found that simvastatin could directly enhance cross-presentation by DCs via GGPP depletion when challenged with OVA peptides (online supplemental figure 4B). These results indicate that statins can activate the functions of DCs effectively in KRASmut tumors.
To confirm the effects of statin on T-cell priming, we isolated DCs from the TDLNs of simvastatin-treated CT26 and MC38 tumor-bearing mice and coincubated them with CD8+ T cells from the lymphoid organs of CT26 and MC38 tumor models, respectively. We observed that DCs isolated from KRASmut TDLNs, but not from KRASwt TDLNs, provoked efficient CD8+ T-cell priming as evidenced by IFN-γ expression following simvastatin treatment (figure 4C). Simvastatin treatment also elevated the CD8+ T-cell proportion in the TDLNs of CT26 tumors with increased CD44 expression, an effect related to the antigen-experienced status of the T cells (figure 4D,E). These findings suggest that the induction of ICD in KRASmut tumors by statin can promote the cross-priming abilities of DCs, thereby producing tumor-specific CD8+ T cell immunity.
Statin triggers CD8+ T-cell-mediated eradication of KRAS mutant tumors
We next investigated the dependence of the antitumorigenic effect of statins on T-cell immunity. We discovered that simvastatin treatment substantially elevated the fractions of CD8+ T cells in CT26 but not in MC38 tumors (figure 4F). Because the properties of the TME can impair the cytotoxic T-cell immunity, the activation status of CD8+ T cells is important for tumor control.24 25 We observed that simvastatin treatment increased the levels of CD69 (an early activation marker for CD8+ T cells) and CD107α (an activation marker for the degranulation of CD8+ T cells) in the CD8+ T cells of CT26 tumors (figure 4G,H). These results suggest that simvastatin increases not only the infiltration of CD8+ T cells but also their activity in CT26 tumors but not in MC38 tumors.
Consistent with our immunological data, simvastatin treatment significantly suppressed the growth and tumor weight in the CT26 model but not in the MC38 model (figure 4I and online supplemental figure 5A,D). There was no substantial change in body weight between the two groups (online supplemental figure 5B,C). We also assessed the correlation between the antitumor effects of simvastatin and the depletion of CD4+ or CD8+ T-cell immunity in the CT26 tumor model. Antibody-mediated CD8+ T-cell depletion abrogated the antitumor efficacy of simvastatin, whereas depletion of CD4+ T cells did not (figure 4J and online supplemental figure 5E–H). Overall, these results imply that CD8+ T-cell immunity is necessary for simvastatin-mediated tumor regression.
Combination of statin and oxaliplatin effectively induces antitumor immune responses
Oxaliplatin is a well-known ICD inducer that can increase both the preapoptotic expression of CRT and the postapoptotic release of HMGB1,26 thus promoting the activation of DCs and CD8+ effector T -cell function.27 Hence, this drug has been widely used in combination therapy in oncoimmunology related studies and has exhibited excellent results when combined with ICBs.28 Oxaliplatin is a first-line chemotherapeutic agent for colorectal, non-small-cell lung, and pancreatic cancers, which are tumors frequently exhibiting KRAS mutations.29 Accordingly, we investigated whether a combined therapy of oxaliplatin and simvastatin could better provoke the ICD of KRASmut cancer cells. We found that the combination treatment significantly enhanced CRT expression in CT26 cells compared with monotherapy using either simvastatin or oxaliplatin alone (figure 5A). Notably, the combination of simvastatin and oxaliplatin caused a substantial increase in BMDC-mediated phagocytosis of immunogenic dying CT26 cells (figure 5B).

Combination therapy of statin and oxaliplatin effectively induces antitumor immune responses. (A) Expression of CRT was assessed using flow cytometry (n=4). (B) CMFDA-stained BMDCs were coincubated with CT26 cells treated with the indicated drugs. Phagocytosis (%) was calculated based on the total number of BMDCs (green) containing CT25 cells (red) (n=7–12). Scale bar: 50 µm. (C–H) CT26 tumor models were injected with simvastatin (20 mg/kg) and oxaliplatin (5 mg/kg). (C) Tumor volume (mm3) was measured in the indicated periods (n=19). (D) Tumor weight (g) was measured at the end of the experiment (n=19). (E, F) Cross-prime ability of DCs from TDLN was determined based on the released IFN-γ (E, n=5) and on CD107α expression on CD8+ T cells analyzed (F, n=4). (G) Proportion of CD8+ T cells (CD45.2+CD3+CD8+ cells) in tumors (left) (n=10) and representative quadrant plots of CD8+ T cells in CT26 tumors (right). (H) Proportion of IFN-γ+ cells in CD8+ T cells (CD45.2+CD3+CD8+ cells) in tumors (n=3). (I–L) B6.129-Krastm3Bbd/J lung and KIC pancreatic tumor models were injected with simvastatin (20 mg/kg) and oxaliplatin (5 mg/kg). (I) The number of tumor nodules measured at the end of the experiment (left) (n=6–7) and representative image of KRASmut lung cancer at the end of the experiment (right). (J) Tumor fraction (%) measured at the end of the experiment (left) (n=6–10) and representative H&E staining of KRASmut lung cancer (right). (K) Survival rate in the KIC models following combination treatment (n=10). (L) Representative microscopic image of CD8+ T-cell infiltration; scale bar: 50 µm. The data are shown as mean±SEM. One-way ANOVA with Tukey’s post-hoc test (A–J) or Kaplan–Meier analysis using long-rank test (K) determined statistical significance. The experiment was conducted at least three times with similar results. ANOVA, analysis of variance; BMDCs, bone marrow-derived dendritic cells; CRT, calreticulin; DCs, dendritic cells; TDLN, tumor-draining lymph nodes.
Furthermore, we determined the effect of the combined therapy on tumor growth and found that it effectively suppressed the tumor without increased toxicity compared with monotherapy (figure 5C,D and online supplemental figure 6). We next assessed its potential immunological effect against cancer. DCs from the TDLNs of combination therapy-treated mice exhibited higher levels of costimulatory markers, such as CD40, CD80, and CD86, which reflected DC maturation compared with other groups (online supplemental figure 7). In addition, the combination therapy effectively increased the capability of DCs to prime CD8+ T cells, as measured by enhanced IFN- γ production and CD107α expression of primed CD8+ T cells (figure 5E,F and online supplemental figure 8A), as well as elevation of the number of CD8+ T cells in the TME and the proportion of IFN-γ+ in CD8+ T cells (figure 5G,H and online supplemental figure 8B,C). However, combined therapy did not show any effects on other immune cells (online supplemental figure 8D–H).
In contrast with subcutaneous syngeneic tumor models, genetically engineered mouse models (GEMMs) form de novo orthotopic tumors that display genetic heterogeneity resembling the tumor-immune microenvironments in humans.30 To confirm the efficacy of the combination of simvastatin and oxaliplatin in GEMMs, we used the B6.129-Krastm3Bbd/J lung and the KIC pancreatic tumor models, which harbor KRAS mutations (online supplemental figure 8I).16 31 We found that combined therapy efficiently inhibited the number and fraction of tumor nodules in the B6.129-Krastm3Bbd/J lung tumor models (figure 5I,J). Likewise, this treatment improved the survival rate in KIC pancreatic tumor model compared with other treatment groups (figure 5K). Furthermore, immunofluorescence analysis revealed that the CD8+ T-cell infiltration to tumors was robustly increased in the combination therapy groups (figure 5L). These results clearly indicate that the combination of simvastatin and oxaliplatin produces substantial therapeutic effects even in GEMMs carrying a KRAS mutation, thereby reducing tumor growth and enhancing CD8+ T cell immunity.
Combination therapy sensitizes tumors to PD-1 blockade
To better understand the complicated tumor-immune microenvironment, we performed a multiplex IHC on the treated tumor tissues from the CT26 syngeneic tumor model. Consistent with our Fluorescence-activated cell sorting (FACS) results, the combination therapy significantly increased CD8+ T cells in the TME (figure 6A). In addition, we found that increased CD8+ T-cell accumulation by combined therapy was correlated with enhanced tumor cell death (online supplemental figure 9A). Although CD8+ T-cell infiltration is instrumental for tumor control, cancer cells can evade the CD8+ T-cell-mediated-immune destruction by expressing inhibitory signals, such as PD‐L1.24 PD-L1 on tumor cells is upregulated by IFN-γ and oncogenic signaling including RAS.32 Given that statin could inhibit RAS activity by blocking farnesylation, we hypothesized that simvastatin may suppress PD-L1 expression on KRASmut cancer cells. We thus explored whether simvastatin treatment affects PD-L1 expression in CT26 tumors. The overall PD-L1 expression in tumor tissues was decreased following combination therapy (figure 6A). Moreover, FACS analysis revealed that the combination or treatment with simvastatin alone efficiently inhibited PD-L1 expression in tumors (CD45− cells) but not in immune cells (CD45+ cells) (figure 6B,C). These results suggest that the combination therapy can markedly suppress PD-L1 expression of KRASmut tumor cells even in the presence of activated CD8+ T cells.

Combination therapy sensitizes tumors to PD-1 blockade. (A–D) CT26 tumor models were injected with simvastatin (20 mg/kg) and oxaliplatin (5 mg/kg). (A) Representative multiplex IHC image of CD8 (green), PD-L1 (red), and DAPI (blue); scale bar: 2 mm (left), 200 µm (middle), and 50 µm (right). (B) Representative histogram of PD-L1 expression. (C) PD-L1 expression on CD45− cells or CD45+ cells in CT26 tumors was assessed using flow cytometry (n=5). (D) Representative multiplex IHC image of CD8 (green), PD-L1 (red), and DAPI (blue) about combined therapy; scale bar: 300 µm. (E–G) CT26 tumor models were injected with simvastatin (20 mg/kg) and oxaliplatin (5 mg/kg) with and without anti-PD-1 antibodies (10 mg/kg). (E) Illustration of the dosing schedule. (F) Tumor volume (mm3) was measured in the indicated period (n=15). (G) Survival rate in the CT26 syngeneic tumor model following the ternary combination treatment (n=10). The data are shown as mean±SEM. One-way ANOVA with Tukey’s post-hoc test (C, F) or Kaplan-Meier analysis using long-rank test (G) determined statistical significance. The experiment was conducted at least three times with similar results. ANOVA, analysis of variance; IHC, immunohistochemistry.
However, heterogenous PD-L1 expression restrains CD8+ T-cell infiltration into tumors following combination therapy (figure 6D). The area with high PD-L1 expression (right white circle) showed little CD8+ T-cell infiltration, whereas the region with relatively low PD-L1 expression (left white circle) showed higher infiltration (figure 6D and online supplemental figure 9B). These findings indicate that PD-L1 blockade may be required to enhance the therapeutic index of the combination therapy using statin and oxaliplatin. To investigate the effects of ternary combination therapy of simvastatin, oxaliplatin, and anti-PD-1 antibodies, we used CT26 syngeneic tumor model, resistant to PD-1 blockade (figure 6E).33 Consistent with previous reports, anti-PD-1 antibody monotherapy did not affect CT26 tumor growth, whereas combination therapy with statins and oxaliplatin exhibited a modest tumor-suppressing effect (figure 6F). Importantly, the ternary combination treatment of simvastatin, oxaliplatin, and anti-PD-1 antibodies dramatically suppressed tumor growth and improved the survival rate of CT26 tumor-bearing mice (figure 6F,G). Together, these results demonstrate that combination therapy with simvastatin and oxaliplatin sensitizes the tumors lacking CD8+ T cells to PD-1 blockade, thereby eliciting remarkable tumor-suppressing effects.
Discussion
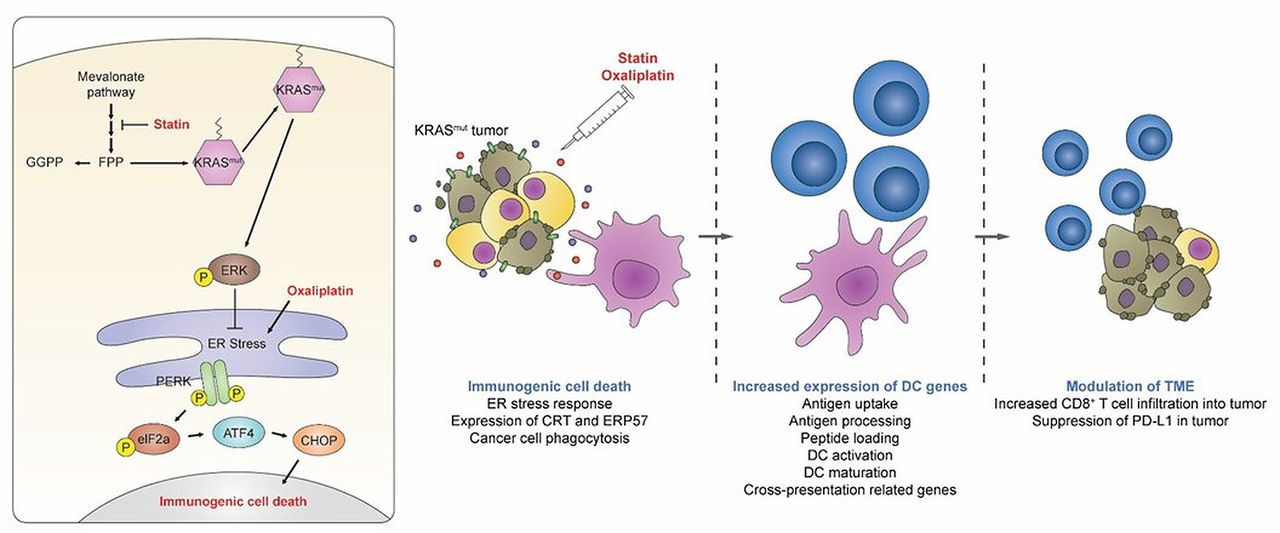
In this study, we demonstrated that the statin could enhance the immunogenicity of KRASmut tumors via the inhibition of prenylation of the RAS protein (figure 7). Simvastatin inhibited FPP production, a metabolite required for the farnesylation of the RAS signaling in KRASmut cancer cells, ultimately leading to the phosphorylation of elf2α and the subsequent induction of the exposure of the preapoptotic CRT/ERP57 complex on cancer cell membranes. These cancer cells exhibiting high CRT expression, the hallmark of ICD, were readily engulfed by APCs, such as macrophages and DCs. Although the KRAS oncoprotein can be activated through the cross-prenylation by GGPP,34–36 we excluded the possibility that GGPP depletion induced by simvastatin might elicit the ICD of cancer cells. However, numerous studies have demonstrated that GGPP depletion is also important in antitumor effects. For example, a recent study showed that simvastatin could act as a potent adjuvant for cancer vaccines by suppressing GGPP-mediated Rab5 signaling in APCs, resulting in delayed antigen degradation, enhanced T-cell priming, and promotion of tumor-specific T-cell immunity.23 Statins are also known to inhibit GGPP-dependent macropinocytosis essential for nutrient uptake in cancer cells,37 resulting in the selective killing of tumor cells. These findings collectively highlight the therapeutic potential of statin targeting both the GGPP and FPP to evoke improved antitumor effects. It is important to note that ICD induction in cancer cells has been reported to be closely related to the inhibition of the RAS/ERK signaling pathway.38 In agreement with these reports, we found that KRAS-specific inhibitors, such as KRAS siRNA or AMG-510, showed similar results to simvastatin, suggesting that the suppression of the KRAS signaling plays a critical role in ICD induction of KRASmut tumors. However, the precise mechanism by which the KRAS activity suppresses the induction of ICD remains to be elucidated.

Graphical abstract of the anticancer immunotherapeutic strategy using by statins.
The composition, function, and location of CD8+ T cells in tumors are crucial factors in determining the clinical efficacy of anticancer immunotherapy.24 The number of activated CD8+ T cells infiltrating the tumor correlates with a positive survival outcome across many cancer types on ICB treatment.24 To achieve optimal conditions, sufficient CD8+ T-cell priming by DCs is required.39 It is well known that the ICD of cancer cells can promote the licensing of DCs against cancer.40 NanoString analysis highlighted the prominent role of statin-induced ICD of KRASmut tumors in the activation of DCs in the tumors via an increase in the expression of 41 genes related to antigen presentation, including cross-priming, which induces CD8+ T-cell immunity. In addition, sequential immunological studies revealed that statins provoke DC maturation and T-cell priming in DLNs, leading to extensive CD8+ T-cell infiltration into KRASmut tumors. More studies investigating the molecular mechanisms underlying the promotion of DC-mediated CD8+ T-cell immunity by statins are necessary to develop its use more fully for cancer immunotherapy.
Previous studies have demonstrated that monotherapy with an immunogenic chemotherapy may not be sufficient to trigger successful antitumor immunity for tumor eradication.41 42 In addition, the high-dose chemotherapy causes unwanted toxicity, thus hampering the acquisition of effective anticancer immunity.43 Furthermore, statins have been found to induce chemosensitizing effects by blocking prenylation of proteins in cancer cells.44 These findings prompted us to investigate the potential of combination therapy in the immunogenic killing of tumor cells. In this study, we combined simvastatin with oxaliplatin, another ICD inducer, to stimulate ICD of KRASmut cancer cells by inducing severe ER stress responses. We found that this combination therapy substantially augmented cancer cell phagocytosis by significantly enhancing CRT expression. Although low-dose oxaliplatin treatment (weekly 5 mg/kg) did not significantly inhibit tumor growth, systemic administration of statin and low-dose oxaliplatin promoted potent DC-mediated CD8+ T-cell immunity without significant toxicities, leading to successful tumor control in KRASmut tumor model. Furthermore, the abovementioned combination therapy could enhance the therapeutic efficacy of PD-1 antibodies even in PD-1-resistant tumor models. Overall, our ternary combination therapy should be a crucial strategy for potentiating CD8+ T cell immunity against cancer in KRASmut tumors.
Numerous clinical trials and epidemiological studies have also investigated the potential antitumorigenic effect of statins on KRASmut tumors.45 Contrary to expectations, however, the results of these clinical studies are not yet conclusive.46 47 There are several reasons for this controversial efficacy of statins against KRASmut cancers. Owing to an extensive first-pass metabolism in the gastrointestinal wall and high albumin binding of the lipophilic statins, the systemic bioavailability of statin via oral administration is less than 5%.48 For these reasons, the dose of statin used in these studies may be insufficient to achieve the therapeutic concentration range necessary for antitumor effects. Furthermore, because tumors are caused by combinations of genetic abnormalities, statin sensitivity may be more closely correlated with multiple oncogenic mutations than with a single mutation. Given that our data indicate that combination mutation of KRAS and BRAF make cancer cells resistant to statin, it is important to create an optimal predictive biomarker for patient stratification by evaluating heterogenous tumor mutations. Therefore, future clinical studies that complements these points could be warranted to improve the potential of statin in cancer immunotherapy.
In conclusion, we demonstrated that systemic administration of statins could elicit effective antitumor immune responses by inducing ICD as well as enhancing DC-mediated CD8+ T-cell immunity against KRASmut tumors. We expect that the use of statins, which are frequently prescribed for hyperlipidemia, as a cancer therapeutic strategy would quickly benefit cancer patients, particularly those with KRASmut tumors. Further research focused on developing newly formulated statins to improve their antitumorigenic effect may offer a promising option for cancer immunotherapy.
Data availability statement
All data relevant to the study are included in the article or uploaded as supplementary information. The datasets used and/or analyzed during the current study are available from the corresponding author on reasonable request.
Ethics statements
Ethics approval
All animal studies were conducted with the approval of the Institutional Animal Care and Use Committee (IACUC) of the KIST.
Acknowledgments
We would like to thank Wiley Editing Services for English language editing. Also, we are grateful to Dr ANCA (INSERM, France) for providing the Pdx1-Cre Ink4a/Arflox/+ and LSL-KrasG12D Ink4a/Arflox/lox mice.
References
Supplementary materials
Supplementary Data
This web only file has been produced by the BMJ Publishing Group from an electronic file supplied by the author(s) and has not been edited for content.
Footnotes
G-HN and MK contributed equally.
Contributors G-HN, MK, I-SK, and YBC designed the project and contributed to the interpretation of data. G-HN, MK, HJ, EK, SAK, YC, SJS, SK, YL, GBK, and JH contributed to the acquisition and analysis of data. JW and YC supported animal experiments. G-HN and MK wrote the manuscript with the feedback from all the authors. CJ, S-YP, and TMR advised and supported this project with expertise.
Funding This research was supported by a National Research Foundation of Korea (NRF) grant funded by the Ministry of Science and ICT (2020R1C1C1003539 and 2017R1A3B1023418); the KU-KIST Graduate School of Converging Science and Technology Program; the KIST Institutional Program; SMC-KIST Collaborative Research Program; and a grant of the Korean Health Technology R&D Project through the Korea Health Industry Development Institute (KHIDI), funded by the Ministry of Health & Welfare, Republic of Korea (grant number: HI19C0753).
Competing interests None declared.
Provenance and peer review Not commissioned; externally peer reviewed.
Supplemental material This content has been supplied by the author(s). It has not been vetted by BMJ Publishing Group Limited (BMJ) and may not have been peer-reviewed. Any opinions or recommendations discussed are solely those of the author(s) and are not endorsed by BMJ. BMJ disclaims all liability and responsibility arising from any reliance placed on the content. Where the content includes any translated material, BMJ does not warrant the accuracy and reliability of the translations (including but not limited to local regulations, clinical guidelines, terminology, drug names and drug dosages), and is not responsible for any error and/or omissions arising from translation and adaptation or otherwise.