Article Text

Abstract
Background Immunization with tumor neoantigens is a promising vaccine approach to promote antitumor immunity due to their high immunogenicity, lack of expression in normal tissue, and preferential induction of tumor neoantigen-specific T cells, which are central mediators of the anti-cancer response. A drawback to targeting tumor neoantigen-specific T cells is that these cells are found at a low frequency in patients with cancer, limiting their therapeutic benefit. Interleukin-2 (IL-2) promotes expansion and persistence of tumor-reactive T cells. However, its clinical use has been hampered by toxicities arising from its multiple cellular targets. Thus, new engineered IL-2 receptor (IL-2R) agonists with distinctive cell type selectivity have been designed to harness the potential of IL-2 for tumor immunotherapy.
Methods We investigated the potential to amplify neoantigen-specific CD4+ and CD8+ T cell immune responses to promote antitumor immunity through vaccination with tumor neoantigens. Following T cell receptor (TCR)-mediated induction of the high-affinity IL-2R on these T cells, amplification of the neoantigen-specific T cell response was achieved using a high dose of the mouse IL-2/CD25 (mIL-2/CD25) fusion protein, an IL-2R agonist with more favorable pharmacokinetics and pharmacodynamics than IL-2 and selectivity toward the high-affinity IL-2R.
Results Administration of a high dose of mIL-2/CD25 shortly after antigen-dependent induction of the high-affinity IL-2R amplified the numbers and function of TCR transgenic tumor-reactive tyrosinase-related protein-1 (TRP-1) CD4+ T cells, leading to antitumor immunity to B16-F10 melanoma. This approach was adapted to amplify endogenous polyclonal B16-F10 neoantigen-specific T cells. Maximal expansion of these cells required prime/boost neoantigen vaccinations, where mIL-2/CD25 was optimal when administered only after the boosting steps. The ensuing mIL-2/CD25-driven immune response supported antitumor immunity to B16-F10 and was more effective than treatment with a similar amount of IL-2. Optimal antitumor effects required amplification of CD4+ and CD8+ neoantigen-specific T cells. High-dose mIL-2/CD25 supported a tumor microenvironment with higher numbers of CD4+ and CD8+ T effectors cells with increased granzyme B expression and importantly a more robust expansion of neoantigen-specific T cells.
Conclusion These results indicate that neoantigen-based vaccines are optimized by potentiating IL-2R signaling in CD4+ and CD8+ neoantigen-reactive T cells by using high-dose mIL-2/CD25, leading to more effective tumor clearance.
- melanoma
- cytokines
- CD4-positive T-lymphocytes
- CD8-Positive T-lymphocytes
Data availability statement
Data are available upon reasonable request. All data relevant to the study are included in the article or uploaded as supplementary information.
This is an open access article distributed in accordance with the Creative Commons Attribution Non Commercial (CC BY-NC 4.0) license, which permits others to distribute, remix, adapt, build upon this work non-commercially, and license their derivative works on different terms, provided the original work is properly cited, appropriate credit is given, any changes made indicated, and the use is non-commercial. See http://creativecommons.org/licenses/by-nc/4.0/.
Statistics from Altmetric.com
Background
Tumors with high mutational burden are associated with better therapeutic outcomes to immune checkpoint blockade therapy in part due to release of immune brakes on neoantigen-specific T cells.1 However, even when activation and re-invigoration of tumor-reactive T cells is achieved, low frequencies of tumor-reactive effector T cells and impaired T cell memory leads to acquired resistance to therapy and recurring disease.2 3 Strategies to enhance this parameter are necessary for more effective cancer immunotherapies.
Vaccines that incorporate tumor neoantigens are designed to activate and increase the frequency of tumor-specific T cells. Neoantigens are strongly immunogenic as the avidity of T cell receptors (TCRs) recognizing this class of tumor antigens is higher than those TCRs recognizing self-antigens due to lack of negative selection during central immunological tolerance. Targeting tumor neoantigens avoids healthy tissue destruction by T cells as these antigens are only expressed by the tumor tissue.4 High-throughput sequencing technology to identify neoantigens coupled with computational predictions of major histocompatibility complex (MHC) binding have made neoantigen vaccines feasible for cancer immunotherapy. Current formulations are aimed at not only stimulating CD8+ neoantigen-specific T cells, which have the greatest cytotoxic potential, but also incorporate neoantigens targeting CD4+ T cells. Eliciting CD4+ T cell help promotes optimal tumor-specific CD8+ T cell expansion, effector function, and memory5–9 and sometimes also directly mediates antitumor effector function, including cytotoxic T lymphocyte (CTL) activity.10–14 Paradoxically, some pipelines used for MHC class I neoantigen discovery have frequently resulted in the identification of immunogenic MHC class II neoantigens.10 11 Clinical trials have demonstrated that neoantigen cancer vaccines elicited CD4+ and CD8+ neoantigen-specific T cell responses.15–17 However, the resulting responses are limited by a low frequency of tumor neoantigen-specific T cells (0.01%) found in patients with cancer.18
Recombinant interleukin-2 (IL-2) was the first immunotherapy to produce durable remission in patients with cancer due to its ability to enhance T effector (Teff) expansion, function, and T cell memory (Tmem).19 However, the clinical efficacy of IL-2 is hampered by its short half-life (<10 min),20 severe toxicities, and targeting of non-tumor-specific T cells.21 IL-2 also has dual opposing roles on the immune system, promoting immunity through its effects on Teff cells and tolerance through supporting regulatory T cells (Tregs), the latter of which is often a negative prognostic factor for some cancers.22 To avoid these complications, recent formulations of IL-2, including IL-2 muteins, agonist IL-2/anti-IL-2 immunocomplexes, IL-2/IL-2 receptor (IL-2R) fusion proteins (FPs), and pegylated IL-2 biologics, have been developed to increase its half-life and/or alter its cell type selectivity based on targeting different IL-2R subunits.23 Many current efforts in cancer immunotherapy favor using IL-2 biologics with selectivity toward the intermediate affinity IL-2R (CD122/CD132), which preferentially target CD122hi cells, including memory-phenotypic CD8+ T cells and NK cells, while limiting responses by Teff and Tregs that express the high-affinity IL-2R.24 One shortcoming of such IL-2 biologics is that they do not directly stimulate tumor-specific CD8+ T cells that express the high-affinity IL-2R induced by tumor antigens as these cells express lower levels of CD122 than CD8+ memory-phenotypic T and NK cells.25 Another drawback is that CD122/CD132-directed IL-2s have limited potential to expand and enhance tumor-reactive CD4+ T cells, which also express low levels of CD122, and as discussed above importantly contribute to antitumor immunity.26 IL-2-based biologics that shift the selectivity of IL-2 toward the high-affinity IL-2R (CD25/CD122/CD132) circumvent this issue by augmenting specificity toward CD25, which allows for the targeting of recently activated CD4+ and CD8+ Teff cells. A disadvantage of these type of IL-2s is off-target expansion of Tregs, which constitutively express the high-affinity IL-2R.24 Thus, the use of an agonist directed to the high-affinity IL-2R must consider how to enhance tumor-specific immunity and memory while minimizing Treg-dependent suppression of the antitumor responses.
In this study, we employed an FP of mouse IL-2 whose C-terminus is linked to the N-terminus of mouse CD25 (mIL-2/CD25) via a non-cleavable linker.27 28 In this configuration, mIL-2/CD25 exists predominately as non-covalent head-to-tail transdimers. These transdimers do not bind to either the high or the intermediate affinity IL-2Rs and hence are biologically inactive, due to intermolecular interactions of IL-2 with CD25 and because the CD122 and CD132 binding regions of IL-2 are likely buried within the transdimers. However, a small fraction of mIL-2/CD25 transdimers slowly and continuously dissociate into biologically active mIL-2/CD25 monomers, which bind and signal through cell-associated high affinity IL-2Rs. Consequently, at a low dose mIL-2/CD25 is Treg selective, but at a high dose it also stimulates Teff cells that express the high affinity IL-2R.29 Selectivity toward the high affinity IL-2R results because of an inability to readily achieve monomer concentrations that are required to activate cells, for example, memory-phenotypic CD8+ T and NK cells, expressing the intermediate affinity IL-2R. Similar to fusing IL-2 to Ig or other proteins, mIL-2/CD25 bioactivity in vivo exhibits an extended half-life (16–20 hours), but the former do not impart cell type selectivity and increased half-life due to reduced target-mediated clearance.27 28
Here, our strategy was to amplify neoantigen-specific tumor-reactive T cells by limited application of high-dose mIL-2/CD25 that was concurrent with the induction of the high-affinity IL-2R after vaccination with MHC class I-restricted and MHC class II-restricted immunogenic neoantigen peptides from the poorly immunogenic B16-F10 melanoma. Limiting administration of mIL-2/CD25 was designed to enhance Teff activity while minimizing non-specific toxicities and the persistent increases in Tregs observed with repeated administration of low-dose mIL-2/CD25. We show that mIL-2/CD25 promotes vaccine-induced neoantigen-specific T cell expansion, more effectively controls tumors than similar doses of IL-2, and resulted in tumor regression by cooperation between MHC class I and class II neoantigen-specific CD4+ and CD8+ Teff cells.
Materials and methods
Mice
C57BL/6J (JAX stock #000664), CD45.1-congenic C57BL/6 (B6.SJL-Ptprca Pepcb/BoyJ; JAX stock #002014), BALB/cJ (JAX stock #000651), Foxp3DTR (B6.129(Cg)-Foxp3tm3(DTR/GFP)Ayr/J; JAX stock #016958), CD45.2+ TRP-1/Rag1-/- TCR transgenic (B6.Cg- Rag1tm1Mom Tyrp1B-w Tg(Tcra,Tcrb)9Rest/J; JAX stock #005023), and Thy-1.1+ Pmel-1 TCR transgenic (B6.Cg-Thy1a/Cy Tg(TcraTcrb)8Rest/J; JAX stock #005023) mice were purchased from The Jackson Laboratory. Subsequently, CD45.1-congenic C57BL/6, Foxp3DTR, TRP-1, and Pmel-1 mice were bred in our colony at the University of Miami. Female or male mice aged 7–9 weeks were used in these experiments. Mice were housed in a specific pathogen-free facility.
Synthetic compounds and TLR agonists
TRP-1106-130 (TRP-1, SGHNCGTCRPGWRGAACNQKILTVR),30 human gp10025-33 (hgp100; KVPRNQDWL),31 B16-F10 neoantigen peptides (B16-M27, REGVELCPGNKYEMRRHGTTHSLVIHD; B16-M30, PSKPSFQEFVDWENVSPELNSTDQPFL; B16-M44, EFKHIKAFDRTFANNPGPMVVFATPGM; and B16-M48, SHCHWNDLAVIPAGVVHNWDFEPRKVS), and 4T1 neoantigen peptides (4T1-M8, QGVTVLAVSAVYDIFVFHRLKMKQILP ; 4T1-M20, NDEPDLDPVQELIYDLRSQCDAIRVTK; 4T1-M26, AVKEEDSLHWQRPEDVQKVKALSFYQP; 4T1-M27, FAICFSCLLAHALNLIKLVRGRKPLSW; 4T1-M35, KELLQFKKLKKQNLQQMQAESGFVQHV)15 were purchased from CHI Scientific and were ≥95% pure. The peptides were reconstituted as follows: TRP-1, B16-M44, B16-M48, 4T1-M8, and 4T1-M27 in 80% dimethylsulfoxide (DMSO); B16-M27 in 0.1% acetic acid; B16-M30 and 4T1-M20 in 30% ammonium hydroxide; and hgp100, 4T1-M26, and 4T1-M35 in phosphate-buffered saline (PBS). All reconstituted peptides were further diluted in PBS to a concentration of 2 mg/mL. TLR agonists including lipopolysaccharide (LPS) (cat. #L2880), poly (I:C) (cat. #P9582), and gardiquimod (cat. #SML0877) were purchased from Sigma-Aldrich. CpG (cat. #tlrl-1826) was purchased from InvivoGen. All TLR agonist stocks were reconstituted according to manufacturer’s recommendations. Diphtheria toxin (Sigma-Aldrich, cat. #D0564) was reconstituted based on manufacturer’s recommendations and maintained at 4°C. All other reagent stocks were maintained at −20°C. In studies using transgenic TRP-1 or Pmel-1 cells, peptides and TLR agonists were administered intravenously. In polyclonal studies, B16-F10 neoantigens and poly (I:C) were administered subcutaneously.
IL-2-based products
mIL-2/CD25 was obtained from culture supernatants of mIL-2/CD25-transfected CHO cells and purified as previously described.27 Human IL-2 (hIL-2) (Peprotech, cat. #200-02) was reconstituted based on manufacturer’s recommendations. Stocks were stored at −70°C and administered intraperitoneally in Hank’s balanced salt solution (HBSS).
Adoptive transfer and immunizations
Sex-matched TRP-1 CD4+ T cells (CD45.2+) (1×10⁵ or 3×10³ cells) from male TRP-1 mice or Pmel-1 CD8+ T cells (Thy1.1+) (5×10⁵) from female Pmel-1 mice were adoptively transferred intravenously into CD45.1-congenic C57BL/6 mice or Thy1.2+ C57BL/6 mice, respectively. Unless otherwise indicated, mice were immunized 1 day after adoptive transfer with the corresponding peptides, TRP-1 peptide or hgp100 peptide (100 µg) and LPS (10 µg) intravenously. Twenty-four hours after immunization, mIL-2/CD25 (100 µg) was administered intraperitoneally. When indicated, poly (I:C) (50 µg), gardiquimod (100 µg), and CpG (20 µg) were administered intravenously. In studies using B16-F10 or 4T1 neoantigens, the pool of neoantigen peptides (50 µg each) and poly (I:C) (50 µg) were administered subcutaneously on days 0, 7, and 13 and mIL-2/CD25 (50 µg) was administered on days 8 and 14, unless otherwise indicated in the figure legends. To deplete CD8+ T cells, mice received anti-CD8 mAb (100 µg; BioXCell, cat. #BE0223) on days −3 through −1 prior to immunization with neoantigens. In Treg depletion studies, diphtheria toxin (1 µg) was administered intraperitoneally to Foxp3DTR mice a day prior to immunization.
Enzyme-linked immunospot (ELISpot) assay
ELISpot assays were conducted either on days 12 or 18 post-priming with B16-F10 or 4T1 neoantigens following manufacturer’s protocols for the Mouse IFN-γ ELISpot Set (BD Biosciences, cat. #551083). Splenocytes or CD45-enriched lymphoid cells from the tumor microenvironment (TME) were cultured for 22–24 hours at 37°C in the presence of the B16-F10 or 4T1 neoantigens (2 µg/mL) and 10-fold lower numbers of bone marrow-derived dendritic cells (BMDCs) in anti-interferon-γ (IFN-γ)-coated 96-well ELISpot plates. Secretion of IFN-γ was detected using anti-IFN-γ biotinylated antibody (2 µg/mL) followed by addition of Streptavidin-HRP (BD Biosciences, cat. #557630) and AEC Chromogen/Substrate (BD Biosciences, cat. #551951). ELISpots were visualized using ImmunoSpot S6 Universal and quantified using ImmunoSpot V.7.0.15.0 Professional Analyzer DC software.
Generation of BMDCs
Femur bones were collected from C57BL/6J or BALB/cJ mice and muscle tissue was removed from the bones prior to sterilization in a petri dish containing 70% ethanol for 1 min. These bones were then washed by two consecutive immersions in petri dishes containing 1× HBSS for 1 min followed by crushing of the bones with a pestle in complete media (CM) containing RPMI-1640 (VWR) supplemented with 5% FBS, 100 U/mL penicillin, 100 µg/mL streptomycin, 2 mM L-glutamine, and 0.05 mM β-mercaptoethanol. Cells were plated in 100×15 mm petri dishes (VWR, cat. #25,384-342) at a density of 2×10⁶/mL in 10 mL CM supplemented with 20 ng/mL recombinant mouse GM-CSF (rmGM-CSF) (PeproTech, cat. #315-03) and incubated at 37°C. On day 3, 10 mL CM supplemented with 20 ng/mL rmGM-CSF was added to the culture. On days 6 and 8, 50% of the media was centrifugated and the cell pellet was resuspended in 10 mL CM supplemented with 20 ng/mL rmGM-CSF and added back to the culture dish. On day 10, non-adherent cells were obtained from the culture dishes, centrifugated, and re-plated in 10 mL CM supplemented with 10 ng/mL rmGM-CSF and LPS (1 µg/mL) for maturation followed by re-addition of 10 mL fresh CM on day 11. On day 12, BMDCs were lifted using a cell scraper and used for stimulation of T cells in the ELISpot assays.
Flow cytometric analysis
PBMCs or single-cell suspensions from lymphoid and non-lymphoid tissues were stained following red blood cell lysis with 0.2% TRIS (pH 7.6) and 0.75% ammonium chloride ACK lysing buffer solution. Staining of cell surface and intracellular targets was done as previously described.29 Fluorochrome-labeled and biotin-labeled antibodies and fluorochrome-streptavidin conjugates used in this study, with sources and staining concentrations, are listed in online supplemental table 1. Samples were run on BD LSR-Fortessa-HTS or BD LSR-II flow cytometers and data were analyzed using FACSDiva (V.8.1) or FlowJo (V.10.6.1) software. PBMCs were quantified by running exactly 50 µL of blood per sample on the flow cytometers. The total events were used to calculate PBMCs/mL of blood.
Supplemental material
mIL-2/CD25 and anti-CD25 competition assay
TRP-1 splenocytes (2×10⁶/mL) were cultured in CM with TRP-1 peptide (2 µg/mL) for 48 hours at 37°C in a 7% CO2 incubator. The cells were then harvested, washed three times in 1× HBSS, and incubated on ice for 20 min in CM containing mIL-2/CD25 (0, 15, and 30 µg/mL). Following incubation, the cells were washed three times in 1× HBSS and stained with CD25 (PC61)-PE/Cy7 as previously described.29
Ex vivo pSTAT5 assay
Single-cell suspensions of spleens were immediately prepared in ice-cold 1× HBSS. Following dissociation, the cell suspension (200 µL) was fixed by transferring to a tube (10×75 mm) containing ice-cold 1.6% paraformaldehyde in CM and incubated at 37°C for 10 min. The fixed cells were then permeabilized in 100% methanol on ice for 30 min. Following permeabilization, the cells were washed twice with washing buffer (2 mL) containing 0.5% bovine serum albumin and 0.02% sodium azide. Cells were then stained with extracellular and intracellular antibodies for 1 hour at room temperature. After staining, the cells were washed twice with washing buffer and resuspended in 250 µL washing buffer for flow cytometric analysis.
Intracellular cytokine assay
IFN-γ, TNF, and IL-2 production was tested as previously described.29 Briefly, splenocytes (1×10⁶/mL/well) were cultured in 24-well plates with TRP-1 peptide (2 µM) and BD GolgiStop (1 µL) (cat. #554724) in CM at 37°C for 4 hours prior to staining for flow cytometric analysis.
In vivo tumor model
B16-F10 melanoma and 4T1 mammary carcinoma cells were purchased from American Type Culture Collection (ATCC) and maintained as recommended. Cells were tested and verified to be negative for mycoplasma and other pathogenic agents. On initial thawing of the tumor cells, they were expanded and aliquots were frozen to allow use of low passage cells throughout the study. The thawed cells were maintained in culture for less than 2 weeks. B16-F10 (1×10⁵) were implanted subcutaneously into the rear flank of C57BL/6J or CD45.1-congenic C57BL/6 mice. 4T1 (1×10⁴) were implanted orthotopically in the mammary fat pad of BALB/cJ mice. Tumor growth was monitored by measuring two opposing diameters with calipers. Results are presented as tumor volume (mm3), where volume was calculated using the formula: (L x W2)/2 where L=length and W=width. In survival studies, mice were sacrificed when tumor volume reached approximately 2000 mm3 or one of the diameters measured reached 20 mm. To quantify 4T1 metastatic nodules, lungs and intestines were collected and submerged in Bouin’s solution (Sigma-Aldrich, cat. #HT10132-1L) for 48 hours prior to counting.
Analysis of tumor-infiltrating lymphocytes
In studies analyzing the TME of TRP-1 transferred mice, B16-F10 tumors were established for 13 days prior to adoptive transfer and tumor-infiltrating immune cells were analyzed on day 5 post-priming with antigen (day 19 of tumor growth). In neoantigen studies, B16-F10 tumors were established for 3 days and the TME was analyzed 18 days post-priming (day 21 of tumor growth). Tumors were prepared for analysis by flow cytometry as previously described.29
Statistical analyses
All data are expressed as mean±SEM. Statistical analyses were conducted using GraphPad Prism V.8 software. For two-group analyses, unpaired t-test, unpaired Welch’s t-test, or Mann-Whitney test was used and for three or more groups, one-way analysis of variance (ANOVA) with Tukey’s test, Welch’s ANOVA with Dunnett’s T3 test, or Kruskal-Wallis test were used when appropriate, after testing for normality (Shapiro-Wilk) and equality of variances (F-test for two groups or Bartlett’s test for three or more groups). Mouse survival was illustrated using the Kaplan-Meier method and analyzed using log-rank (Mantel-Cox) test. Significance is indicated by: *p<0.05, **p<0.01, ***p<0.001, ****p<0.0001.
Results
A single high dose of mIL-2/CD25 amplifies antigen-specific CD4+ T cells
Initially, we assessed the cell type selectivity of mIL-2/CD25. When naive mice were treated with a high dose of mIL-2/CD25 (100 µg) or a similar mole dose of IL-2 (25 µg), both readily stimulated pSTAT5 in Tregs, but only IL-2 supported pSTAT5 increases in CD8+ T cells and was much more active in NK cells (figure 1A). Thus, the reactivity to the high-affinity IL-2R by mIL-2/CD25 is also largely maintained at a high dose.
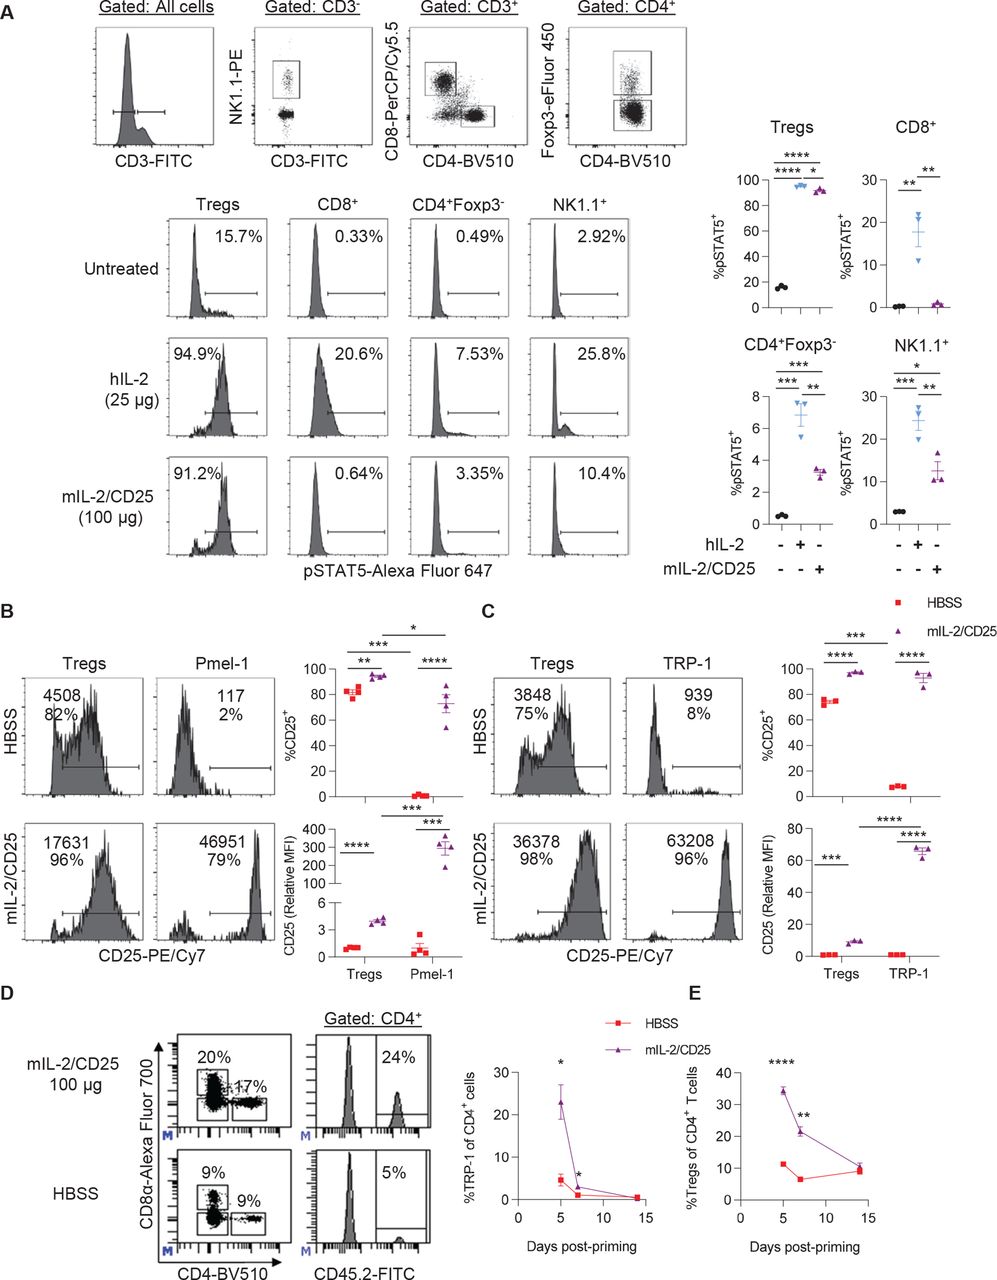
A single high dose of mIL-2/CD25 preferentially stimulates cells expressing the high-affinity IL-2R and amplifies antigen-primed tumor-reactive TRP-1 CD4+ T cells. (A) CD45.1-congenic C57BL/6 mice received a single high dose of mIL-2/CD25 (100 µg) or hIL-2 (25 µg). Splenocytes were assayed for pSTAT5 2 hours post injection with the IL-2 compounds. Representative FACS plots (top) showing the gating strategy for each lymphocyte population, representative histograms for pSTAT5 expression for the indicated cells (bottom), and quantitative data for pSTAT5 expression (right). Data (n=3 mice/group) were analyzed using ordinary one-way analysis of variance and Tukey’s test for multiple comparisons. (B–E) Pmel-1 CD8+ (5×10⁵) or TRP-1 CD4+ (1×10⁵) TCR transgenic T cells were transferred into naive Thy1.2+ C57BL/6 or CD45.1-congenic C57BL/6 mice, respectively. One day post transfer, hgp100 or TRP-1 peptide (100 µg) and LPS (10 µg) were administered. Twenty-four hours post antigen priming, a single high dose of mIL-2/CD25 (100 µg) was administered. (B and C) Histograms (left) containing the frequency of CD25+ cells (bottom value) and CD25 mean fluorescence intensity (top value) and quantitative data (right) for Pmel-1 T cells, TRP-1 T cells, and Tregs in the spleen measured at 18 hours for Pmel-1 or 40 hours for TRP-1 post mIL-2/CD25 administration. Data (n=3–4 mice/group) are representative of two independent experiments and analyzed by unpaired t-test. (D) Representative FACS plots (right) showing gating strategy for CD4+ CD45.2+ TRP-1 T cells and frequency of CD4+ CD45.2+ TRP-1 T cells (left) in the blood on day 5 post-priming. (E) Frequency of CD4+ Foxp3+ Tregs in the blood over time. Data in (D) and (E) (n=7–8 mice/group) were pooled from four independent experiments and analyzed by Mann-Whitney test for each time point. FACS, fluorescence-activated cell sorting; FITC, fluorescein isothiocyanate; hIL, human interleukin; LPS, lipopolysaccharide; hIL-2, human IL-2; mIL-2, mouse IL-2; TRP-1, tyrosinase-related protein-1.
The extent that high-dose mIL-2/CD25 enhanced IL-2R-dependent signaling in CD8+ and CD4+ Teff cells while Tregs also were targeted was assessed based on upregulation of CD25. Pmel-1 or tyrosinase-related protein-1 (TRP-1) T cells were adoptively transferred into B6 mice, and 24 hours later, the mice were immunized with hgp100 or TRP-1 peptide, respectively, and LPS. After another 24 hours, the mice were administered high-dose mIL-2/CD25 (100 µg). CD25 was highly upregulated in Pmel-1 (figure 1B) and TRP-1 T cells 18 and 40 hours later, respectively (figure 1C). In both cases, based on the mean fluorescence intensity, high-dose mIL-2/CD25 upregulated the expression of CD25 to higher levels on these Teff cells than on Tregs. Pretreatment of in vitro activated TRP-1 T cells with mIL-2/CD25 did not affect the detection of CD25, indicating that upregulation of CD25 was unaffected by any surface-bound mIL-2/CD25, as the FP is likely rapidly internalized (online supplemental figure S1). Thus, the stimulation of Tregs by mIL-2/CD25 did not impair the ability of antigen-activated Pmel-1 CD8+ and TRP-1 CD4+ Teff cells to respond to the FP.
We then determine whether mIL-2/CD25 promotes expansion and persistence of transgenic TRP-1 CD4+ T cells. High-dose (100 µg) mIL-2/CD25 increased the frequencies of TRP-1 T cells fivefold by day 5 post-priming. Although a high expansion was achieved with immunization followed by mIL-2/CD25, these cells contracted to baseline levels by day 14 post-priming (figure 1D). As previously observed in our studies using mIL-2/CD25 to amplify Pmel-1 CD8+ T cells,29 Tregs transiently expanded and contracted to baseline levels by day 14 (figure 1E). Thus, the accompanied increase in Tregs also does not prevent substantial expansion of TRP-1 T cells.
The requirement for TLR3, TLR4, TLR7/8, or TLR9 was tested by using the TLR agonists, poly (I:C), LPS, gardiquimod, or CpG, respectively, as vaccine adjuvants in the mIL-2/CD25-mediated expansion of these cells. LPS and gardiquimod, but not poly (I:C) and CpG, increased CD3+ T cells in the blood (online supplemental figure S2A), but LPS was most effective at promoting TRP-1 T cell expansion (online supplemental figure S2B). Poly (I:C) and gardiquimod, but not CpG, also supported TRP-1 expansion. However, poly (I:C) did not globally increase CD3+ T cells in the blood (online supplemental figure S2A), suggesting that it is more selective than gardiquimod toward TRP-1 T cells. These data indicate that signaling via TLR3, TLR4, or TLR7/8 supports vaccine-induced mIL-2/CD25-mediated TRP-1 T cell expansion.
mIL-2/CD25-amplified TRP-1 CD4+ T cells have increased effector function, promote antitumor immunity, and support a more immunogenic TME
When assessed at the peak of expansion, on day 5 post-priming, mIL-2/CD25-amplified TRP-1 CD4+ T cells from the spleen were characterized by high frequencies of activated IL-2-responsive and antigen-experienced T cells as indicated by increased amounts of CD25, CD122, and high levels of CD44 expression. Although the FP increased the number of TRP-1 cells (figure 1D), the frequency of proliferating cells, marked by Ki67, did not increase (online supplemental figure S3A). mIL-2/CD25 also increased the frequencies of IFN-γ+, TNF+, IL-2+, and especially granzyme B+ TRP-1 Teff cells (online supplemental figure S3B).
The antitumor activity of vaccine-induced and mIL-2/CD25-amplified TRP-1 T cells was assessed for the aggressive B16-F10 melanoma experimental model. The FP-amplified TRP-1 T cells substantially delayed the growth (figure 2A) and promoted the rejection of B16-F10 tumors in many mice, with 57% tumor-free survival when compared with tumor-bearing naive or vaccinated mice only (figure 2B). At the time when the majority of control mice were removed from the study due to high tumor burden, most mIL-2/CD25-treated mice remained alive and had small tumors (figure 2C). Thus, the favorable mIL-2/CD25-mediated quantitative and qualitative changes observed in the TRP-1 CD4+ tumor-reactive T cell population supports increased antitumor immunity. Rechallenge of tumor-free mice approximately 4.5 months post-initial challenge led to delayed tumor growth (figure 2D) and enhanced mouse survival (figure 2E) compared with naive mice inoculated with B16-F10. This latter result may reflect TRP-1 CD4+ memory T cells but may more likely be due to memory CD8+ T cells that received TRP-1 T cell help during the primary response,6 as mIL-2/CD25 did not support a vigorous TRP-1 memory response (figure 1D).

mIL-2/CD25-amplified antigen-primed tumor-reactive TRP-1 CD4+ T cells promote anti-tumor immunity to the B16-F10 melanoma. TRP-1 T cells were transferred and immunized with TRP-1 antigen (Ag)/LPS and received mIL-2/CD25 as described in figure 1. Tumor growth (A) and survival (B) curves of mice bearing B16-F10 tumors that were pre-established 2 days prior to the adoptive transfer of TRP-1 T cells. (C) Individual curves of data shown in (A). Data (n=12–14 mice/group) were pooled from two independent experiments and analyzed using the log-rank (Mantel-Cox) test where significance values in (B) correspond to the mIL-2/CD25-treated group compared with the HBSS-treated group. (D and E) B16-F10 re-challenge of mice 133 days post-rejection of an initial challenge with B16-F10 (A). Data (n=4 mice/group) were pooled from two independent experiments and analyzed using the log-rank (Mantel-Cox) test where significance values in (E) correspond to the mIL-2/CD25-treated group compared with the untreated group. As control for tumor growth, naive (untreated) mice were inoculated with B16-F10 at the same time as vaccinated mice for all shown studies. mIL-2, mouse IL-2; HBSS, Hank’s balanced salt solution; LPS, lipopolysaccharide; TRP-1, tyrosinase-related protein-1.
Given the efficacy of high-dose mIL-2/CD25-amplified TRP-1 Teff cells in promoting antitumor immunity to B16-F10, the composition of the TME was evaluated. First, mice were inoculated with B16-F10 cells; 13 day later, TRP-1 T cells were transferred into these mice followed by immunization and then 24 hours later HBSS or mIL-2/CD25 was administered. At 5 days post-priming, mIL-2/CD25 supported a 20.1-fold increase in peripheral TRP-1 T cells (figure 3A) and that was accompanied by a 49.6-fold higher infiltration of CD4+ TRP-1 T cells compared with HBSS-treated vaccinated mice within the TME (figure 3B). These TRP-1 T cells were highly activated as indicated by a high frequency of CD25+ and CD44+ cells, retained their proliferative potential based on Ki67, and were likely highly cytotoxic as shown by increased granzyme B expression. Considering that mIL-2/CD25 supports a 49.6-fold increase in TRP-1 T cells coupled with these being on average 46.8% Ki67+ (figure 3C), this translates into 34.5-fold increase in Ki67+ TRP-1 T cells compared with immunized HBSS-treated controls. Similar to previous findings in mIL-2/CD25-amplified tumor-reactive Pmel-1 CD8+ T cells,29 the frequency of programmed cell death protein-1 (PD-1)+ TRP-1 T cells decreased while cytotoxic T lymphocyte-associated antigen 4 (CTLA-4)+ TRP-1 T cells increased (figure 3C). As both CTLA-4 and PD-1 are readily induced on antigenic stimulation,32 33 these effects on PD-1 are consistent with the findings that sustained IL-2 signaling programs tumor-reactive T cells to resist tumor-mediated programmed cell death ligand (PD-L)1 and PD-L2 inhibition through downregulation of PD-1 on T cells.34 In comparison with HBSS-treated vaccinated mice, Treg numbers increased approximately 5.3-fold within the tumors of mice that received TRP-1 T cells and were treated with mIL-2/CD25 (figure 3D). Nevertheless, the ratio of TRP-1 T cells to Tregs in the tumors also increased approximately 3.8-fold in mIL-2/CD25-treated mice relative to immunization-only treated animals (figure 3E). With respect to host TCR transgenic-negative cells, mIL-2/CD25 treatment also led to a slight increase in CD8+ T cells, CD4+ conventional T cells, NK cells, CD11b+ cells, and Ly6G+ cells but a significant decrease in CD19+ B cells (figure 3F). These findings raise the possibility that the antitumor responses might be a result of a combinatorial effort by the TRP-1 T cells and other cells within the TME.

High-dose mIL-2/CD25 enhances TRP-1 T cells and immune infiltration in the TME. B16-F10 melanoma was pre-established 13 days prior to TRP-1 T cell (1×10⁵) transfer. Twenty-four hours post transfer, the cells were primed with TRP-1 antigen (Ag) and LPS, and mIL-2/CD25 (100 µg) or HBSS was administered 1 day post-priming. Peripheral blood and the TME were assessed 5 days post T cell priming. Untreated mice are control tumor-bearing mice which did not receive TRP-1 Ag/LPS or mIL-2/CD25. Quantitative data showing (A) numbers of TRP-1 T cells in the blood and (B, D, and F) tumor-infiltrating immune cells including (E) ratio of TRP-1 T cells to Tregs in the TME. (C) Representative FACS plots (top) and quantitative data (bottom) showing frequency of the indicated markers on tumor-infiltrating TRP-1 T cells. All data (n=6 mice/group) were pooled from two independent experiments and analyzed using Welch’s unpaired t-test. mIL-2, mouse IL-2; TME, tumor microenvironment; APC, allophycocyanin; CTLA-4, cytotoxic T lymphocyte-associated antigen 4; LPS, lipopolysaccharide; PD-1, programmed cell death protein-1; TRP-1, tyrosinase-related protein-1.
Low frequency of TRP-1 T cells is amplified by high-dose mIL-2/CD25
Tumor antigen-specific T cells constitute a minority, approximately 0.01%, of the total T cell repertoire.18 The preceding studies showed the effects of mIL-2/CD25 on the amplification and antitumor activity after transfer of high numbers of tumor-specific CD4+ T cells, which represents an idealized system. To resemble a physiologic situation, the extent a low frequency of TRP-1 CD4+ T cells responded to mIL-2/CD25 was assessed in a priming and boosting regimen, where mIL-2/CD25 or IL-2 were administered following each boost. In this setting, 3000 TRP-1 T cells were adoptively transferred, which reflect a frequency of approximately 0.01% as a mouse has approximately 3×10⁷ CD4+ T lymphocytes. When administered after each boost, mIL-2/CD25 amplified the numbers of TRP-1 T cells by approximately 484-fold at the peak of the response on day 18 and was more effective than the same molecular dose of IL-2 at promoting both expansion and persistence of CD4+ TRP-1 T cells in the blood (online supplemental figure S4). These results provide a strategy to enhance tumor immunity by polyclonal neoantigen-specific T cells.
High-dose mIL-2/CD25 amplifies vaccine-induced neoantigen-specific polyclonal T cells
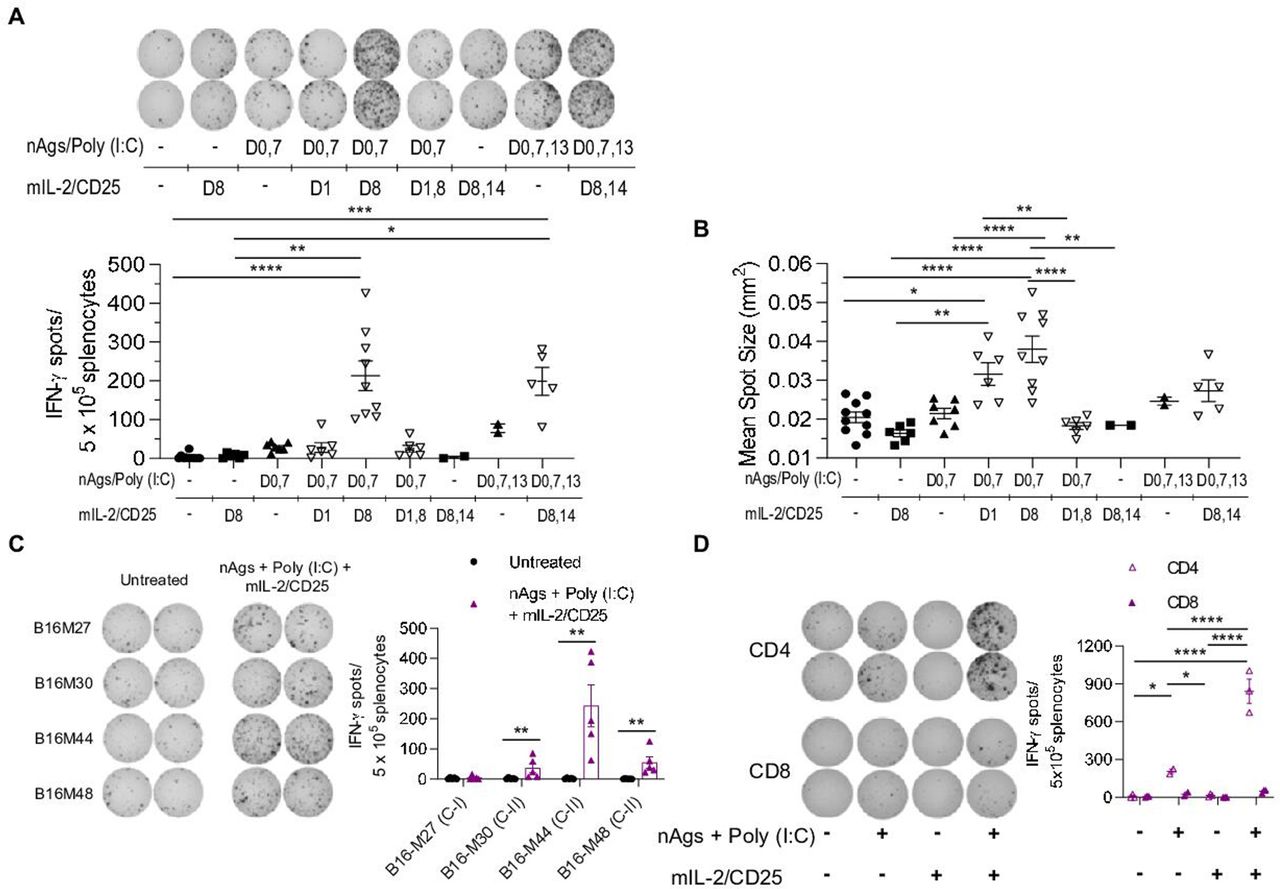
To generate tumor neoantigen-specific polyclonal T cell responses, C57BL/6 mice were immunized with a pool of previously described 27 amino acid long MHC class I- (B16-M27) and MHC class II-restricted (B16-M30, B16-M44, and B16-M48) B16-F10 tumor neoantigen peptides,11 which contain a non-synonymous mutation in position 14, and poly (I:C) as an adjuvant. Using the general strategy developed with the TCR transgenic TRP-1 CD4+ T cells, non-tumor-bearing mice were immunized with the neoantigen peptide vaccine and mIL-2/CD25 was administered 1 day after priming, the boosts, or both the priming and boosts. These regimens were assessed by measuring IFN-γ ELISpots after challenging the spleen cells with the neoantigen peptides in vitro. As expected, mIL-2/CD25 administration after the neoantigen vaccine boosting on day 8 significantly amplified the neoantigen-specific T cells. This response was consistently higher when mIL-2/CD25 was administered again on days 8 and 14 after each booster vaccinations on days 7 and 13 (figure 4A). The amount of IFN-γ produced per cell basis, indicated by IFN-γ mean spot size, was also increased when mice received mIL-2/CD25 after vaccination with neoantigens during the priming or boosting steps (figure 4B).

High-dose mIL-2/CD25 amplifies neoantigen-specific T cells following vaccination with tumor neoantigens. C57BL/6 mice were immunized with a pool of neoantigens (nAgs) and poly (I:C). mIL-2/CD25 (50 µg) was administered 24 hours after the initial priming step, boosting steps, or both after priming and boosting with the neoantigen vaccine, as indicated. IFN-γ ELISpots were determined 22–24 hours post in vitro restimulation with or without nAgs. (A) Representative ELISpots (top), frequency of ELISpots (bottom), and (B) IFN-γ mean spot size data of splenocytes obtained on day 12 or day 18 post-priming and restimulated in vitro with nAgs. Data (n=2–10 mice/group) were pooled from seven independent experiments and analyzed using Kruskal-Wallis test. (C and D) C57BL/6 mice were immunized with nAgs and poly (I:C) on days 0, 7, and 13. mIL-2/CD25 (50 µg) was administered on days 8 and 14. ELISpots were quantified 22–24 hours post in vitro restimulation. (C) Representative ELISpots (left) and quantitative data (right) of day 18 splenocytes restimulated in vitro with individual neoantigens. Data (n=5 mice/group) were pooled from two independent experiments and analyzed using Mann-Whitney test to compare the mIL-2/CD25 group to the untreated group for each neoantigen. (D) Representative ELISpots (left) and quantitative data (right) of ELISpots generated from CD4+ or CD8+ T cells following restimulation with the pool of nAgs. Data (n=2–3 mice/group) are representative of one experiment repeated twice and analyzed using ordinary one-way analysis of variance and Tukey’s test for multiple comparisons. IFN-γ, interferon-γ.
Unexpectedly, administering mIL-2/CD25 after the priming or priming and boost immunizations did not amplify the neoantigen-specific T cells as measured by IFN-γ ELISpots (figure 4A). Similar results were obtained in tumor-bearing mice (online supplemental figure S5). Thus, optimal neoantigen-dependent T cell responses depended on application of mIL-2/CD25 only after booster vaccinations. Treg depletion prior to priming with the neoantigen vaccine did not significantly enhance the frequency of neoantigen-specific T cells (online supplemental figure S6A and B). This finding suggests that the increase of Tregs due to administration of mIL-2/CD25 after the priming or priming and boosting does not substantially affect the expansion of neoantigen-specific T cells.
When the response to the individual neoantigens was quantified via ELISpot, a significant response was only observed for the MHC class II neoantigens, with B16-M44 being the immunodominant peptide (figure 4C). However, ELISpot responses to the MHC class I neoantigen following several immunizations have previously been reported.11 Here, the lack of detectable response to this neoantigen might be due to lower frequencies of responding cells, to the short immunization regimen employed, or to less effective antigen recognition as this peptide must be processed and cross-presented to CD8+ T cells. As expected, the combination of neoantigen vaccine and mIL-2/CD25 optimally enhanced IFN-γ production by CD4+ T cells (figure 4D). These findings indicate that this peptide vaccine is dominated and amplified by neoantigen-specific CD4+ T cells.
mIL-2/CD25-amplified neoantigen-specific T cell responses mediate efficient tumor control and enhance mouse survival
We compared the neoantigen-specific IFN-γ response induced by mIL-2/CD25 or IL-2 by administering the IL-2R agonists following two boosting immunizations with the MHC class I and II neoantigen vaccine in B16-F10 tumor-bearing animals. The same molecular doses of mIL-2/CD25 (50 µg) and IL-2 (12.5 µg) generated similar frequencies of IFN-γ ELISpots (figure 5A). However, mIL-2/CD25 was more effective than IL-2 in delaying growth of pre-established B16-F10 and supporting mouse survival (figure 5B). As IL-2 and mIL-2/CD25 efficiently promoted an IFN-γ response, these data indicate that the IFN-γ ELISpots do not fully recapitulate the magnitude of the antitumor response because mIL-2/CD25 led to more effective tumor control.
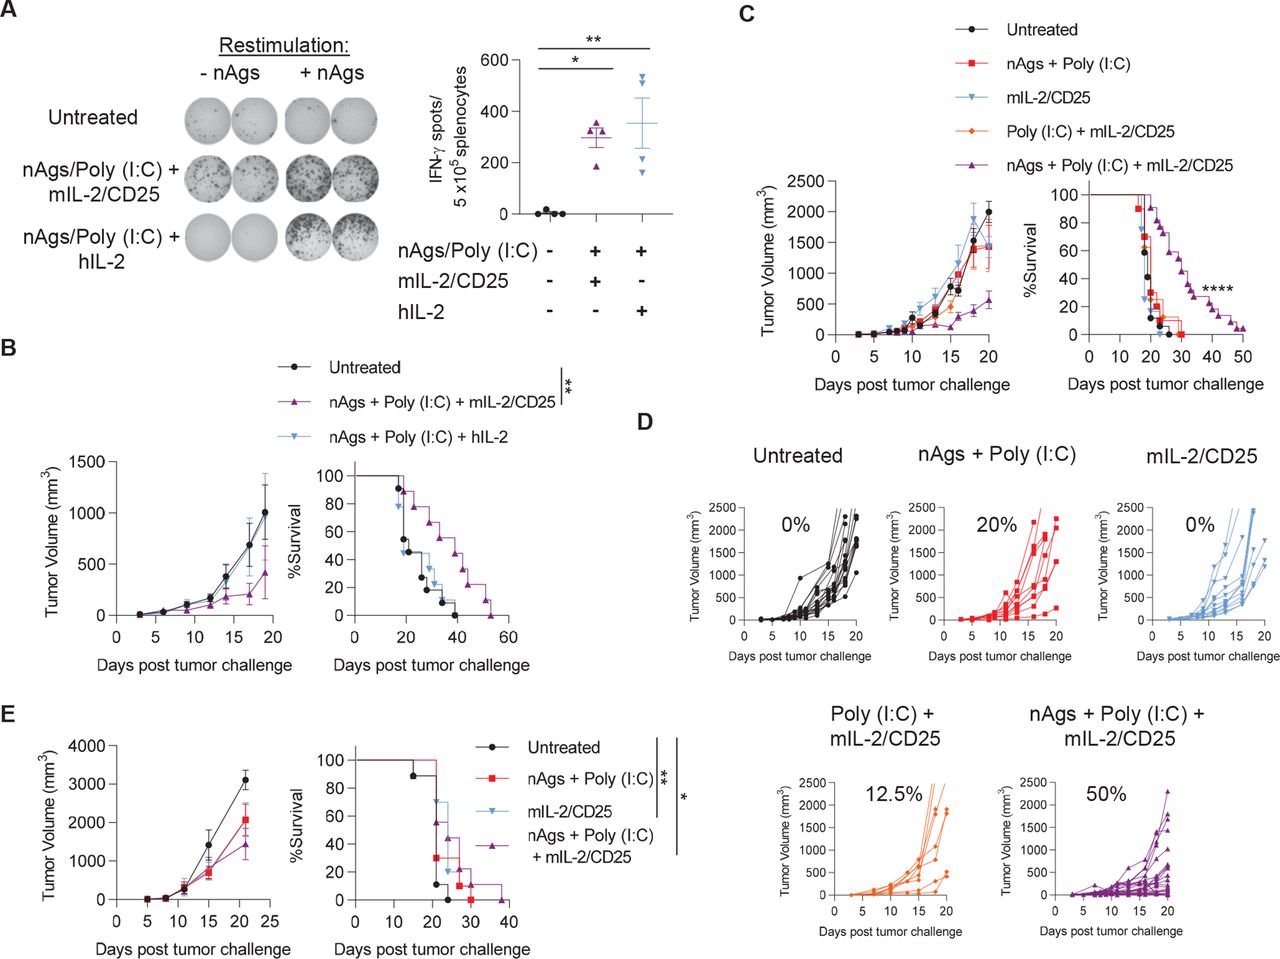
mIL-2/CD25, but not similar doses of IL-2, promote neoantigen vaccine-dependent antitumor immunity. (A) Mice were challenged with B16-F10 on day −3 prior to priming with the pool of B16-F10 neoantigens (nAgs) and poly (I:C) which were administered on days 0, 7, and 13. Then, mIL-2/CD25 (50 µg) or hIL-2 (12.5 µg) were administered during the first and second boosting immunizations, On days 8 and 14. splenocytes were restimulated with the neoantigen pool on day 18 post-priming and IFN-γ ELISpots were quantified 24 hours later. Representative ELISpots are on the left and quantitative data are on the right. Data (n=4 mice/group) were analyzed using ordinary one-way analysis of variance and Tukey’s test for multiple comparisons. (B) Tumor growth (left) and survival curves (right) of mice challenged with B16-F10 on day −3 and treated as in (A). Data (n=9–11 mice/group) were pooled from two independent experiments and analyzed using the log-rank (Mantel-Cox) test. (C, D, and E) Mice were immunized as described for (A) with the neoantigen pool, poly (I:C) and/or received mIL-2/CD25 (50 µg) after the boosting immunizations. B16-F10 tumor growth and survival curves of therapeutically treated mice inoculated with B16-F10 on day −3 prior to the start of vaccination (C and D) or prophylactically treated mice inoculated with B16-F10 on day 21 post-priming (E). Percentages in (D) correspond to the frequency of mice with reduced tumor growth in at least one tumor measurement. Data (C and D; n=8–22 mice/group) were pooled from four independent experiments and (E; n=9–10 mice/group) were pooled from two independent experiments and analyzed using the log-rank (Mantel-Cox) test. hIL, human IL-2; IFN-γ, interferon-γ; mIL-2, mouse IL-2.
For mice with a pre-existing B16-F10 tumor, optimal antitumor response required the vaccine regimen to include neoantigen peptides, poly (I:C), and mIL-2/CD25. Approximately 50% of tumors in the vaccinated cohort receiving mIL-2/CD25 exhibited a decreased rate of tumor growth (figure 5C and D) and enhanced mouse survival, with one mouse remaining tumor-free (figure 5C). Significant delay in tumor growth was observed on secondary re-challenge of this mouse with B16-F10 (data not shown). To determine the persistence of the antitumor T cell response induced by vaccination with mIL-2/CD25, 21 days after the 18-day priming and boosting regimen, mice were inoculated with B16-F10 melanoma. No significant antitumor activity was detected when compared with untreated mice bearing the tumor (figure 5E).
The 4T1 breast tumor is characterized by poor response to most immune stimulation-based treatments and readily metastasizes.35 Immunization of BALB/c mice with a pool of previously described11 4T1 MHC class I-restricted neoantigens and poly (I:C) followed by administration of mIL-2/CD25 after the boosts significantly increased the frequencies of neoantigen-specific T cells (online supplemental figure 7A). When the scheme was applied to tumor-bearing mice, reduction of the primary 4T1 tumor was not observed (online supplemental figure S7B); however, the numbers of metastatic nodules in the lungs and intestines were decreased in vaccinated mice receiving mIL-2/CD25 (online supplemental figure S7C). Together, these data reveal that mIL-2/CD25 enhances neoantigen vaccines to promote antitumor immunity to poorly immunogenic tumors using neoantigens directed toward MHC class I and II.
mIL-2/CD25-mediated antitumor immunity is dependent on multiple cellular drivers
Immunization with the B16-F10 neoantigens and mIL-2/CD25 led only to CD4+ IFN-γ-producing T cell responses when assessed by ELISpot (figure 4D). This result raised the possibility that the mIL-2/CD25-dependent antitumor response (figure 5C and D) was largely mediated by CD4+ T cells. To assess this possibility, we compared the antitumor responses by B16-F10-bearing mice after immunization with the mixture of MHC class I-restricted and class II-restricted peptides versus immunization with only class I-restricted or only class II-restricted peptides, using mIL-2/CD25 after the booster injections. In contrast to immunization with the mix of MHC class I and II neoantigen peptides, immunization with class II, but not class I, neoantigens led to some delay in tumor growth (figure 6A), consistent with some antitumor activity being CD4+ T cell-dependent, but this response was less effective than that seen after vaccination with the complete mix of peptides. Moreover, vaccination with either type of peptide alone did not significantly increase mouse survival (figure 6B).

Neoantigen-induced mIL-2/CD25-driven antitumor immunity is mediated by multiple cellular drivers. C57BL/6 mice were inoculated on day −3 with B16-F10 and were immunized using the regimen described in figure 5. (A) Tumor growth and (B) survival curves of mice receiving poly (I:C) and either the pool of MHC class I and class II nAgs, only MHC class I, or only MHC class II nAgs. mIL-2/CD25 (50 µg) was administered after each boosting immunization. Percentages in (A) correspond to the frequency of mice with delayed tumor growth in at least one tumor measurement. Data (n=4–22 mice/ group) were pooled from four independent experiments and analyzed using the log-rank (Mantel-Cox) test. (C) Survival of mice receiving CD8+ T cell-depleting antibody prior to start of immunization. Briefly, mice were inoculated on day −3 with B16-F10, received CD8-depleting antibody on days −3 through −1, and were immunized with the pool of B16-F10 neoantigens and poly (I:C) as in figure 5. mIL-2/CD25 was administered on days 8 and 14. Data (n=21–27 mice/group) were pooled from five independent experiments and analyzed using the log-rank (Mantel-Cox) test. (D) Representative histograms of expression of MHC class I and class II by B16-F10 tumors on day 18 post-priming of mice immunized as in figure 5. nAgs, neoantigens; HBSS, Hank’s balanced salt solution; MHC, major histocompatibility complex.
To further define the cellular mechanism by which mIL-2/CD25 mediates antitumor immunity in the context of neoantigen vaccines, CD8+ T cells were depleted using antibodies prior to vaccination of tumor-bearing mice with the mix of class I-restricted and class II-restricted neoantigens. Antitumor responses to the mix of peptides were significantly reduced after depletion of CD8+ T cells (figure 6C). This result indicates that neoantigen-specific CD8+ T cells directly contribute to these antitumor effects. As observed for the discordance between the ELISpot and antitumor responses (figure 5A and B), the lack of CD8+ IFN-γ+ T cells indicates that the ELISpot assay likely underestimated the effectiveness of mIL-2/CD25 to amplify neoantigen-specific CD8+ T cells (figure 4D). All together, these findings indicate that CD4+ and CD8+ T cells are important drivers of these antitumor responses. Neoantigen-specific CD4+ T cells may contribute to this response by providing T cell help and acting as effectors that directly target tumor cells. Indeed, immunization with neoantigens and mIL-2/CD25 not only enhanced MHC class I but also MHC class II expression on B16-F10 tumors (figure 6D) and thus these tumors can be targeted by CD4+ and CD8+ CTLs.
mIL-2/CD25 amplifies the neoantigen vaccine-driven immune responses in the TME
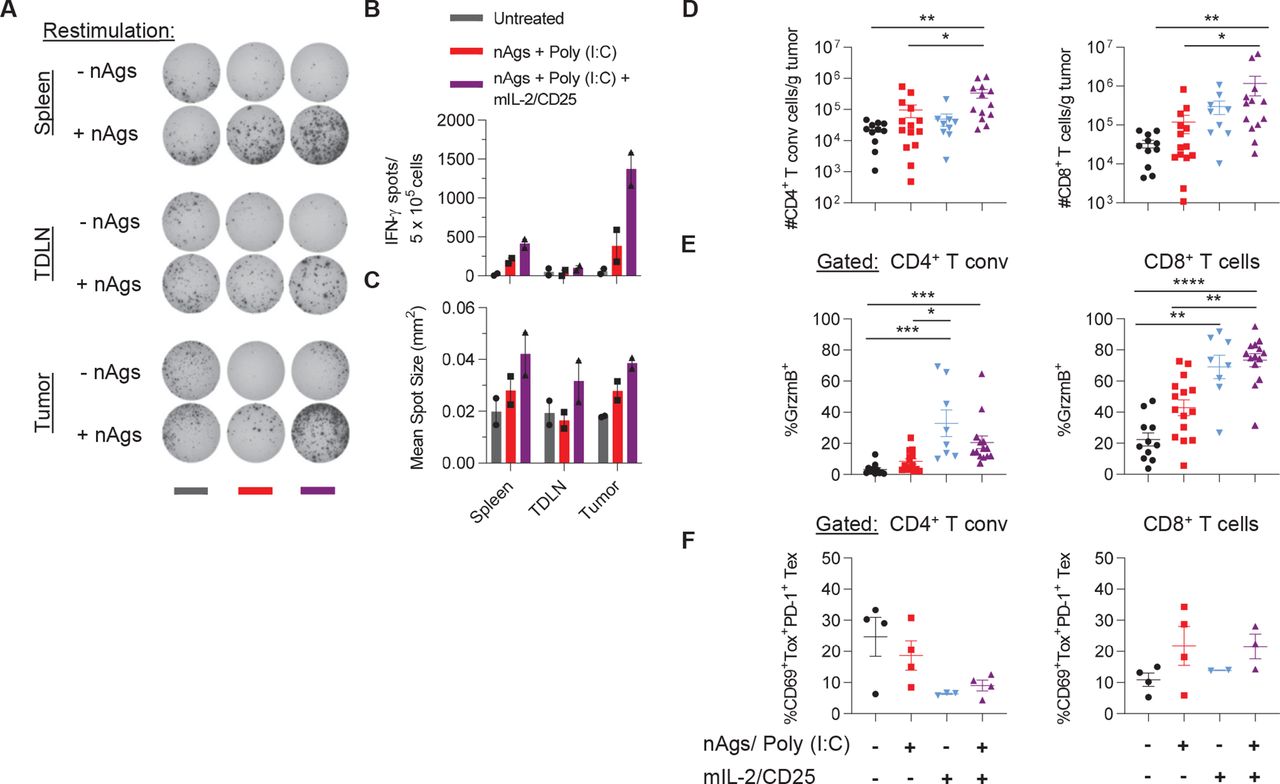
We explored the extent administering mIL-2/CD25 in conjunction with the neoantigen vaccine affected the immune composition in the TME. B16-F10 tumors were excised 18 days post initiation of immunization, which is 4 days after the last boost, as this represented a time when mIL-2/CD25 supported antitumor activity in most mice yet sufficient tumor tissue was present for analysis. To quantify neoantigen-specific T cells in these studies, several tumors were pooled per group to obtain enough cells for the IFN-γ ELISpot assay. For consistency, spleens and tumor-draining lymph nodes (TDLN) were also pooled. Vaccination in conjunction with mIL-2/CD25 supported an approximately twofold to fourfold increase in the numbers of neoantigen-specific T cells in the spleen, TDLN, and tumor. As expected, the highest abundance of neoantigen-specific T cells was found within the tumors of these mice compared with the other analyzed tissues (figure 7A and B). This higher response by mIL-2/CD25 was also accompanied by neoantigen-specific T cells characterized by increased IFN-γ production in all three tissues surveyed (figure 7C).

mIL-2/CD25 enhances neoantigen-specific and other polyclonal T cells in the TME. C57BL/6 mice were inoculated on day −3 with B16-F10 and were immunized using the regimen described in figure 5. Spleen, tumor-draining lymph node (TDLN) and tumors were assessed on day 18 post-priming. (A) Representative IFN-γ ELISpots, (B) frequency of IFN-γ ELISpots, and (C) IFN-γ mean spot size determined 22–24 hours post in vitro restimulation with the pool of B16-F10 nAgs. Data are representative of two independent experiments (n=10–13 pooled mice/group). (D) Mice were treated as above and individual tumors were assessed on day 18 post-priming for numbers of CD4+ Foxp3− T conventional and CD8+ T cells per gram of tumor and (E) frequency of CD4+ Foxp3− T conventional and CD8+ T cells expressing granzyme B (GrzmB) or (F) T exhausted (Tex) coexpressing Tox and PD-1. Data in (D), n=9–14 mice/group and (E), n=8–15 mice/group were pooled from three independent experiments and in (F), n=2–4 mice/group are representative of one experiment and analyzed using Kruskal-Wallis test. IFN-γ, interferon-γ; nAgs, neoantigens; TME, tumor microenvironment.
Within the TME, immunization with the neoantigen vaccine and mIL-2/CD25 increased the numbers of CD4+ Foxp3− conventional T cells and CD8+ T cells (figure 7D) and the frequency of granzyme B+ cells within these populations (figure 7E). Of note, mIL-2/CD25 treatment alone also increased the frequencies of granzyme B expressing cells (figure 7E). Together, these data indicate that this dose of mIL-2/CD25 has the potential to enhance CD4+ and CD8+ CTL activity, but by itself is insufficient to limit tumor growth. Thus, mIL-2/CD25 mediated expansion and heightened effector function of neoantigen-specific T cells leads to a high-quality antitumor response that overcomes the accompanying immunosuppressive TME. In addition, mIL-2/CD25 alone or when combined with the neoantigen vaccine showed slight reduction in the frequencies of exhausted Tox+ PD-1+ CD4+ conventional T cells. Conversely, vaccination with and without mIL-2/CD25 tended to increase the frequencies of exhausted CD8+ T cells (figure 7F). Other cellular changes within the TME (online supplemental figures 8 and 9A,B) include an increase in Tregs with mIL-2/CD25 alone, or with immunization, as expected, and increased numbers of NK cells, Ly6G+ granulocytes, and CD11c+ cells with vaccination and mIL-2/CD25. Within the CD11c+ population, mIL-2/CD25 alone or combined with the neoantigen vaccine showed trends for increased conventional type 1 dendritic cells. The ratio of M1 to M2 macrophages was also increased within the TME of vaccinated mice receiving mIL-2/CD25. No significant changes were observed for the numbers of CD19+ B cells and natural killer T (NKT) cells. Thus, vaccination with neoantigens and mIL-2/CD25 influences other cellular responses in the tumors, which might enhance the antitumor response.
Discussion
mIL-2/CD25 is an IL-2R agonist with selectivity toward the high-affinity IL-2R. At a low dose (5 µg), mIL-2/CD25 shows selectivity toward Tregs and is more effective than IL-2 on a per molecule basis to limit diabetes in non-obese diabetic mice.27 36 In the current study using TRP-1 tumor-specific TCR transgenic CD4+ T cells as a model, we demonstrated that at a single high dose (100 µg) of mIL-2/CD25 administered after vaccination with peptide antigen and LPS amplified antigen-specific CD4+ Teff responses. Past studies also showed that a similar single application of mIL-2/CD25 also acted as a potent vaccine adjuvant to amplify antigen-specific CD8+ Teff and memory responses using nominal antigen-specific OT-I and tumor-specific Pmel-1 TCR transgenic CD8+ T cells as models.29 In both the TRP-1 and Pmel-1 studies, mIL-2/CD25 was more effective than an equimole amount of IL-2 at amplifying these T cells. The mIL-2/CD25-amplified CD4+ and CD8+ Teff cells are characterized not only by a substantial increase in their numbers but also their function due to increased production of cytokines and granzyme B. These vaccine-induced and IL-2R-amplified TRP-1 or Pmel-1 T cells readily rejected B16-F10 melanoma.
A notable difference between the mIL-2/CD25-amplified TRP-1 responses and that previously shown for CD8+ Pmel-129 is that only the latter exhibited amplified T memory cells. The factors accounting for this difference have not been established. However, the requirements to generate CD4+ T memory responses differ from those that lead to CD8+ T memory. CD4+ T memory depends on more prolonged antigenic stimulation and IL-2R signaling during the exponential phase of the primary response than CD8+ T memory.37 Thus, mIL-2/CD25-dependent immunity promotes CD4+ and CD8+ Teff cells but only CD8+ T memory. Somewhat surprisingly, TRP-1 adoptively transferred mice that rejected a primary B16-F10 challenge also rejected a secondary challenge with B16-F10, consistent with the development of immune memory. We do not know whether this effect reflects a TRP-1 CD4+ memory response or TRP-1 CD4+ T cell help that supported CD8+ T memory by endogenous T cells.
An important aspect of the current study is that the findings with TCR transgenic T cells extend to polyclonal endogenous tumor neoantigen-specific T cells. In our study, optimal antitumor responses depended on the neoantigen vaccine containing MHC class I-restricted and II-restricted neoantigen peptides and poly (I:C) and a prime-boost strategy using mIL-2/CD25 only after the boosts. A similar regimen was necessary when using a low, but not a high, frequency of adoptively transferred TRP-1 CD4+ T cells. In another study, vaccination with the B16-M30 or B16-M44 neoantigens and poly (I:C) was sufficient to induce tumor rejection in some mice, but higher amounts of peptides were used.10 Nevertheless, our findings provide an approach that may be applied to multiple vaccine strategies to expand antigen-specific T cells where herein mIL-2/CD25 increased the frequency and function of the antitumor T cells.
When the frequency of polyclonal neoantigen-specific tumor-specific T cells was low, providing mIL-2/CD25 after neoantigen priming did not substantially amplify these T cells. We considered that the low frequency of tumor-reactive T cells at the priming step may be highly susceptible to Treg suppression because both types of T cells are responsive to the FP. However, Treg depletion prior to priming only partially enhanced neoantigen-specific T cell expansion. Thus, other mechanisms such as activation-induced cell death, which occurs during T cell priming and/or IL-2 signaling, might also contribute to the failure of mIL-2/CD25 to act as an adjuvant during priming.38
Our approach to amplify tumor-reactive T cells is a two-step process. First, the high-affinity IL-2R in antigen-specific T cells is induced through TCR signaling by vaccination with the respective antigens. Second, these tumor-reactive T cells are amplified by administering mIL-2/CD25 following CD25 induction. Although high-dose mIL-2/CD25 unavoidably increases Tregs, administration of mIL-2/CD25 1 day following TCR stimulation upregulated CD25 on the tumor-specific TRP-1 and Pmel-1 Teff cells to higher levels than on Tregs. Thus, these tumor-specific T cells are expected to favorably compete with Tregs for the available IL-2R agonist. Due to their much lower frequency, we are not able to follow CD25 expression of recently neoantigen-activated polyclonal T cells. However, a similar mechanism is likely operative for these polyclonal T cells as a substantial increase in neoantigen-specific IFN-γ-producing T cells was noted when mIL-2/CD25 was supplied after the booster injections.
Much current effort to enhance IL-2R signaling in the context of tumor immunity focuses on IL-2R agonists with selectivity toward the intermediate affinity IL-2R. The rationale behind this approach is that it limits expansion of Tregs while broadly promoting CD8+ T cells, some of which are tumor-reactive, and NK cells. An important limitation of selectively targeting the intermediate affinity IL-2R is that it ignores tumor-reactive CD4+ T cells. Antigen-activated CD4+ T cells provide ‘help’ for cytotoxic CD8+ T cells through dendritic cell licensing via the CD40/CD40L interaction, which supports co-stimulation of CD8+ T cells responding to cross-presented antigen,39 40 and cytokines such as IL-2. CD4+ T cell help is essential when the frequency of tumor-reactive T cells is low but is dispensable at high frequencies of antigen-reactive T cell, such as the adoptive transfer of TCR transgenic T cells.41 Tumor-specific CD4+ Teff cells might also directly support antitumor effects through a killing mechanism, as shown for tumor and virally infected cells.42–44 Indeed, our findings indicate that mIL-2/CD25-dependent polyclonal CD4+ and CD8+ neoantigen-specific T cells are required for optimal antitumor responses against B16-F10. The observations that a mixture of class I-restricted and class II-restricted neoantigen peptides were necessary for optimal antitumor responses and that depletion of CD8+ T cells prior to vaccination with this mixture of neoantigens substantially lowered the antitumor effects support this conclusion. mIL-2/CD25-amplified neoantigen-specific CD4+ T cells likely provide help for the neoantigen-specific CD8+ T cells. These neoantigen-specific CD4+ T cells may also directly target the B16-F10 tumor because immunization with only the class II-restricted neoantigen peptides exhibited a delay in tumor growth in some mice. Indeed, mIL-2/CD25 alone or in combination with the neoantigen vaccine increased the frequency of granzyme B+ CD4+ T cells within the TME. In the context of vaccination, some of these CD4+ T cells might be neoantigen-reactive capable of attacking B16-F10 as this tumor expresses MHC class II. Thus, a distinction and potential advantage of targeting the high-affinity IL-2R in cancer immunotherapy is its selective reactivity toward tumor antigen-specific CD4+ and CD8+ T cells that have upregulated CD25 through vaccination with neoantigens.
Targeting the high-affinity IL-2R with mIL-2/CD25 supported antitumor immunity despite the accompanying increase in Tregs. Indeed, there are several scenarios where Tregs may not oppose antitumor responses. With respect to our study and perhaps most importantly, mIL-2/CD25 was applied in conjunction with vaccination. Inflammation is required to elicit potent immune responses but destabilize Tregs.45 Moreover, some inflammatory mediators, such as LPS, lower IL-2R signaling in Tregs.46 Thus, using mIL-2/CD25 shortly after the boost with the neoantigen vaccine yielded a high number of neoantigen-specific Teff cells within the TME and perhaps a favorable ratio of tumor neoantigen-specific Teff cell to Tregs. In addition, mIL-2/CD25 was administered over a relatively short time frame to only transiently increase Tregs. In other settings, Tregs within the TME are a positive prognostic factor by their ability to limit non-specific inflammation,22 that when left unchecked, does not favor an antitumor immune response. Lastly, Tregs have been shown to support CD8+ T cell memory to acute infection with lymphocytic choriomeningitis virus by limiting inflammation and activation of antigen-presenting cells through Treg-derived IL-1047 and this mechanism might facilitate the generation of an antitumor memory response.
Personalized tumor neoantigen vaccines are being explored as a promising therapy to target cancers with high mutational burden. However, the low frequency of pre-existing neoantigen-specific T cells is a limiting factor to unleash the full potential of this immunotherapy. Combination therapies that enhance the number and function of neoantigen-specific Teff and memory cells may avoid this limitation, such as our application of a tumor neoantigen vaccine in conjunction with mIL-2/CD25. Our study used a neoantigen peptide-based vaccine. Nevertheless, varying the delivery of the neoantigens by using a peptide-based or encapsulated modified RNA nanoparticle,48 49 the latter which encodes the desired neoantigen,15 50 may lead to more vigorous CD4+ and CD8+ antitumor neoantigen-specific Teff and Tmem responses for long-term eradication of tumors.
Data availability statement
Data are available upon reasonable request. All data relevant to the study are included in the article or uploaded as supplementary information.
Ethics statements
Patient consent for publication
Ethics approval
Animal studies were approved by the Institutional Animal Care and Use Committee at the University of Miami (Protocol 18-147).
Acknowledgments
We thank Aixin Yu, Stefano Rinaldi, Celeste M. Sanchez, Brett Schrand, and Norman Altman for technical assistance, Mary Struthers and Francisco Ramirez-Valle at Bristol Myers Squibb for critically reading the manuscript, Patricia Guevara, Jay Enten, and Shannon Saigh from the Flow Cytometry Core of the Sylvester Comprehensive Cancer Center (supported by NIH P30CA240139), and the Miami Center for AIDS Research (CFAR, P30AI073961) for ELISpot data support.
References
Supplementary materials
Supplementary Data
This web only file has been produced by the BMJ Publishing Group from an electronic file supplied by the author(s) and has not been edited for content.
Footnotes
Contributors Conception and design: RH, TRM; production and validation of mIL-2/CD25: ASS; acquisition of data: RH, KML, SH; analysis and interpretation of data: RH and TRM; manuscript writing: RH and TRM. All authors edited and approved the manuscript.
Funding This research was supported by funding to TRM from the NIH (R21CA195334), Sylvester Comprehensive Cancer Center at the University of Miami, and Bristol Myers Squibb.
Competing interests The University of Miami, TRM, RH have patents pending on IL-2/CD25 fusion proteins (Wo2016022671A1; TRM) and their use (PCT/US20/13152; TRM, RH) that have been licensed exclusively to Bristol Myers Squibb, and some research on IL-2/CD25 fusion proteins has been supported in part by a collaboration and sponsored research and licensing agreement with Bristol Myers Squibb.
Provenance and peer review Not commissioned; externally peer reviewed.
Supplemental material This content has been supplied by the author(s). It has not been vetted by BMJ Publishing Group Limited (BMJ) and may not have been peer-reviewed. Any opinions or recommendations discussed are solely those of the author(s) and are not endorsed by BMJ. BMJ disclaims all liability and responsibility arising from any reliance placed on the content. Where the content includes any translated material, BMJ does not warrant the accuracy and reliability of the translations (including but not limited to local regulations, clinical guidelines, terminology, drug names and drug dosages), and is not responsible for any error and/or omissions arising from translation and adaptation or otherwise.