Article Text

Abstract
Background Monotherapy with immune checkpoint blockade is ineffective for patients (pts) with microsatellite stable (MSS) metastatic colorectal cancer (mCRC). This study investigates whether the combination of trametinib (T) with durvalumab (D) can alter the immune tumor microenvironment (TME) by successfully priming and activating T-cells.
Methods Open-label, single-center, phase II trial with primary endpoint of immune-related response rate for combination of T+D in refractory MSS mCRC pts (NCT03428126). T is 2 mg/day orally starting 1 week prior to D, which is given 1500 mg intravenously every 4 weeks. Simon 2-stage design used to enroll 29 pts into first stage, requiring a response in two or more pts to proceed to stage 2. Tumor biopsies were collected at baseline (BL) and early on-treatment (OT) at week 4.
Results Twenty nine treated pts include 48% females, median age 48 years (range 28–75), and median prior therapies 2 (range 1–5). No grade (G) 4 or 5 treatment-related adverse events (TRAE). The most common TRAE of any grade was acneiform rash, 17% being G3. One of 29 pts had confirmed partial response (PR) lasting 9.3 months (mo) for an overall response rate of 3.4%. Seven pts had stable disease (SD) and five pts (1 PR, 4 SD) demonstrated decrease in total carcinoembryonic antigen ng/mL (best percentage reduction: 94%, 95%, 42%, 34%, and 22%, respectively). Median progression-free survival was 3.2 mo (range 1.1–9.3 months). Three pts with both liver and lung metastases demonstrated discrepant responses in which clinical benefit was present in the lung metastases but not liver metastases. Comparison of BL and 4-week OT tumor tissue flow cytometry demonstrated no changes in T-cell infiltration but upregulation expression of PD-1 and Tim3 on CD8 T cells. However, expression of PD-1 and Tim3 as single markers and as coexpressed markers was observed to increase OT relative to BL (p=0.03, p=0.06 and p=0.06, respectively).
Conclusions T+D demonstrated acceptable tolerability in pts with refractory MSS mCRC. The response rate in the first stage of the study did not meet efficacy criteria to proceed to the second stage. Specific site of metastatic disease may impact outcomes in novel immunotherapy combination trials.
Trial registration number NCT03428126.
- Immunotherapy
- Clinical Trials, Phase II as Topic
Data availability statement
All data relevant to the study are included in the article or uploaded as online supplemental information.
This is an open access article distributed in accordance with the Creative Commons Attribution Non Commercial (CC BY-NC 4.0) license, which permits others to distribute, remix, adapt, build upon this work non-commercially, and license their derivative works on different terms, provided the original work is properly cited, appropriate credit is given, any changes made indicated, and the use is non-commercial. See http://creativecommons.org/licenses/by-nc/4.0/.
Statistics from Altmetric.com
What is already known on this topic
Monotherapy with immune checkpoint blockade has proven to be ineffective for patients with microsatellite stable metastatic colorectal cancer. Therefore, a critical focus remains to identify novel therapeutic combinations that can alter the tumor microenvironment and promote favorable immune modulation.
What this study adds
This phase II clinical trial investigated the ability of trametinib, a MEK inhibitor, to modulate the immune tumor microenvironment to result in a productive anticancer immune response when combined with the anti-PDL1 agent, durvalumab. This combination was tolerable with one partial response. Though no changes in T-cell infiltration were seen, immune checkpoints on CD8 T-cells were upregulated.
How this study might affect research
Interestingly, three cases with both liver and lung metastases demonstrated discrepant responses in which clinical benefit was present in the lung metastases but not in the liver metastases. This demonstrates the importance of intrapatient organ-specific tumor microenvironment in relation to anticancer immune response.
Background
Over the last decade, immunotherapy has revitalized cancer care and become a backbone of numerous clinical trials. Immune checkpoint blockade (ICB), specifically, inhibitors of the PD-1/PD-L1 and CTLA-4 pathways have emerged as standard of care for many patients with advanced solid and hematologic malignancies. Of note, this approach has resulted in durable response and improved survival outcomes for melanoma and non-small cell lung cancer.1 Unfortunately, distinct from those with deficient mismatch repair (dMMR) proteins or microsatellite instability high (MSI-H) metastatic colorectal cancer (mCRC), isolated ICB has proven to be ineffective for patients with microsatellite stable (MSS) mCRC.2 Therefore, a critical focus remains to identify novel therapeutic combinations that can alter the tumor microenvironment (TME) and successfully promote favorable immune modulation.
The landmark KEYNOTE-177 data revealing superiority of anti-PD-1 therapy over standard of care chemotherapy has effectively positioned ICB as the frontline option for the 4%–5% of patients with mCRC who are MSI-H/dMMR.3 For the majority of patients with MSS mCRC, meaningful disease control can be achieved with oxaliplatin or irinotecan based chemotherapeutic regimens. However, patients will eventually progress after their tumors become resistant to these therapies. There are currently only two approved oral agents in the advanced setting, regorafenib and TAS-102, but these are typically either poorly tolerated or demonstrate limited clinical benefit.4 5 Therefore, novel combination immunotherapeutic approaches for MSS mCRC are desperately needed in the refractory setting.
Previous work has established that the TME is distinct between MSI-H and MSS CRC. Specifically, relative to MSS disease, MSI-high CRC is characterized by increased infiltration by T-cells with both cytotoxic and Th1 phenotypes, but also expression of high levels of inhibitory immune surface markers such as PD-1, PD-L1, CLTA-4.6 MEK inhibition (MEKi) has been shown to alter the immune microenvironment in tumors by enhancing infiltration by effector CD8 +T cells, preventing CD8 +T cell exhaustion, and promoting CD8 +T cell activation.7–9 The effect of MEK inhibition on the priming of naïve T cells remains confounding and may be dependent on the model used. Ebert et al demonstrated that MEKi prevented the ability of naïve T cells to differentiate into memory cells but MEK signaling was not required for memory T cell activation.7 Recently, Verma et al have also shown that inhibition of the MAPK pathway by MEKi induces strong antitumor activity through metabolic reprogramming of effector CD8 +T cells into stem cell-like memory T cells.9 These unique T cells showed enhanced cellular activation, high antigen-specific recall responses and prolonged survival but MEKi was required to occur in parallel with a TCR stimulation or the effect was lost.
In CRC preclinical models, trametinib has been shown to have anti-tumor effects on the CT26 model.10 This murine colorectal tumor cell line contains homozygous KRAS G12D mutation and MAPK1/MET amplifications.10 Liu et al showed that while Trametinib has modest suppression of tumors in vivo, this effect is enhanced by combination with PD-1 or PD-L1 blockade.11 Survival was also improved with combination therapy over either agent in monotherapy.11 Furthermore, when timed with a 1-week lead in with trametinib, a significant improvement in survival was observed.11 Building on this preclinical data, we investigated whether or not a MEK inhibitor in combination with anti-PD-L1 can activate T-cells thereby modulating the immune TME of MSS mCRC and promoting tumor killing.
We hypothesize that the efficacy of immune-checkpoint inhibitors in MSS CRC may be enhanced by improved priming and T-cell activation of the intratumoral environment through systemic administration of MEK inhibition in combination with an anti PD-L1 antibody for treatment refractory MSS CRC.
Methods
Study design and participants
This study is an investigator initiated, prospective, open-label, single-center phase II trial assessing the efficacy and safety of combination intravenous durvalumab with oral trametinib conducted at The University of Texas MD Anderson Cancer Center. Patients over the age of 18 years with biopsy confirmed metastatic adenocarcinoma of the colon or rectum and who had received prior fluoropyrimidine and either oxaliplatin or irinotecan chemotherapy were eligible to enroll. Only patients whose CRC had been characterized as proficient in MMR or MSS on the basis of immunohistochemical (IHC) analysis of MLH1, MSH2, MSH6, and PMS2 or PCR testing were eligible. Patients were also required to have an Eastern Cooperative Oncology Group performance status of 0 or 1 and an estimated life expectancy exceeding 12 weeks.
Patients must have adequate hematologic function for study participation, defined as an absolute neutrophil count ≥1.0 x 10⁹ /L, absolute lymphocyte count ≥0.5× 10⁹ /L, platelet count ≥100×109 /L, and hemoglobin level ≥9.0 g/dL. In addition, patients must have had adequate renal function (defined as an estimated creatinine clearance >30 mL/min according to the Cockcroft-Gault formula) and adequate hepatic function (defined as a total bilirubin level ≤1.5 × the upper limit of normal (ULN), an aspartate aminotransferase (AST) level ≤2.5 × ULN, and an alanine aminotransferase (ALT) level ≤2.5 × ULN). If liver metastases were present, an AST level ≤5.0 × ULN and an ALT level ≤5.0 × ULN were acceptable. Patients could not have had prior exposure to an immune checkpoint inhibitor or any other antineoplastic immunomodulatory agent.
Procedures
At trial initiation, the first patients were enrolled at the target doses for the combination durvalumab and trametinib with durvalumab at 1500 mg q4w and trametinib at 2 mg orally daily. Two de-escalation dose levels of trametinib (1.5 mg, 1 mg) were present with maximum tolerated dose (MTD) determined as the dose level with <2 DLTs out of six patients. Trametinib (T) was administered 2 mg/day orally starting 1 week prior to durvalumab (D) at 1500 mg intravenously every 4 weeks. Patients underwent radiographic restaging studies every 8 weeks. Mandatory biopsies were collected prior to therapy initiation (baseline, BL) and early on-treatment after 4 weeks (OT) for 15 patients at the MTD. Consensus molecular subtyping (CMS) was performed via a CLIA validated gene expression assay utilizing the NanoString platform on patient primary CRC tumor specimens.12
Outcomes
The primary endpoint was immune-related best overall response rate. Secondary endpoints were safety and tolerability of T+D, progression-free survival (PFS), disease control rate and overall survival (OS) by immune response criteria (iRC).13 Adverse events were evaluated using the National Cancer Institute Common Terminology Criteria for Adverse Events, version 4.0.
Chromogenic IHC analysis
We performed singlet chromogenic immunohistochemistry to detect the protein expression of PD-L1. Briefly, tissue sections (4 µm) were stained in a Leica Bond Max automated stainer (Leica Biosystems Nussloch). The tissue sections were deparaffinized and rehydrated following the Leica Bond protocol. Antigen retrieval was performed for 20 min with Bond Solution #2 (Leica Biosystems, equivalent EDTA, pH 9.0) or Bond Solution # 1 (Leica Biosystems, equivalent Citrate Buffer, pH6. The primary antibody (PD-L1, clone SP263, Ventana, Cat# 790–4905, ready to use), was incubated for 15 min at room temperature and detected using the Bond Polymer Refine Detection kit (Leica Biosystems) with DAB as chromogen. The slides were counterstained with hematoxylin, dehydrated, and cover-slipped.
The IHC stained slides where scanned with Aperio AT2 scanner (Leica Biosystem) at ×20 magnification; the images were visualized and analyzed with Halo (Indica Lab) image analysis software. The analysis of the expression of PD-L1 was performed by a pathologist in the tumor area with viable malignant cells (MCs). Necrotic areas and areas with artifacts were excluded from the analysis. PD-L1 was evaluated in MCs using a standard microscope approach and reported as percentage of MCs with any positive membrane expression.
Multiplex immunofluorescence
Multiplex immunofluorescence (mIF) analysis was conducted by a pathologist in five intratumoral areas using 660 µm × 500 µm (0.33 mm2) region of interest (ROI) at ×20 magnification to cover a total intratumoral area of 1.65 mm2. In cases where five ROIs did not cover 1.65 mm2 of intratumoral area, additional ROIs were included in the analysis. The final results were expressed as the average cell densities in any given area by mm2 (cells/mm2). The mIF panels utilized are present in online supplemental table S1.14 15
Supplemental material
Flow cytometry staining of fresh tumor samples
When feasible, tumors were subdivided for fresh flow cytometry analysis. Cells were first stained for surface antigens and a live/dead dye followed by fixation and permeabilized for intracellular staining as previously described.16 The antibody resources and dilutions used are listed in online supplemental table S2 and have been previously described.14 Gating was determined by using the fluorescence minus one approach. Samples were acquired using a BD Fortessa X20 and analyzed using FlowJo V.10.0.7. A QC metric of >100 events was utilized as a rule for subgating. The gating strategy is depicted in online supplemental figure 2.
Statistical analysis
Simon two-stage design was used with plans to enroll 29 pts into the first stage, requiring a response in two or more pts in order to proceed to stage 2 (n=15). Median PFS and OS durations (with associated 95% CIs) were estimated according to the Kaplan-Meier method GraphPad software, V.8 was used for statistical analyses. For the analysis across flow cytometry, IHC and mIF, patients were stratified by time point only. Analysis was performed using Graphpad Prism V.9.0.0.
Results
Patient characteristics
Between November 2018 and December 2020, 29 patients were enrolled to the first stage and due to only one response the study did not proceed to the second stage. BL patient and tumor characteristics of the 29 patients enrolled can be found in table 1. Key demographics of patients include 48% females, median age 48 years (range 28–75), and median prior therapies 2 (range 1–5). CMS were performed on the primary CRC in 23 pts: 12 CMS2, 2 CMS3, and 9 CMS4.
Patient demographics
Adverse events
No grade (G) 4 or 5 treatment-related adverse events (TRAE) occurred (table 2). The most common TRAE of any grade was acneiform rash, with 17% being G3. The most significant G2 TRAE included acneiform rash (31%), fatigue (20%), anemia (21%) and elevated ALT (17%). Four patients discontinued treatment due to TRAE.
Most common adverse events
Response
Overall response was 3.4% with the one partial response (PR) lasting for 9.3 months. Stable disease (SD) was present in 7 patients (24%), progressive disease in 17 patients (58%), and not evaluable in 4 patients (14%). For the 7 patients with SD the median PFS was 5.4 months (range 3.9–9.3 months). 1 patient remained on therapy with persistent SD (>10 months). Five pts (1 PR, 4 SD) demonstrated decrease in total carcinoembryonic antigen (CEA) ng/mL (best percentage reduction: 94%, 95%, 42%, 34%, and 22%, respectively). Median PFS for the entire cohort was 3.2 months (95% CI 2.5 to 3.8 months) with a median OS of 6.9 months (95% CI 5.7 to 8.0 months) (figure 1A,B). Of the 23 patients with known CMS, 4 of 12 CMS2 patients had SD, and 1 of 9 patients with CMS4 had SD. The one PR was CMS unknown. The PR patients course is shown in figure 1C. This patient was RAS/RAF wildtype but had two ATM mutations (E221fs*14 and S2812fs*) but demonstrated circulating tumor DNA (ctDNA) increase following single agent trametinib and then ctDNA reduction with the addition of durvalumab (figure 1D). At the time of progression no MAP kinase escape mutations further supporting an immune related etiology of this patient’s tumor response.

(A) Progression-free and (B) overall survival, (C) exceptional responder—partial response with CEA trend and (D) ctDNA Dynamics while on T+D. CEA, carcinoembryonic antigen; ctDNA, circulating tumor DNA.
Online supplemental figure 1A shows the Kaplan-Meier estimates for OS by liver versus non-liver metastases status. There was a significant difference in OS between the two groups (p=0.03; log-rank test). Online supplemental figure 1B shows the Kaplan-Meier estimates for PFS by liver versus non-liver metastases status. There was no significant difference in PFS between the two groups (p=0.13; log-rank test). Online supplemental table S3 details differences in response stratified by metastatic site.
Efficacy outcomes stratified by site of metastases
Among the total 29 patients, 9 patients had no liver metastases and 15 patients had liver metastases. In relation to liver and lung metastases, 1 patient had liver only metastases, 4 patients had lung only metastases, 6 patients had both liver and lung metastases. In an exploratory analysis of survival outcome by the presence or absence of liver metastases demonstrated an OS of 6.9 months (mo) versus not reached (NR), p=0.03 and PFS of 3.2 mo versus 4.4 mo, p=0.13, respectively (online supplemental figure 1). iRC status by presence or absence of liver metastases demonstrated PR of 0% vs 11%, respectively, although not statistically significant. Due to the occurrence of discrepant responses between patients with lung predominant and liver predominant metastases identified during the conduct of the study, we performed an explorative analysis comparing iRC by site of metastatic disease, focusing on six patients with both lung and liver metastases. Of these six patients, overall iRC was PD in five and SD in one. However, when using iRC to each organ site (liver vs lung) for these patients, three patients had discrepant responses with best lung iRC of −96%, −5%, and 6%, while respective liver iRC was 17%, 133%, and 56%. Patients with discrepant lung and liver metastases response to T+D is highlighted in figure 2.

Discrepant responses between lung and liver metastases in patients treated with T+D.
Low expression of PD-L1 within the TME at BL and early OT
In order to understand the impact of this combination on the TME, tumor tissue collected prior to treatment (BL) and at 4 weeks post-therapy initiation (OT) was assessed for changes in PD-L1 expression, immune cell populations and expression of checkpoint receptors and activation markers. FFPE tumor tissue was assessed for PD-L1 expression using chromogenic IHC and by co-expression on MC and myeloid cells (CD68+) using mIF. Of the 12 cases available for BL assessment, 10 had matched OT tumor tissue. PD-L1 expression as detected with the SP263 clone was only detected in 3 cases at BL and not in any OT cases (figure 3A). Representative staining is shown in figure 3B. In addition, mIF staining revealed a low number of EpCAM +MCs expressing PD-L1 that did not change OT (figure 3C,D, n=10 BL cases, 8 OT cases and 6 pairs). Assessment of CD68+ myeloid cells showed that their frequency remained stable across most paired cases and did not significantly change in their expression of PD-L1 (figure 3E,F, p=0.09, n=6 pairs).
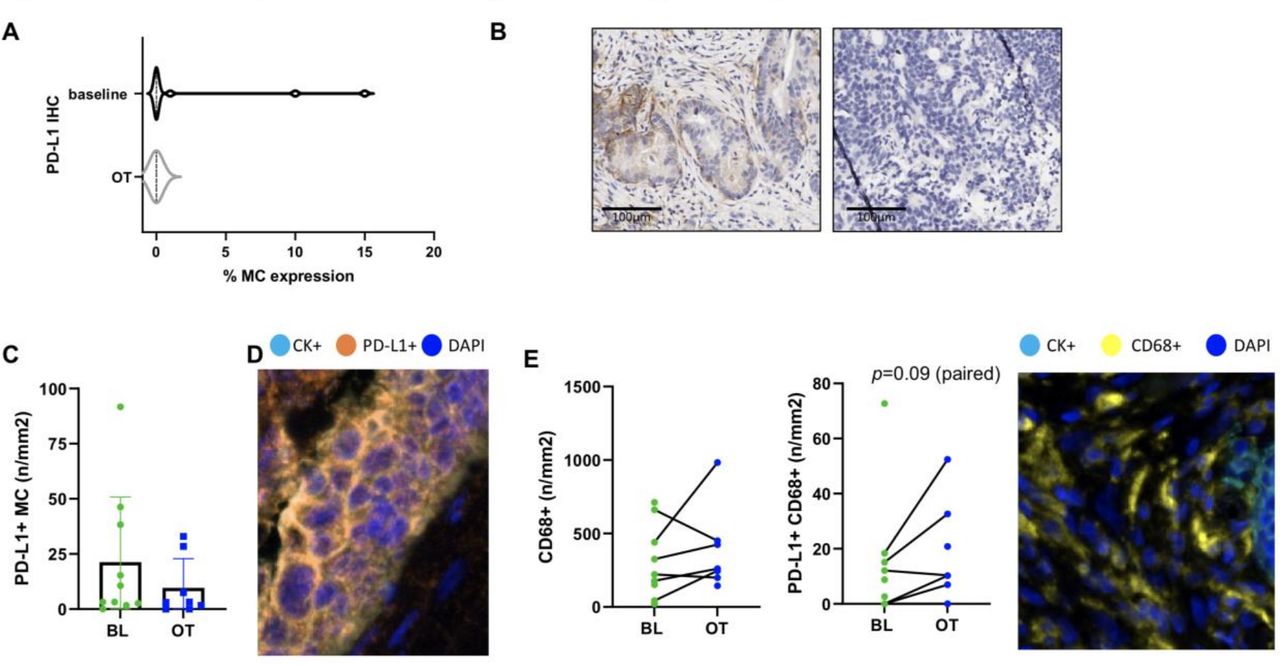
Low PD-L1 expression in the TME prior to therapy and early on-treatment. (A) PD-L1 chromogenic IHC staining at baseline (n=12) and on-treatment (OT) (n=10) as a percentage of malignant cells (MC) with representative images shown in (B). (C) The density of PD-L1+ MCs (n/mm2) as determined using multiplex immunofluorescence staining at baseline (BL) and OT (n=10 BL, 8 OT and 6 pairs). Representative staining is shown in D. (E, F) The density of CD68+ cells and PD-L1+CD68+ cells at BL (green) and OT (blue) is shown respectively with representative staining (n=10 BL, 8 OT and 6 pairs). Statistical comparisons were performed for paired cases only using a paired, parametric t-test. Only one trend was identified and shown. IHC, immunohistochemical; TME, tumor microenvironment.
Changes in immune infiltration early on-therapy
Murine models, both in vitro and in vivo, have demonstrated that MEKi induces either infiltration or expansion of T cells in the TME. Assessment of total T cells (CD3+), cytotoxic T cells (CD3+CD8+) and effector/effector memory T cells (CD3+CD45RO+) showed little change with only two cases showing increased frequencies (of which one patient had stable disease as best response clinically) (figure 4A,B, n=10 BL, eight OT cases with six pairs and figure 4C, n=12 BL, nine OT with nine pairs, respectively). The frequency of CD3+CD8+PD-1+ T cells was generally low at BL with only one case showing greater than 200 cells/mm2 and did not significantly change OT (figure 4D, n=10 BL, eight OT cases with six pairs). Of note, the frequency of T regulatory cells, defined as CD3+CD8-FoxP3+, showed a trend toward increasing OT in the paired cases (figure 4E, p=0.078, n=12 BL, 9 OT cases with nine pairs). The frequency of CD3 +CD8+GzmB+ cells was low at BL and was not observed to increase in paired cases (figure 4F, n=12 BL, nine OT cases with nine pairs).

Changes in immune infiltration densities. Multiplex immunofluorescence staining of TIL phenotype densities at baseline (BL, green) and on-treatment (OT, blue) is shown. The lines indicate paired BL and OT cases. (A) CD3+ (n=10 BL, 8 OT, 6 pairs), (B) CD3+CD8+ (n=10 BL, 8 OT, 6 pairs), (C) CD3+CD45RO+ (n=12 BL, 9 OT, 9 pairs), (D) CD3+CD8+PD-1+ (n=10 BL, 8 OT, 6 pairs), (E) Tregs (CD3+CD8-FoxP3+) (n=12 BL, 9 OT, 9 pairs), (F) CD3+CD8+GzmB+ (n=12 BL, 9 OT, 9 pairs). Representative images are included for phenotypes shown in D–F. Statistical comparisons were performed for paired cases only using a paired, parametric t test. Only one trend was identified and shown. TIL, tumor-infiltrating lymphocyte.
Tumor-infiltrating lymphocyte activation and expression of immune checkpoint receptors
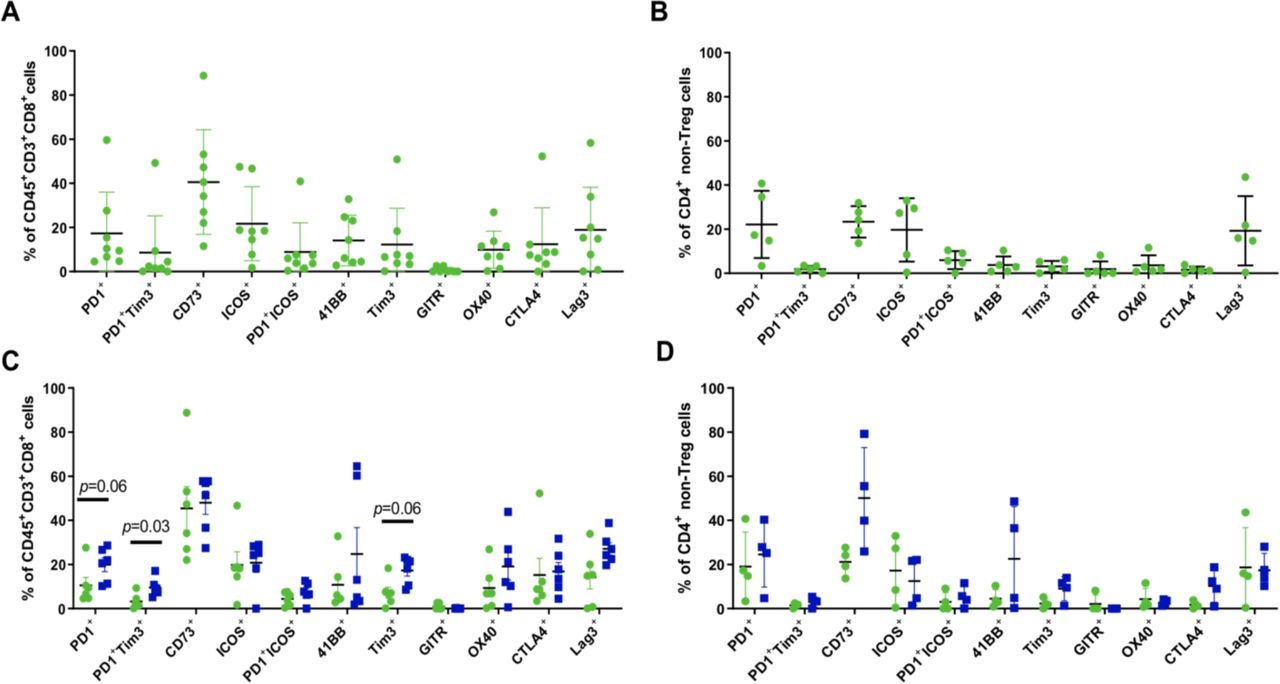
In order to assess the impact of the combination on early immune activation and changes in checkpoint receptor expression on the CD4+ and CD8+ tumor-infiltrating lymphocyte (TIL), flow cytometry was performed in real time at the time of biopsy. The expression of checkpoint receptors PD-1, Tim3, Lag3 and surface CTLA-4 was observed prior to therapy on the CD8 +TIL (figure 5A, n=8). CD73 was expressed at a wide-range but present in each case. In addition, expression of 41BB, OX40 and ICOS was found at BL. Within the CD4 +compartment only five cases had enough events for subgating. T regulatory cells were below the QC metric of 100 events and were excluded from analysis as shown in the gating strategy (online supplemental figure 2). Overall the CD4 +TIL expressed PD-1, CD73, ICOS and Lag3 in most cases (figure 5B, n=5). Six paired cases passed QC for the CD8+ TIL subset for assessment of changes in checkpoint and activation marker expression. CD73 expression was high and remained high. However, expression of PD-1 and Tim3 as single markers and as coexpressed markers was observed to increase OT relative to BL (figure 5C, p=0.03, p=0.06 and p=0.06, respectively). Lag3 expression was also observed to increase but did not reach significance (p=0.16). Within the CD4+ TIL subset only four paired samples passed QC for assessment. CD73 was observed to be strongly induced in three out of four pairs but did not reach statistical significance (figure 5D, p=0.13). Surface expression of CTLA4 was also found to increase OT in 3 out of 4 cases (p=0.25). Other markers assessed were not found to be modulated at the time points assessed.

Increased checkpoint expression on CD8+ and CD4+ TIL subsets early on-treatment. Flow cytometry staining of fresh tumor tissue was performed at baseline and early on-treatment. (A, B) Phenotypic profile of CD8+ (+=8) and CD4+ (n=5) TIL at baseline. Tregs were excluded as shown in the gating strategy and were below the QC threshold set for subgating. (C, D) Paired baseline (green) and on-treatment (blue) cases are shown for CD8+ (n=6 pairs) and CD4+ (n=4 pairs) TIL. P values are indicated if a trend or significance was determined using a paired, non-parametric t-test. TIL, tumor-infiltrating lymphocyte.
Discussion
We investigated the use of a novel combination of anti-PD-L1 with MEK inhibition for patients with refractory MSS mCRC. The rationale for this combination was based on the hypothesis that the efficacy of immune-checkpoint inhibitors in MSS CRC may be enhanced by augmenting priming and T-cell activation in the TME. Our study revealed the combination of MEK inhibition with an anti PD-L1 antibody was safe but demonstrated limited activity with only one PR. Interestingly we identified three cases where intrapatient discrepant tumor responses were seen between lung lesions and liver lesions, demonstrating the organ site specific differences in tumor immune microenvironments.
The one responder in this clinical trial was a patient with lung predominant metastases with nonregional lymphadenopathy. In addition, while acknowledging our small cohort site and exploratory nature of analysis, a non-significant trend was seen favoring an improved PFS in patients without liver as opposed to those with liver metastases, 4.4 months vs 3.2 months, p=0.13. This is noteworthy considering two recent data sets highlighting site of metastatic disease impacting response on novel immunotherapy combination trials for patients with MSS mCRC.17 18 Specifically, non-liver metastases, such as lung appear to respond more favorably to novel immunotherapy combinations using backbones of anti-PD1 or anti-PDL1. The retrospective experience from City of Hope reported outcomes from 97 patients with refractory mCRC exposed to immunotherapy trials in combination with VEGFR, MEK, CTLA-4 and radiation. This revealed that patients without liver metastases (n=43) had a disease control rate of 56% compared with 2% for patients with liver metastases (n=54) (p<0.001). Median PFS for patients with liver metastases was 1.5 months vs 4.5 months for those without liver involvement (HR 4.41, p=<0.001).17 In the REGOTORI clinical trial investigating toripalimab in combination with regorafenib 43 patients with MSS mCRC demonstrated a 15% response rate with a median PFS of 2.6 months (95% CI 2 to 4.3).18 Of note, patients without liver metastases developed a higher objective response rate than those with liver metastases (30% vs 8.7%).18 While further investigation to understand site specific responses to novel immunotherapy trials are needed, one study described a preclinical rationale involving hepatic macrophages and their direct influence on the promotion of T-cell apoptosis.19 Though small in numbers the finding of 3 cases with intrapatient response discrepancies by liver or lung organ site, suggests that further efforts to capture data on organ site-specific immune responses is warranted.
Despite the initial signal noted from an early phase 1 study utilizing immunotherapy with a MEK inhibitor for MSS KRAS mutant mCRC, which reported a response rate of 20%, the subsequent phase III IMblaze370 trial for mCRC using the anti-PDL1, atezolizumab in combination with a MEK inhibitor cobimetinib was a negative trial with no improvement in OS compared with regorafenib.20 21 The randomized phase II CO.26 trial investigated the approach of dual checkpoint inhibition of durvalumab in combination with tremelimumab, a selective human IgG2 monoclonal antibody against cytotoxic T-cell lymphocyte antigen-4 (CTLA-4) compared with best supportive care for refractory MSS CRC.22 With a median follow-up of 15.2 months, this combination had uncertain activity considering no improvement in PFS or response rates but a trend favoring OS benefit (6.6 months vs 4.1 months, HR 0.72; 90% CI, 0.54 to 0.97; p=0.07). Exploratory analysis suggested patients with tumor mutational burden of 28 or greater had the most benefit (HR 0.34; 90% CI 0.18 to 0.63; p=0.004) potentially identifying a selective biomarker, however further confirmatory studies are needed.
In our analysis, although PD-1 expression was observed on TIL prior to therapy, PD-L1 expression was low as detected by IHC and mIF. This suggests that the PD1 axis is not strongly engaged in refractory MSS CRC patients. An unexpected increase in T regulatory cell frequency early OT with little induction of granzyme B or CD45RO was seen, which is in direct contrast to what has been previously observed in murine models. Although Ebert et al and Verma et al disagree on the effect of MEKi on the ability of T cells to be primed, they both agree that antigenic stimulation in the context of concurrent MEK inhibition is important. One possibility that could explain our lack of change in T-cell frequencies could be due to the fact that we cannot control antigenic stimulation in this setting. Combinations of MEKi, checkpoint blockade and anti-tumor vaccination could overcome this potential limitation.
While we did not observe an increase in granzyme B or CD45RO expressing T cells early OT, we did observe interesting phenotypes at BL. While the CD4 compartment appeared to mainly express PD-1, ICOS, CD73 and Lag3, the CD8+ TIL expressed a wide-range of activation and suppressive markers and a high expression of CD73. While these data are confounded by a small number of patients with paired biopsies, CD8+ TIL were found to upregulate PD-1 and Tim3 which is the opposite of what would be expected based on murine models. In addition, the CD4+ TIL were also found to highly upregulate CD73 in the three out of four paired cases assessed. CD73 is an extracellular ectonucleotidase that plays a role in the adenosine immunosuppressive pathway, inhibiting T-cell activation and proliferation.23 Interestingly, preclinical models in CRC reveal CD73 is upregulated on tumor-associated myeloid-derived suppressor cells (MDSC) via TGF-ß inhibiting T cell and NK cell activity.24 These models have shown CD73 deletion increases CD8 +T cells and IFN-γ production to suppress growth as well as reduction of CD73 on CD4 +Foxp3+Tregs playing a critical role in reestablishing antitumor immunity.25 Therefore, CD73 is believed to be involved in the underlying immunosuppressive TME of CRC.26 Further investigation of the therapeutic targeting of CD73 as a viable therapeutic partner for continued novel immunotherapy approaches in MSS CRC may be warranted.
The CMSs 1–4 have emerged as a novel approach to characterize mCRC.27 Though limited by sample size this trial did find that 4 of 12 CMS2 patients demonstrated SD as best response, while only 1 of 9 CMS4 patients demonstrated SD as best response. In contrast to CMS2 tumors, which are characterized as having an ‘immune-desert’ TME, CMS4 tumors reveal a high expression of genes associated with Treg cells, MDSCs, monocyte-derived cells and TH17 cells, all contributing to the persistence of an ‘immune-excluded’ TME.27
In conclusion, while the combination of T+D in our study demonstrated acceptable safety and tolerability for patients with refractory MSS mCRC, predetermined efficacy criteria were not adequate to allow for enrollment to the second stage. Though hypothesis generating three findings from this study suggest that the site of metastatic disease may appear to be relevant in MSS mCRC: one patient with PR had lung predominant metastases, a non-significant trend demonstrated improved PFS in non-liver metastases patients, and intrapatient lung and liver organ site responses were seen in three patients. Further investigation into site specific clinical trial design may be warranted for patients with refractory MSS mCRC. Additional efforts to increase utilization of CMS characterization in novel mCRC immunotherapy clinical trials may provide valuable correlative clues for improved understanding of treatment activity or lack thereof.
Data availability statement
All data relevant to the study are included in the article or uploaded as online supplemental information.
Ethics statements
Patient consent for publication
Ethics approval
This study involves human participants and was approved by MD Anderson IRB #2017-0514. Participants gave informed consent to participate in the study before taking part.
References
Supplementary materials
Supplementary Data
This web only file has been produced by the BMJ Publishing Group from an electronic file supplied by the author(s) and has not been edited for content.
Footnotes
Twitter @benjohnson1112, @VanMorrisMD, @dra_cells
Contributors All authors were involved in the planning, conduct, and reporting of the work described in this article. BJ, CLH and MJO are guarantors of this work.
Funding Astra Zeneca provided the study drugs and provided funding to MD Anderson Cancer Center for study conduct. This work was supported through a Medimmune/Astra-Zeneca MD Anderson Cancer Center alliance, by the National Cancer Institute through both the Cancer Center Support Grant P30CA16672 (Institutional Tissue Bank (ITB) and Research Histology Core Laboratory (RHCL), and SPORE Grant P50CA221707, and supported by the generous philanthropic contributions to The University of Texas MD Anderson Cancer Center Moon Shots Program. Adaptive Patient-Oriented Longitudinal Learning and Optimization (APOLLO) Moonshot Program, Strategic Alliances and the Translational Molecular Pathology Immunoprofiling lab (TMP-IL) at the Department Translational Molecular Pathology, the University of Texas MD Anderson Cancer Center, and the National Cancer Institute (NCI) Cooperative Agreement U24CA224285 (to the MD Anderson Cancer Center CIMAC).
Competing interests BJ has a consulting or advisory role with Gritstone bio, Incyte, Taiho Oncology and Insmed Oncology. He has received research support from Bristol Myers Squibb, Syntrix and Gateway for Cancer Research. CLH reports speaker’s fees from the Society for Immunotherapy of Cancer, serves as an advisory board member for Briacell and the Mesothelioma Applied Research Foundation, has received personal fees from Nanobiotix and receives funding to the MD Anderson Cancer Center from Iovance, Sanofi, Dragonfly Therapeutics, and BTG outside the submitted work. EV has a consulting or advisory role with Janssen Research and Development and Recursion Pharma. He has received research support from Janssen Research and Development. CE has a consulting or advisory role with Bayer, Boston Scientific, GSK, Halio Dx, J&J, Merck, and Natera. MJO has a consulting or advisory role with Phanes therapeutics, Pfizer, Merck, Glaxosmithkline, 3D Medicine, Nouscom, Gritstone bio, Tempus, Roche. He has received research support from Roche, Merck, BMS and Astrazeneca.
Provenance and peer review Not commissioned; externally peer reviewed.
Supplemental material This content has been supplied by the author(s). It has not been vetted by BMJ Publishing Group Limited (BMJ) and may not have been peer-reviewed. Any opinions or recommendations discussed are solely those of the author(s) and are not endorsed by BMJ. BMJ disclaims all liability and responsibility arising from any reliance placed on the content. Where the content includes any translated material, BMJ does not warrant the accuracy and reliability of the translations (including but not limited to local regulations, clinical guidelines, terminology, drug names and drug dosages), and is not responsible for any error and/or omissions arising from translation and adaptation or otherwise.