Article Text

Abstract
Objective It remains controversial whether tumour mutational burden (TMB) or neoantigens are prognostic markers in hepatocellular carcinoma (HCC). This study aimed to define the function of TMB or neoantigens in antitumour immunotherapy.
Design Neoantigens of patients (n=56) were analysed by pVAC tools with major histocompatibility complex-1 (MHC-I) algorithms based on whole exome sequencing and neoantigens with mutant type IC50 <50 nM were defined as high-affinity neoantigens (HANs). Patients were segregated into HAN-high/low groups by median of HAN value, and overall survival (OS) was analysed. Autologous organoid killing model was developed to clarify the antitumour activity of HANs.
Results The value of HAN showed a better correlation with OS (p=0.0199) than TMB (p=0.7505) or neoantigens (p=0.2297) in patients with HCC and positively correlated with the frequency of CD39+CD8+ tumour infiltrating lymphocytes (TILs). Furthermore, HAN-specific CD8+ T cells were identified in CD39+CD8+ TILs, which showed better antitumour activity in HAN-high versus HAN-low group. In addition, more effective HAN peptides were identified in HAN-high versus HAN-low group. Besides, flow cytometry data showed that in fresh tumour, CD39+PD-1intCD8+ TILs displayed an effector phenotype and stronger antitumour activity in HAN-high versus HAN-low group. More importantly, patients in HAN-high versus HAN-low group showed a better prognosis after anti-PD-1 therapy.
Conclusions Our study first demonstrates that HAN value positively correlates with better OS in patients with HCC. HANs trigger antitumour activity by activating tumour-reactive CD39+CD8+ T cells, and patients in HAN-high group benefited more from anti-PD-1 therapy than HAN-low group. These findings may provide a novel strategy for personalised antitumour therapies for HCC.
- hepatocellular carcinoma
- immunotherapy
- mutation screening
- T lymphocytes
Data availability statement
Data are available on reasonable request. All data relevant to the study are included in the article or uploaded as supplementary information. The data used to support the findings of this study are included within the article.
This is an open access article distributed in accordance with the Creative Commons Attribution Non Commercial (CC BY-NC 4.0) license, which permits others to distribute, remix, adapt, build upon this work non-commercially, and license their derivative works on different terms, provided the original work is properly cited, appropriate credit is given, any changes made indicated, and the use is non-commercial. See: http://creativecommons.org/licenses/by-nc/4.0/.
Statistics from Altmetric.com
Significance of this study
What is already known on this subject?
Neoantigens are products of somatic non-synonymous mutations of tumour gene, which can be presented by antigen-presenting cells to elicit antigen-specific T cell response.
It remains controversial whether neoantigens could be implied as the predictive marker of efficacy of prognosis in hepatocellular carcinoma (HCC).
CD39 is a novel biomarker to distinguish tumour-specific CD8+ T cells from bystander CD8+ T cells.
What are the new findings?
The value of high-affinity neoantigen (HAN), but not tumour mutational burden or neoantigen, correlated with better overall survival and the frequency of CD39+CD8+ tumour infiltrating lymphocytes (TILs) in HCC.
HAN-specific CD8+ T cells were identified in CD39+CD8+ TILs, which showed better antitumour activity in HAN-high versus HAN-low group, and more effective HAN peptides were identified in HAN-high group.
CD39+PD-1intCD8+ TILs displayed an effector T cell phenotype and stronger antitumour activity in HAN-high versus HAN-low group.
Patients in HAN-high versus HAN-low group showed a better clinical outcome after anti-PD-1 therapy.
How might it impact on clinical practice in the foreseeable future?
The identification of HANs responsible for personalised antitumour therapies and characterisation of their role in this process may help us to elucidate mechanisms of rejection and to identify prognostic markers and screen suitable patients with HCC for anti-PD-1 therapy.
Introduction
Hepatocellular carcinoma (HCC) accounts for nearly 90% of primary cancers and malignant tumours of the liver and is the second leading cause of death worldwide.1At present, there has been no satisfactory effective indicators for prognosis of HCC treatment. Recently, tumour mutational burden (TMB) is considered as a biomarker to predict the therapeutic effect of prognosis in some cancers.2 3 However, the value of TMB is low in patients with HCC, and no significant correlation has been found between TMB and prognosis.4–6 Therefore, the predictive value of TMB in HCC is uncertain.
Neoantigens are products of somatic non-synonymous mutations of tumour genes, which can be recognised and presented by antigen-presenting cells (APCs) to elicit antigen-specific T cell response.7 Based on Whole exon sequencing (WES), prediction algorithms for major histocompatibility complex-1 (MHC-I) peptide binding affinity have been used to filter out thousands of personalised neoantigens for individual patients.8 However, only a few of candidate neoantigens can efficiently activate T cell antitumour immune response. Therefore, some studies focused on improving the neoantigen screening so as to narrow the scope. For example, Rosenberg et al identified top 2% of epitopes that comprise peptides with high binding affinity in 10 patients with gastrointestinal tumours.9 On this basis, some studies reported that patients can reacquire substantial complete response by injection of the candidate high MHC-I binding affinity neoantigen-loaded dendritic cells (DC) peptides in metastatic thymoma.10 In addition, transfer of candidate neoantigen-activated specific autologous T cells has shown impressive efficiency in achieving the durable regression of metastatic breast cancer, colon cancer, bile duct cancer and so on.9 11 12 However, whether high-affinity neoantigens (HANs) could trigger antitumour activity of patients with HCC remains unknown.
CD8+ T cells plays an important role of specifically recognising and killing tumour cells via releasing cytotoxic molecules in antitumour immune response, whereas only part of CD8+ tumour infiltrating lymphocytes (TILs) can recognise tumour-specific neoantigen and achieve targeted killing. Recently, increasing evidence has shown that CD39 is a marker of tumour-specific T cells,13–15 though it was considered to be a biomarker of exhausted T cells in some studies. They found that CD39+CD8+ T cells had stronger antitumour ability than CD39−CD8+ T cells in six different malignant tumour types.14 CD39 was identified as a biomarker to distinguish tumour-specific CD8+ T cells from bystander CD8+ T cells.16 However, whether CD39 is associated with neoantigen-specific CD8+ T cells that mediate antitumour immune response in the HCC needs to be studied.
Here, we found that the value of HAN showed a stronger correlation with better overall survival (OS) than TMB or neoantigens did in patients with HCC, and it was positively correlated with the frequency of CD39+CD8+ TILs. More tumour-specific peptides were identified in HAN-high group than those in HAN-low group, which could activate tumour-reactive CD39+CD8+ T cells. Therefore, our study revealed the antitumour activity of HANs in patients with HCC, providing new insights regarding prognosis prediction and personalised HAN immunotherapy in HCC.
Materials and methods
From 2017 to 2020, needle biopsies and blood samplings were taken from a cohort of 56 patients with HCC in The First Affiliated Hospital of Sun Yat-sen University. No treatment was taken when needle biopsies was collected. The detailed patients’ data including future treatments were shown in online supplemental table 1). The project was approved with the patient’s informed consent and ethical approval (2018 [43]).
Supplemental material
WES-sequence and neoantigen identification
Collected tumour and blood samples were sent to GenomiCare Biotechnology (Shanghai), Shanghai 201210, China for targeted next generation sequencing analysis. The exome DNA was captured using the SureSelect Human All Exon V7 kit (#5991-9039EN Agilent USA), prepared to library using SureSelectXT Low Input Target Enrichment and Library Preparation system (#G9703-90000 Agilent USA) and sequenced on an Illumina NovaSeq-6000 sequencer (Illumina, San Diego, California, USA) to generate 150×150 bp paired end reads. Image analysis and base calling was done using onboard RT3 software (Illumina, San Diego, California, USA). Somatic single-nucleotide variants, Indel and copy number variation (CNV) were determined using the MuTect/ANNOVAR/dbNSFP31, VarscanIndel and CNVnator software. TMB calculation was based on the protocol of Fondational Medicine.17 Based on its detection protocol of Bayesian methodology, reads with variant allele frequency (VAF)≥5% were preserved. Mutations with VAF greater than 5% made major contribution to TMB, and mutations with VAF <5% were caused by artefacts and usually filtered out before neoantigen prediction according to a FDA summary (PMA: P170019).
Data of WES-sequence above were obtained and sent to Qianyang Biomedical Research Institute, Shenzhen, China for neoantigen sequencing and predicted peptides bioinformatics analysis. All patients’ Phased Somatic VCF files were analysed by software pVACseq limited to MHC-I alleles (HLA-A, HLA-B and HLA-C alleles).18 Epitopes were predicted based on variants from each patient, respectively. In brief, HLA typing was performed using OptiType (V.1.3.3). Based on the HLA alleles, pVACseq module in pVACtools (V.1.0.0) were used to predict the peptides binding to these alleles by using different prediction algorithms (NetMHCpan, NetMHC, NetMHCcons, PickPocket, SMM, SMMPMBEC, MHCflurry and MHCnuggets).18 To get more specific peptides, median score of the eight algorithm results were calculated and regarded as MHC-I binding affinity, which was quantificated as IC50 (nM); then epitopes with IC50 <50 nM were retained.19–21 Peptides with IC50 <50 nM are considered as HANs. Customised peptides were obtained from Sangon Biotech (Shanghai, China).
Survival data and analysis
For the OS analysis, the survival time was calculated from the time of pathogenesis until last contact or death. The censoring proportion of survival data was 21 of 56 patients. We compared OS between low group and high group using the median frequency of all the indicators as a cut point. This cut point could fairly compare all the indicators in discriminating patient survival. For progression-free survival (PFS) analysis to assess the clinical efficiency of anti-PD-1 treatment, the evaluation criterion referred to imRECIST Refining Guidelines22 and the baseline of tumour size was set before the first time of immunotherapy. P values were determined using log-rank test.
Flow cytometry for TILs
Tumour samples were cut into small pieces and digested in RPMI-1640 supplemented with collagenase at 1 mg/mL (#C1889 Sigma USA). Digestion lasted for 1 hour at room temperature and filtered through a 70 µm filter. Single-cell suspensions were surface stained in fluorescence activated cell sorter (FACS) buffer (phosphate buffer solution (PBS), supplemented with 1% fetal bovine serum (FBS)) with the following antibodies for flow cytometric analysis, including FITC Zombie Green (#423 111 Biolegend USA), PE Anti-human CD3 (#344 806 Biolegend USA), APC Anti-human CD8 (#344 721 Biolegend USA), Brilliant Violet 421 Anti-human CD39 (#328 214 Biolegend USA), PE-Cy7 Anti-human PD-1 (#561 272 BD USA). Flow data were analysed by FlowJo V.10.0.
TIL ex vivo expansion and autologous tumour organoid culture
Samples of needle biopsy from patients with HCC were segregated into average two parts. One part was used for TIL expansion. TILs were generated and cultured as previously described.23 Briefly, tumour samples were cut into small pieces in X-Vivo 15 Lymphocyte medium (#04-418Q Lonza Switzerland). IL-2 (#200-02-50 PerproTech USA) at 6000 IU/mL was used for TIL expansion. All cells were cultured at 37°C with 5% CO2 for 2 weeks. After expansion, TILs were collected and sorted as the marker CD39 and CD8 by FACS for the following experiments. Another part of tumour sample was used for organoid culture. HCC organoids were established as the protocol previously described.24 Organoids were passaged approximately every week (not exceed five generations before using). All organoids were regularly checked for mycoplasma contamination using the MycoAlert Mycoplasma Detection Kit (#CUL001B R&D USA).
Preparation of peptide-pulsed antigen-presenting cells (APCs)
Autologous CD14+ DCs were sorted from peripheral blood mononuclear cell (PBMCs) by EasySep Human CD14 Pos Sellection Kit (#17 858 Stemcell USA) and incubated with DC medium (RPMI 1640 medium supplemented with 10% FBS, 2 mM l-glutamine, 800 IU/mL GM-CSF (#300-03-100 Peprotech USA) and 200 U/mL IL-4 (#200-04-50 Peprotech USA). All peptides were synthesised to pulse APCs individually. Autologous DCs were harvested, washed and resuspended at 1.0×10⁶ cells/mL in DC medium and incubated with 10 µg/mL of the individual peptide for overnight at 37°C at 5% CO2. Following pulsing, the APCs were centrifuged, resuspended in fresh DC medium without cytokines in concentration 2×10⁶ cells/mL and used for coculture assays.
TILs and APCs coculture assay and IFN-γ ELISPOT assay
Expanded TILs were incubated with peptide-pulsed APCs at a ratio of 1:2. In addition, no peptide dimethyl sulphoxide (DMSO) pulsed APCs were used as negative control, with OKT3 (#05121-25-500 Peprotech USA) (10 µg/mL) was used as positive control. Before coculture, the IL-2 containing medium for TILs expansion was removed, and the TILs were resuspended in IL-2 free medium to rest for 24 hours. Then 100 µL of TILs and APCs were mixed together for total volume of 200 µL/well IL-2 free medium in 96-well interferon-γ (IFN-γ) ELISPOT plates (#3420–2 hour Mabtech Sweden) for 24 hours. Each ELISPOT plate was scanned and counted using an ImmunoSpot plate reader and associated software (Cellular Technologies).
Organoid killing assay
Organoids were harvested and part of the organoids were dissociated into single cells and counted to infer the number of tumour cells to allow a effector:target (E:T)=10:1 ratio. Tumour organoids were resuspended in IL-2 free human HCC organoids medium and seeded in flat-bottom plate with 1×10⁵ autologous CD39+/-CD8+TILs obtained by sorting. To facilitate visualisation, organoids were previously stained with 1 mM of Cell-Trace Farred (#C34572 Invitrogen USA). At the start of coculture, caspase 3/7 probe (#C10723 Invitrogen USA) was added at 1:2000 dilution to visualise cell apoptosis. After 24 hours of coculture, microphotographs images were taken. The supernatant and cells were collected for following test. Organoids were dissociated into single cells and washed in FACS buffer and stained with PE anti-human CD137 (#309 803 Biolegend USA) and Pacific Blue anti-human CD107a (#328 623 Biolegend USA) for 30 min. Cells were washed twice prior to flow cytometric recording. Supernatant was used to examine the IFN-γ secretion by ELISA (#430 107 Biolegend USA).
Peptide stimulation and antigen-specific T cells culture
Based on the above analysis, 6 patients were selected from the 12 candidate patients. Further selected mutant type (MT)/wild type (WT) peptides are listed in table 1 and synthesised. Patients’ autologous PBMCs were used to evaluate the immunogenicity of candidate peptides in vitro. An established culture protocol was mainly used in detecting peptide-specific cytotoxic T lymphocyte (CTLs) as previously reported.25 26 Briefly, blood samples were obtained from patients for the isolation of PBMC by centrifugation and suspended in X-Vivo15 medium. In each well 1×10⁵ PBMCs was incubated with a corresponding peptide (25 µM) in 200 uL culture medium with IL-2 (150 U/mL) in U-bottomed wells. At 3-day intervals, half of the culture medium containing peptide (25 µM) and IL-2 (150 U/mL) was changed. On day 10, the specific T cell responses to each peptide were collected. CD8+ T cells were sorted by EasySep Human CD8+ T Cell Isolation Kit (#17 985 Stemcell USA). Cells were washed twice and then cocultured with autologous tumour organoid for 24 hours. Before coculture, organoids were stained with 1 mM of Cell-Trace Farred. At the start of coculture, caspase 3/7 probe was added at 1:2000 dilution. Organoids were seeded in flat-bottom plate with 1×10⁵ CD8+ T cells. T cells and organoids were at a E:T=10:1 ratio. No peptide was regarded as negative control. Twenty-four hours later, microphotograph images were taken and supernatant was collected to examine the IFN-γ secretion by ELISA. In addition, organoids were dissociated into single cell. Cells were washed in FACS buffer and stained with PE anti-human CD8 (#344 743 Biolegend USA), PerCP/Cy5.5 anti-human CD39 (#328 217 Biolegend USA) and Brilliant Violet 421 anti-human CD137 (#309 819 Biolegend USA) for 30 min. Cells were washed twice prior to flow cytometric recording.
Candidate top five peptides according to the binding-affinity of HLA-I alleles (MT IC50 and WT IC50) from three patients in HAN-high group and HAN-low group
Statistical analysis
Pearson’s correlation coefficient was used to evaluate the correlation matrices. Survival curves were generated using Kaplan-Meier estimates and tested using the log-rank test. Data samples were compared using a two-tailed Student’s t test, and a p value of less than 0.05 was considered significant.
Results
The value of HAN is correlated with better OS in patients with HCC
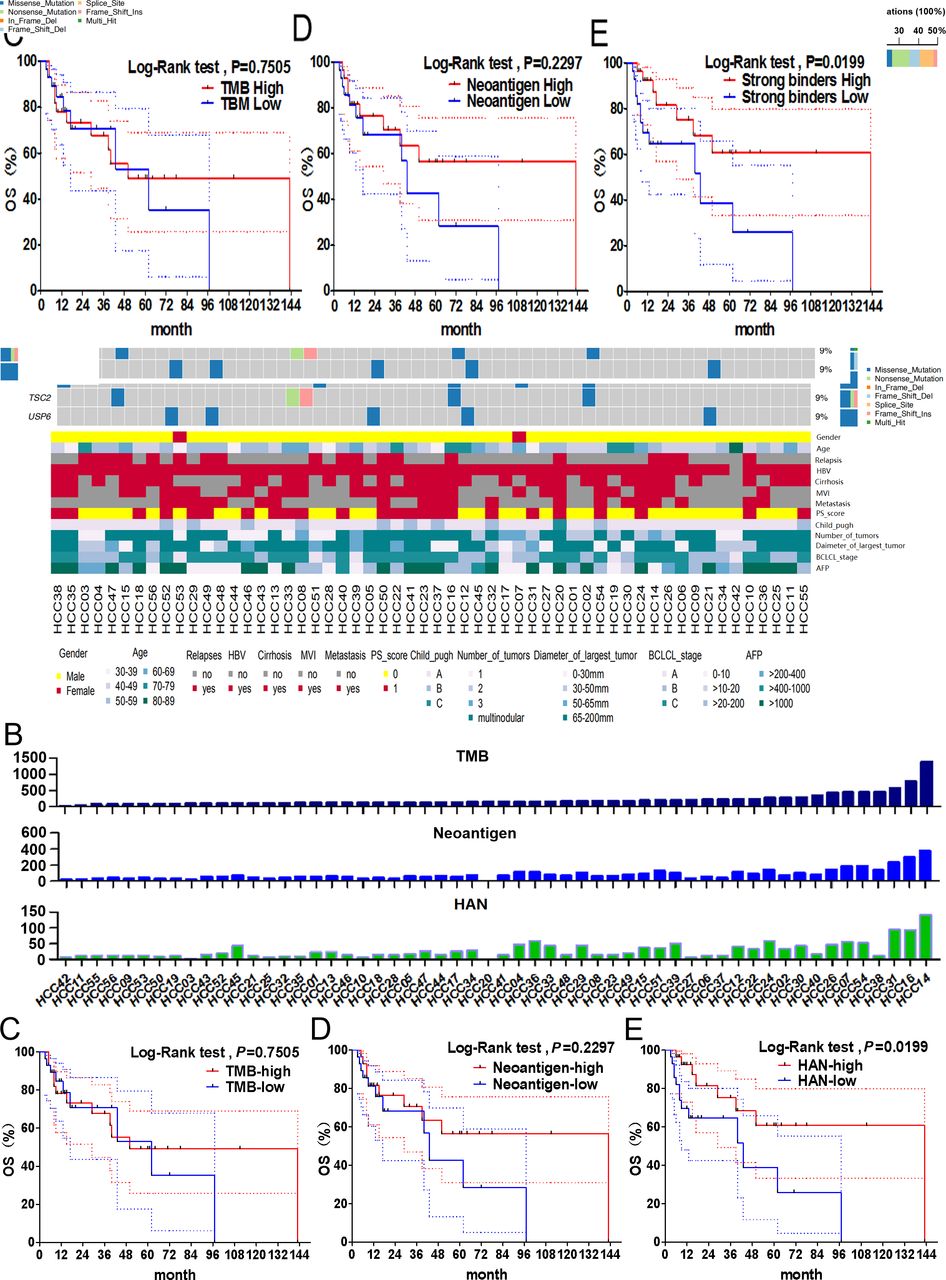
First, the clinical data and gene mutations of 56 patients with HCC were obtained by WES analysis (figure 1A). The top 20 high-frequency mutant genes were identified, including TP53 (50%), CTNNB1 (18%), ARID1A (16%) and AXIN1 (11%). HANs were defined as neoantigens with high MHC-I peptide-binding affinity and mutant type IC50 <50 nM (figure 1B). Then, patients were segregated into high and low groups stratified above or below the median of the indicators above. Our results showed that the value of HAN were significantly correlated with OS (p=0.0199), but TMB (p=0.7505) or neoantigen (p=0.2297) did not (figure 1C–E). The 5-year survival rate of patients with HAN-high group (60.76%, p=0.0199) was better than patients with HAN-low group (38.76%, p=0.0199) (figure 1E). These results suggest HAN can be used as a prognostic biomarker for patients with HCC.

Correlation between TMB/neoantigen/HAN and overall survival in patients with HCC. (A) Gene mutation data and clinical information for all 56 patients with HCC. (B) Value of TMB, neoantigen and HAN for each patient. (C–E) All patients were segregated into high and low groups basing on above or below the median of the value of TMB (median=164), neoantigen (median=63) and HAN (median=16), respectively. The survival curves were analysed by log-rank test (p<0.05 was considered significant). The dotted-line indicated the 95% CI. HAN, high-affinity neoantigen; HCC, hepatocellular carcinoma; TMB, tumour mutational burden.
The value of HAN is positively correlated with the frequency of CD39+CD8+ TILs
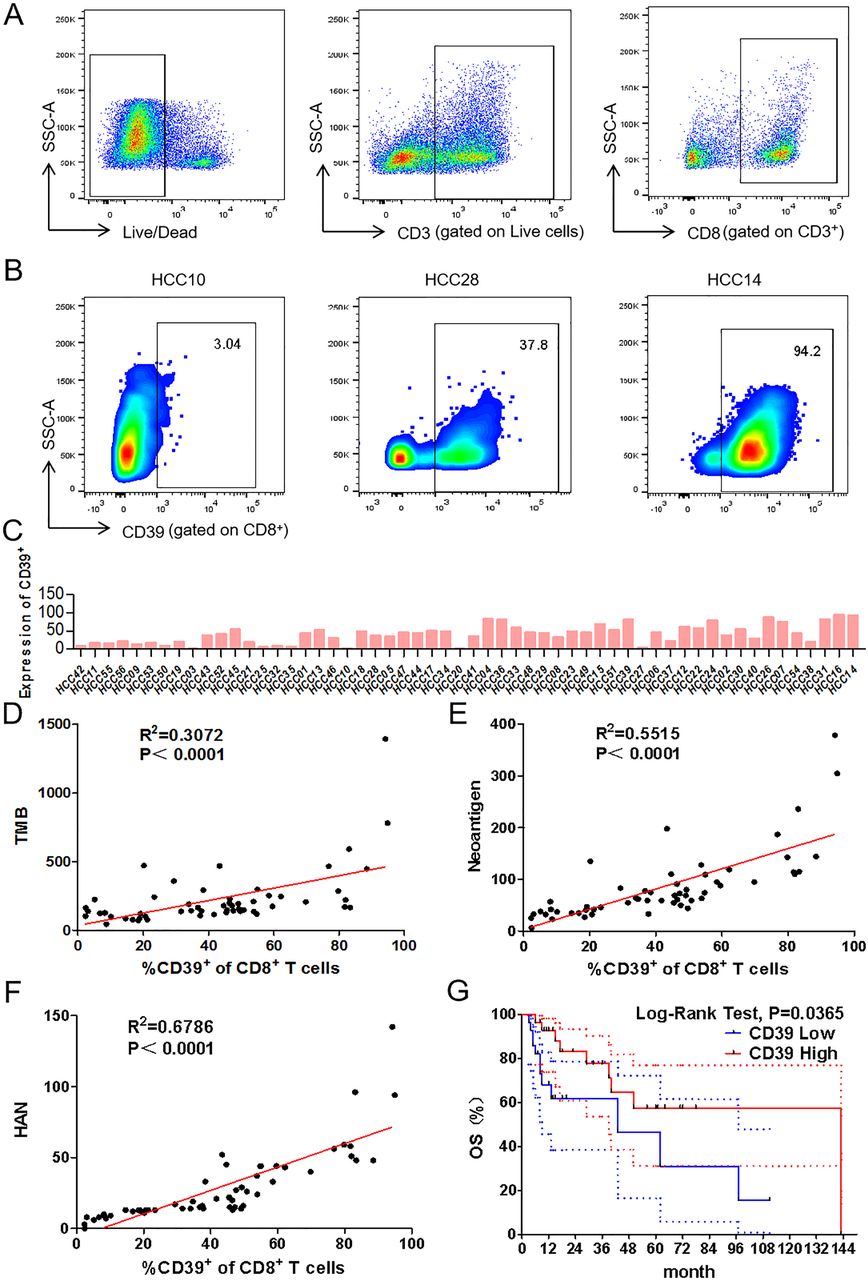
Recent studies have shown that the frequency of CD39+CD8+ TILs has a positive correlation with OS in head and neck squamous cell carcinoma.14 To explore whether HANs were associated with CD39, the frequency of CD39+CD8+ TILs was investigated by flow cytometry (figure 2A–C). Significantly, the value of HAN was better correlated with the frequency of CD39+CD8+ TILs (R2=0.6786) than TMB (R2=0.3072) or neoantigen (R2=0.5515) (figure 2D–F). Furthermore, a higher frequency of CD39+CD8+ TILs was positively correlated with better OS (5 year survival: 56.51% vs 46.42%; p=0.0365) (figure 2G). In conclusion, our findings indicated that the value of HAN is positively correlated with the frequency of CD39+CD8+ TILs.

Correlation analysis between frequency of CD39+CD8+ TILs and value of TMB, neoantigen or HAN. (A,B) Representative gating strategy for CD8+ TILs of patients with HCC by flow cytometry. Numbers in gates indicate the percentage of CD39+CD8+ TILs. (C) Frequency of CD39+CD8+ TILs of each patient was detected by flow cytometry. (D–F) Correlation between frequency of CD39+CD8+ TILs and TMB, neoantigen or HAN estimated by liner regression. (G) Patients were segregated into CD39+ high and low group basing on above or below the median frequency (43.4%) of CD39 expression. The survival curves were analysed by log-rank test (p<0.05 was considered significant). The dotted-line indicated the 95% CI. HAN, high-affinity neoantigen; HCC, hepatocellular carcinoma; TMB, tumour mutational burden.
CD39+CD8+ TILs from HAN-high group show better antitumour activity
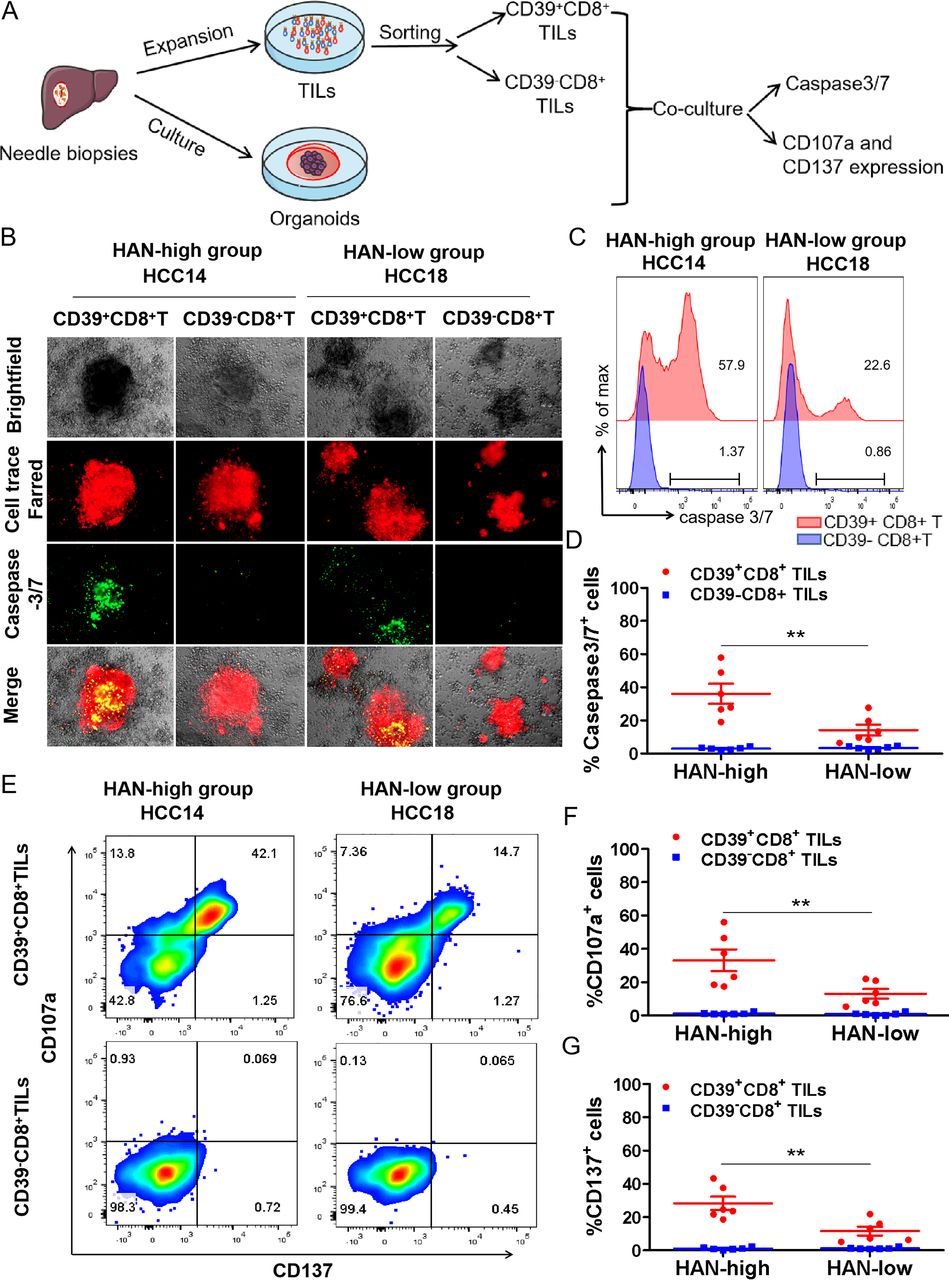
To investigate whether CD39+CD8+ TILs have the capability of tumour-killing, CD39+/-CD8+ TILs were sorted after expansion in vitro and then cocultured with autologous tumours organoids for 24 hours to assess killing efficiency, respectively (figure 3A). All the cases were divided into HAN-high and low groups according to the median of HAN value. Six candidate patients were selected from each group for further study (online supplemental figure 1). Details of high-affinity peptides and HLA alleles of candidate patients are shown (table 1 and online supplemental figure 2).
Supplemental material

CD39+CD8+ TILs from HAN-high group showed stronger antitumour activity. (A,B) CD39+/-CD8+ TILs of candidate patients from HAN-high/low groups were expanded and sorted in vitro and then cocultured with autologous tumours organoids for 24 hours to assess killing efficiency respectively. Organoids (red) were labelled with Cell-Trace FarRed, and apoptotic cells (green) were labelled with caspase-3/7 probe. Microphotograph images of one representative from each group are shown. Scale bars, 40 µm. (C,D) Flow cytometry was to analyse killing efficiency by FITC signal (caspase 3/7 probe). Summary of the frequency of caspase3/7+ for representative six patients from each group was shown. The dots represent different patients. (E,G) Flow cytometry plots was to analyse T cell effector marker CD107a and CD137 on CD39+/- CD8+ T cells. Summary of the frequency of CD107a and CD137 positive was shown for representative patients from each group. The dots represent different patients. Data are presented as mean±SEM (n=6), *P<0.05, **p<0.01. HAN, high-affinity neoantigen; HCC, hepatocellular carcinoma.
The results showed that CD39+CD8+ TILs from HAN-high group induced more caspase3/7 positive apoptosis than those from the HAN-low group (36.03%±6.029% vs 14.15±3.294%, p=0.0003) in HCC organoids (figure 3B–D), whereas CD39−CD8+ TILs of either group induced little apoptosis (figure 3B–D). Furthermore, the frequency of T cell effector markers CD107a and CD137 was higher in CD39+CD8+ TILs from the HAN-high group than those from the HAN-low group (CD107a: 33.13±6.535% vs 13.04±2.893%, p=0.0184; CD137: 28.20±4.016% vs 11.60±2.667%, p=0.0063) (figure 3E–G). These findings suggest that CD39+CD8+ TILs from HAN-high group had better antitumour ability compared with those from HAN-low group.
To further confirm aforesaid findings in fresh CD39+CD8+ TILs, surgically removed HCC fresh tumour samples from patients (online supplemental table 2) were prepared for cell suspension and detected by flow cytometry immediately. Our data confirmed that CD39+CD8+ TILs from fresh tumour in HAN-high group showed a better antitumour activity than those in HAN-low group (online supplemental figure 3A–H), which was consistent with the findings of expanded TILs. Furthermore, the expansion before or after sorting for TILs had no bias in IFN-γ production and CD137 and CD107a expression (online supplemental figure 4A,B).
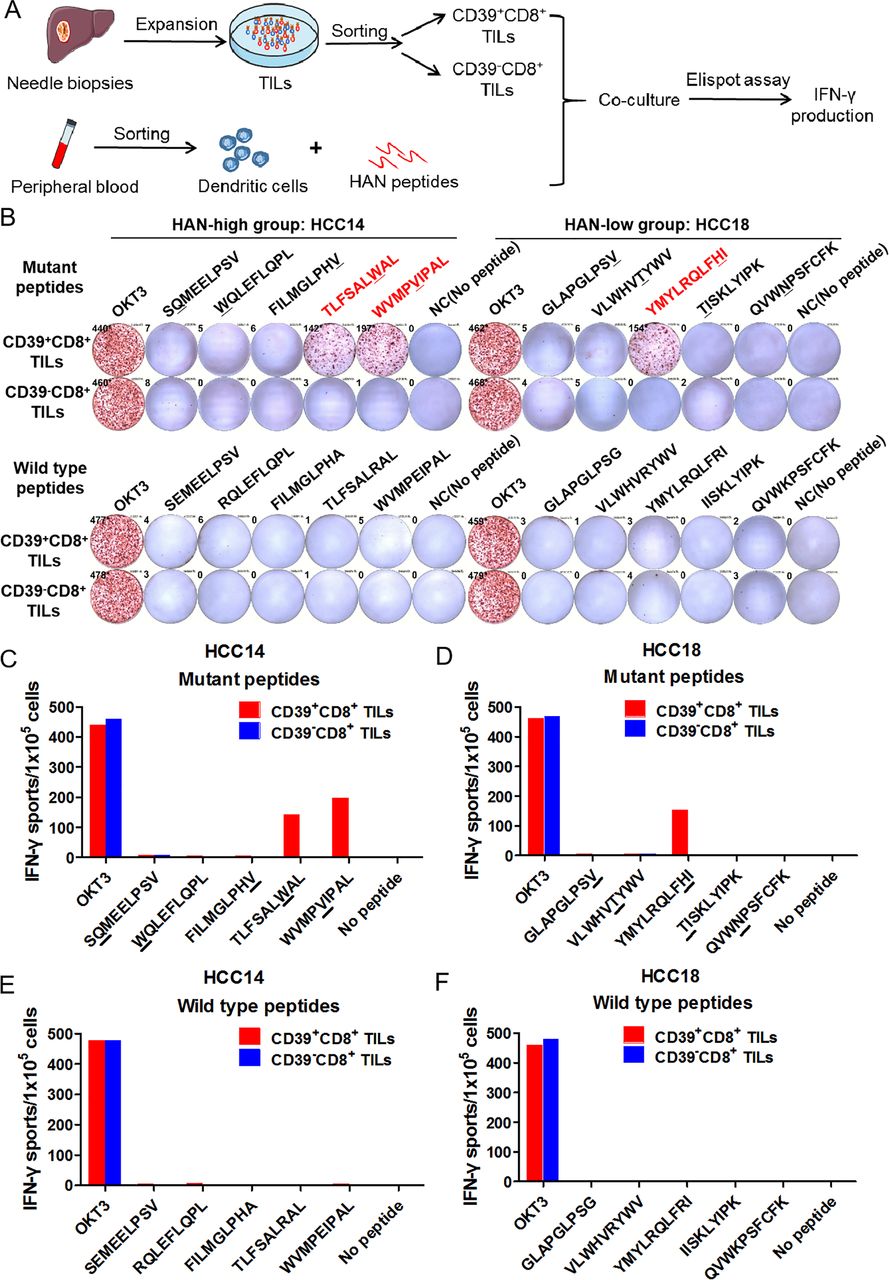
HAN-specific T cells are identified in CD39+CD8+ TILs
To explore whether tumour-reactive CD39+CD8+ TILs were induced by the effective stimulation of HANs, CD39+CD8+ TILs and CD39-CD8+ TILs were sorted from two candidate patients for HAN-specific CD8+ T cell identification assay, respectively, and cocultured with autologous DCs pulsed by candidate peptides from patient HCC14 and HCC18, after which IFN-γ production was tested by ELISPOT assay (figure 4A). Our results demonstrated that two peptides from patient HCC14 (TLSFAL W AL, WVMP V IPAL) and one from patient HCC18 (YMYLRQLF H I) induced significant peptide-specific T-cell responses in CD39+CD8+ TILs group, but no detectable responses were observed in CD39-CD8+ TILs group, which suggest that peptide-specific T-cell were identified in CD39+CD8+ TILs group (figure 4B–D). Besides, all the WT peptides failed to induce the IFN-γ secretion (figure 4E,F). In other words, HAN-specific CD8+ T cells were enriched in CD39+CD8+ TILs.

Neoantigen-specific T cells were identified in CD39+CD8+ TILs. (A,B) CD39+/-CD8+ TILs of candidate patients from HAN-high/low groups were expanded and sorted in vitro and then cocultured with autologous DC cells pulsed by top five HANs (mutant peptides) or corresponding wild type peptides from patient HCC14 and HCC18, and IFN-γ production was determined by ELISPOT assay. The mutated amino acids of each mutant peptide were indicated by the underline. (C–F) The number of IFN-γ spots/1×105 cells in each group. DC, dendritic cell; HAN, high-affinity neoantigen; HCC, hepatocellular carcinoma.
HAN-peptides activate tumour-reactive CD39+CD8+ T cells from PBMCs
Based on aforementioned findings, we hypothesised that there would be more tumour-specific HANs in patients of HAN-high group that can generate CD39+CD8+ T cells with better tumour-reactive activity by PBMCs and peptide coculture. To verify this hypothesis, PBMCs from each patient were stimulated with the corresponding peptides in vitro and were sorted by CD8 magnetic beads on day 10. Subsequently, CD8+ T cells were cocultured with autologous tumour organoids for 24 hours. Antitumour activity was assessed by measuring IFN-γ secretion (figure 5A). In HAN-high group, two peptides (TLSFAL W AL, WVMP V IPAL) in patient HCC14, two (RLRK R NEYR, F L LPSGMAL) in HCC31 and one (LMRDH M PPV) in HCC04 induced significant peptide-specific T-cell responses. Only one effective peptide (YMYLRQLF H I) in patient HCC18 from HAN-low group was identified to induce IFN-γ secretion (figure 5B and online supplemental figure 5A,B). Furthermore, effective peptides from each group significantly increased CD39 and CD137 expression (online supplemental figure 6A,B), indicating that those effective peptides-induced antitumour response related to CD39+CD8+ T cells activation. Moreover, autologous tumour organoids killing assay showed that those effective peptides induced far more caspase3/7-mediated apoptosis in HCC organoids than the negative peptides did from either group (figure 5C,D), indicating a successful tumour-killing ability of CD8+ T cells induced by those peptides, whereas allogeneic peptides could not induce IFN-γ secretion for autologous tumour organoid killing, suggesting that peptide recognition is specific and its antitumour effects are personalised (online supplemental figure 7). In addition, RNA-seq data indicated that CD39+CD8+ T cells exhibited effector T cell signatures after HAN peptide stimulation, with higher expression of cytotoxic, activation, chemotaxis and adhesion molecules (online supplemental figure 8).

Induction of tumour-reactive CD39+CD8+ T cells by stimulation with candidate HANs from PBMCs. (A) Autologous PBMCs of candidate patients from HAN-high/low groups were stimulated by top five HANs, and on day 10 CD8+ T cells were sorted and cocultured with autologous tumour organoids for 24 hours. (B) Tumour recognition was assessed by measuring IFN-γ secretion of supernate. No peptide stimulation was tested as control. Data were presented as mean±SEM (n=3). (C) CD8+ T cells stimulated with HANs from HAN-high/low groups were cocultured with autologous organoids, which were labelled with Celltrace-Farred (red) prior to coculture. Tumour apoptosis was detected by green-fluorescent caspase-3/7 probe, thus apoptotic cells in organoids were indicated in yellow after merge. No peptide stimulation was tested as control. Microphotographs images were one representative patient for each two groups. (D) Summary of killing efficiency of caspase3/7 signal frequency for all the six representatives from each two groups. HAN, high-affinity neoantigen; HCC, hepatocellular carcinoma.
Overall, our findings demonstrated that patients with HCC in the HAN-high group generated more tumour-specific peptides with high MHC-I binding affinity than those in the HAN-low group; they are likely responsible for the activation of tumour-reactive CD39+CD8+ T cells.
CD39+PD-1intCD8+ TILs show an effector T cell phenotype and stronger antitumour activity in HAN-high versus HAN-low group
It was still controversial whether CD39+CD8+ T cells with high PD-1 expression exhibit effector or exhausted phenotype (online supplemental figure 8E). To confirm that, TILs from fresh tumours were analysed by flow cytometry. Data revealed that CD39+PD-1highCD8+ TILs exhibited exhaustion phenotype for low IFN-γ production, while CD39+PD-1int CD8+ TILs exhibited effector phenotype for high IFN-γ production (figure 6A–D). Furthermore, the number and antitumour activity of CD39+PD-1int subsets were upregulated in HAN-high versus HAN-low group (figure 6C).

The phenotype analysis of CD39+/-PD-1high/int/negativeCD8+ TILs. (A,B) Flow cytometry analysed the CD39+/-PD-1high/int/negative subsets gated from CD8+ TILs in fresh HCC tissues from 12 patients. The frequency of IFN-γ+ from each subsets was revealed. (C,D) Statistic graphs of frequency of each subset and IFN-γ expression were shown. Red bars represented HAN-high group and blue bars represented HAN-low group. Data are presented as mean±SEM (n=6), *P<0.05, **p<0.01. HAN, high-affinity neoantigen; HCC, hepatocellular carcinoma; PD, progress disease.
HAN-high patients benefit more from anti-PD-1 treatment compared with HAN-low patients
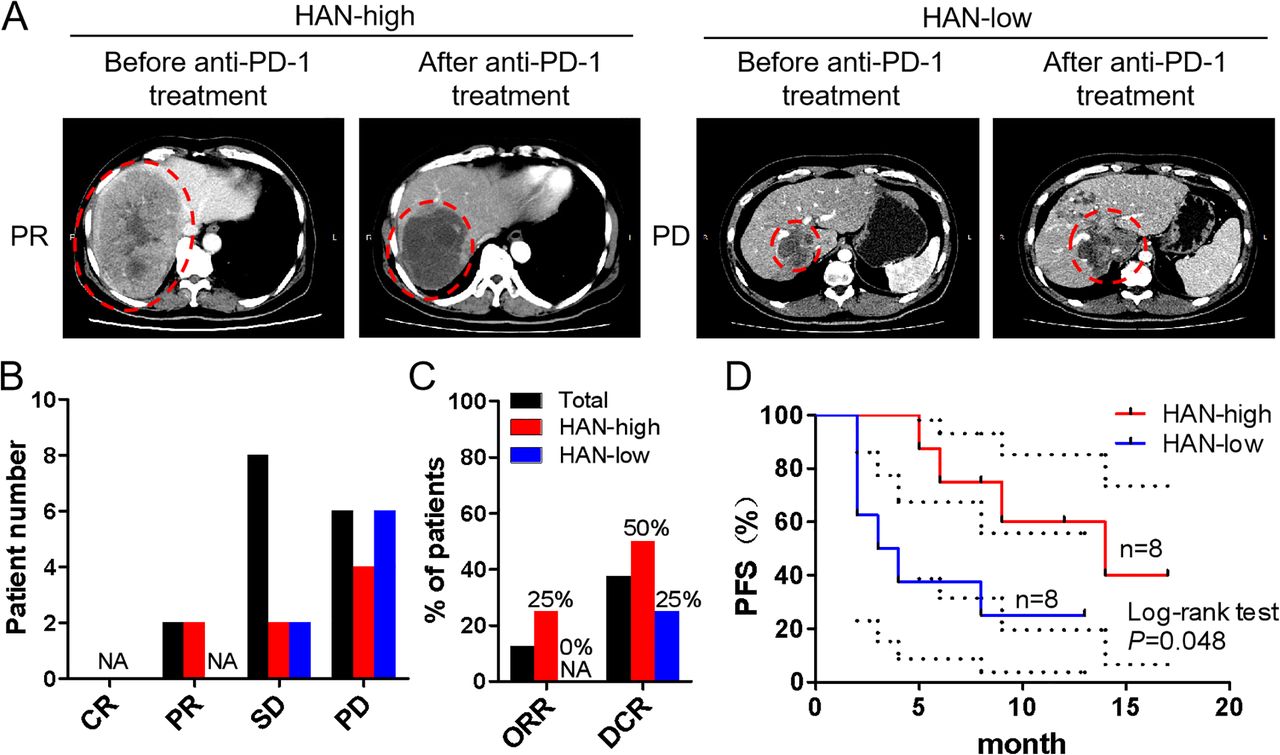
According to aforesaid findings, we speculated that patients in HAN-high group who had a higher ratio of CD39+CD8+ TILs may benefit more from anti-PD-1 treatment. To confirm this conjecture, eight patients from each group treated with anti-PD-1 antibody afterwards were included into study (online supplemental table 1). The baseline tumour size was set before the first time of immunotherapy, and the curative evaluation referred to imRECIST Refining Guidelines.22 Data showed that objective regression rate (ORR) and disease control rate (DCR) were higher in HAN-high group than those in HAN-low group (ORR: 25% vs 0%; DCR: 50% vs 25%) (figure 7A–C). Moreover, survival curves revealed that patients in HAN-high group had a better PFS than those in HAN-low group (p=0.048) (figure 7D).
Curative evaluation of HAN-high/low groups after anti-PD-1 therapy. Sixteen patients had taken anti-PD-1 therapy afterwards and were divided into HAN-high/low groups (8 vs 8). The baseline tumour size was set before the first time of immunotherapy. (A) CT scans of representative patients from two groups were performed before and after anti-PD-1 immunotherapy. The immunotherapy evaluation criteria referred to imRECIST Refining Guidelines. (B,C) The curative evaluation of immunotherapy of HAN-high/low groups was shown. (D) PFS of patients in HAN-high group compare to those in HAN-low group was shown. PFS curves were analysed by log-rank test (p=0.048). The dotted-line indicated the 95% CI. CR, complete response; DCR, disease control rate; HAN, high-affinity neoantigen; ORR, objective response rate; PD, progress disease; PFS, progression-free survival; PR: partial response; SD: stable disease.
Discussion
In the present study, the most striking discovery was that the value of HAN was correlated with a markedly better OS in patients with HCC, suggesting an important role for tumour antigen-specific CD8+ TILs activation in limiting tumour growth in these patients. More importantly, more effective peptides were identified from HAN-high group, which played an important role in activating tumour-reactive CD39+CD8+ T cell.
Recently, accumulating evidence has shown that neoantigens are responsible for tumour regression in patients receiving TIL therapy and in immune checkpoint inhibitor therapy in both mouse models and clinical settings.23 27 However, the arithmetic used to filtrate dozens of efficient peptides from thousands of candidates needed to be improved. The pVACtools suite represents a novel arithmetic to calculate MHC-I-peptide binding affinity, which was used to evaluate efficient peptides. In our study, mutant types with IC50 less than 50 nM were defined as HANs. The value of HAN showed strong correlation with better OS, whereas TMB and neoantigens showed no significant correlation with OS. Our findings were in accordance with previous studies showing that TMB was not correlated with predicted neoantigens in the HCC microenvironment and was not suitable as a predictive biomarker in HCC,4 28 although higher TMB or neoantigens showed significant correlation with better OS in non-small-cell lung cancer (NSCLC) and melanoma.29–32
Recent studies identified CD39 as a novel biomarker to distinguish tumour-specific CD8+ T cells,14 which can recognise tumour neoantigen peptides, in contrast to bystander CD8+ T cells.16 In our study, CD39+CD8+ TILs could recognise tumour-specific HANs, and higher frequency of CD39+CD8+ TILs was positively correlated with better OS. Similarly, the frequency of CD39 on CD8+ T cells was also correlated with higher OS in other human solid tumours.14
Although some studies have identified CD39 as a marker for exhausted T cells because its downstream inhibitory marker CD73 generates adenosine,33 34 some studies reported that CD39+CD8+ TILs were not true sense of exhausted T cells for a particular profile of effector functions, higher IFN-γ and CD137 production.14 Though they coexpress high levels of inhibitory receptors (PD-1, Tim3, Lag3) and a lower proliferative capacity in microenvironment in vivo,35 the effector function can be retrieved after expansion in vitro.14 Our findings revealed that HANs triggered antitumour activity by activating tumour-reactive CD39+CD8+ T cells. Patients from HAN-high group had higher ratios of tumour-reactive CD39+CD8+ T cells, the expression of CD107a, CD137 and secretion of IFN-γ were greatly increased in organoid coculture systems. More importantly, in tumour microenvironment of HCC, CD39+CD8+ TILs could be divided into two distinct subsets: CD39+PD-1intCD8+ TILs which displayed an effector phenotype, and CD39+PD-1highCD8+ TILs which displayed an exhaustion phenotype. Our study first clarified the phenotype of distinct CD39+CD8+ TIL subsets in the tumour microenvironment, which may correlate with the outcome of anti-PD-1 therapy.
HAN-high patients who had higher ratio of CD39+CD8+ TILs may benefit more from those treated with anti-PD-1 antibody, which may retrieve antitumour function of CD39+CD8+ TILs by blocking highly expressed PD-1 receptors.14 16 36 In our study, the number and antitumour activity of CD39+PD-1intCD8+ TILs were upregulated in HAN-high versus HAN-low group, which may explain the improved clinical outcomes of anti-PD-1 therapy in HAN-high versus HAN-low group. Our present findings tentatively confirmed the better prognosis of patients in HAN-high group after anti-PD-1 therapy, additional samples are still needed for verification in our future study. Moreover, those patients in HAN-high group may benefit from treatment with peptide vaccine immunotherapy by generating tumour-reactive CD39+CD8+ T cells from PBMCs.
Neoantigen-based immunotherapy was frequently restricted to the inefficient screening of effective neoantigen peptides. In our study, HANs activated CD39+ CD8+ T cells more efficiently than neoantigens, for it was a furtherly filtrated from neoantigen. Previous studies reported that only 0.6%–2.0% of neoantigen peptides could be identified by autologous T cells from a pool of hundreds of peptides.8 37 38However, when the preliminary screening for HANs was applied, the screening efficiency increased significantly to 20%, allowing 2–3 out of 10 peptides to be identified.10Our data showed that more effective peptides were identified in HAN-high group than HAN-low group (5 vs 1), which could activate tumour-reactive CD39+CD8+ T cells and induced tumour-killing activity.
In conclusion, this study demonstrated a novel assessment system for predicting prognosis based on HANs and the frequency of CD39+CD8+ T cells, which could be used to develop selective HAN-based personalised antitumour therapy for HCC and screen the suitable patients for anti-PD-1 therapy.
Data availability statement
Data are available on reasonable request. All data relevant to the study are included in the article or uploaded as supplementary information. The data used to support the findings of this study are included within the article.
Ethics statements
Acknowledgments
The authors thank Yajing Wang of the GenomiCare Biotechnology (Co. Ltd., Shanghai, 201210, China) for WES analysis and Zhihui Xi of Qianyang Biomedical Research Institute (Shenzhen, China) for assistance in bioinformatics sequencing and pVACtools analysis.
References
Supplementary materials
Supplementary Data
This web only file has been produced by the BMJ Publishing Group from an electronic file supplied by the author(s) and has not been edited for content.
Footnotes
TL, JT and MW contributed equally.
Contributors TL, JT and MW wrote the manuscript. TL, JT and JL designed experiments. TL and JT performed experiments, TL, JT, MW, WF, PZ, HZ and LS analysed and interpreted the data. BZ, JW, JG and SW collected clinical samples and data. JL supervised the project.
Funding This work was supported by grants from National Natural Science Foundation of China (No. 81671797, No. 81971719), the major scientific and technological project of Guangdong Province (No. 2017B030308006), the major programme for tackling key problems of Guangzhou city (No. 201704020144).
Competing interests None declared.
Provenance and peer review Not commissioned; externally peer reviewed.
Supplemental material This content has been supplied by the author(s). It has not been vetted by BMJ Publishing Group Limited (BMJ) and may not have been peer-reviewed. Any opinions or recommendations discussed are solely those of the author(s) and are not endorsed by BMJ. BMJ disclaims all liability and responsibility arising from any reliance placed on the content. Where the content includes any translated material, BMJ does not warrant the accuracy and reliability of the translations (including but not limited to local regulations, clinical guidelines, terminology, drug names and drug dosages), and is not responsible for any error and/or omissions arising from translation and adaptation or otherwise.