Article Text

Abstract
Objective Hippo signalling is a recently identified major oncosuppressive pathway that plays critical roles in inhibiting hepatocyte proliferation, survival and hepatocellular carcinoma (HCC) formation. Hippo kinase (Mst1 and Mst2) inhibits HCC proliferation by suppressing Yap/Taz transcription activities. As human HCC is mainly driven by chronic liver inflammation, it is not clear whether Hippo signalling inhibits HCC by shaping its inflammatory microenvironment.
Design We have established a genetic HCC model by deleting Mst1 and Mst2 in hepatocytes. Functions of inflammatory responses in this model were characterised by molecular, cellular and FACS analysis, immunohistochemistry and genetic deletion of monocyte chemoattractant protein-1 (Mcp1) or Yap. Human HCC databases and human HCC samples were analysed by immunohistochemistry.
Results Genetic deletion of Mst1 and Mst2 in hepatocytes (DKO) led to HCC development, highly upregulated Mcp1 expression and massive infiltration of macrophages with mixed M1 and M2 phenotypes. Macrophage ablation or deletion of Mcp1 in DKO mice markedly reduced hepatic inflammation and HCC development. Moreover, Yap removal abolished induction of Mcp1 expression and restored normal liver growth in the Mst1/Mst2 DKO mice. Finally, we showed that MCP1 is a direct transcription target of YAP in hepatocytes and identified a strong gene expression correlation between YAP targets and MCP-1 in human HCCs.
Conclusions Hippo signalling in hepatocytes maintains normal liver growth by suppressing macrophage infiltration during protumoural microenvironment formation through the inhibition of Yap-dependent Mcp1 expression, providing new targets and strategies to treat HCCs.
- Liver
- Inflammation
- Cancer
- Hepatocellular Carcinoma
- Macrophages
Statistics from Altmetric.com
Significance of this study
What is already known on this subject?
Hippo signalling is required to inhibit hepatocyte proliferation and hepatocellular carcinoma (HCC) formation.
The tumour microenvironment, largely orchestrated by inflammatory cells, is an indispensable participant in the neoplastic process, fostering proliferation, survival and migration, and human HCC is mainly driven by chronic liver inflammation.
Loss of Hippo signalling in hepatocytes results in increased macrophage infiltration, but the cellular and molecular mechanisms underlying reciprocal interaction between macrophages and precancerous/cancerous hepatocytes remain largely unknown.
What are the new findings?
Loss of Hippo signalling in hepatocytes results in increased Mcp1 (Ccl2) expression in the Mst1/2 DKO mice.
Macrophages and Mcp1 are required for growth and tumour formation in the Mst1/2 DKO liver.
Macrophages in the MST1/2 DKO liver exhibit both M1 and M2 characteristics and regulate hepatocyte proliferation and survival independently of Hippo signalling itself.
MCP 1 expression is directly regulated by YAP and in human HCC samples, MCP1 expression levels are correlated with YAP target gene expression.
How might it impact on clinical practice in the foreseeable future?
Our study highlights the clinical significance of hepatic Hippo signalling as a critical inhibitor of inflammation and tumour microenvironment.
Our findings that Mcp1 induction by hepatic Hippo signalling deficiency mediates macrophage infiltration and tumour growth may lead to more efficient therapeutic interventions to reduce tumour burden in HCC patients.
Introduction
It has been long hypothesised that cancer originated at sites of chronic inflammation,1 and recent studies have expanded the concept that inflammation is a critical component of tumour progression. The tumour microenvironment, largely orchestrated by inflammatory cells, is an indispensable participant in the neoplastic process, fostering proliferation, survival and migration. Hepatocellular carcinoma (HCC), a primary malignancy of the liver, is a major health problem, being the fifth most common cancer and second leading cause of cancer deaths in the world.2 3 In most cases, human HCC is driven by chronic liver inflammation caused by activation of many types of inflammatory cells due to chronic viral hepatitis, metabolic liver diseases and alcohol abuse.4 Among them, macrophages derived from circulating monocytic precursors are key components involved in the initiation and maintenance of inflammation, fibrosis and cancer progression. and they are normally the most abundant immune cells in the tumour microenvironment.5 Factors secreted by the tumour-associated macrophages (TAMs) are thought to contribute to the initiation and growth of tumours. However, the cellular and molecular mechanisms underlying tumour–inflammation interaction remain largely unknown.
The recently discovered tumour suppressive Hippo signalling pathway has gained great interest as being critical regulators of cancer progression6 7 besides its fundamental functions in tissue growth/organ size control, regeneration and stem cells.6 8 Hippo signalling regulates a diverse cellular functions in a broad range of tissues including the hepatic systems.7 9 10 Central to the Hippo pathway is the control of Yap/Taz transcription factors by a kinase cascade of Hippo (Mst1 and Mst2) and Lats in mammals. Hippo signalling suppresses Yap/Taz transcription activities by activating Lats kinases that directly phosphorylates Yap/Taz, causing Yap/Taz cytoplasmic retention and subsequent degradation. Unphosphorylated Yap/Taz enter the nucleus to activate genes promoting cell proliferation and survival.
We and others found that loss of Mst1/2 predominantly led to tumour formation in the liver with rapid HCC development.11–14 Furthermore, we show recently that loss of Mst1/2 in mammalian hepatocytes markedly increased liver macrophage infiltration.11 15 These studies strongly suggest that the Hippo signalling pathway is likely a critical gatekeeper preventing both liver tumour initiation and inflammation. However, despite the well-established cell autonomous tumour suppressive function of Mst1/2, effects of the Hippo pathway in tumour initiation and growth in the context of reciprocal interaction between tumour cells and the immune responses remain largely unknown.
Here we have found that a previously unknown fundamental function of the Hippo kinase in hepatocytes is to suppress protumoural immune responses besides directly restraining hepatocyte proliferation and survival by inhibiting expression of monocyte chemoattractant protein 1 (Mcp1 or Ccl2). Furthermore, we have observed strong correlation between MCP1 expression and YAP transcription signature in HCC patients.
Materials and methods
Mouse
Animal care and experiments were performed in accordance with the Institutional Animal Care and Use Committee guidelines at the National Institutes of Health and Harvard Medical School. The DKO, Mcp1f/f and Yapf/f mice were described previously.11 16 17 Both male and female mice were analysed, and we found no gender bias in tumour phenotypes in this study.
Statistical analysis
All data in this study were analysed using GraphPad Prism V.7 (GraphPad Software). Quantification was performed from at least three independent experimental groups. Statistical analysis between groups was performed by two-tailed Student’s t-test to determine significance when only two groups were compared. One-way analysis of variance with Tukey’s post hoc tests was used to compare differences between multiple groups. p Values of less than 0.05 and 0.01 were considered significant.
Other experimental information is provided as supplementary information.
Results
Mcp1 expression is increased in the Mst1/2 DKO liver
Macrophages have been rediscovered in recent years as regulators of various diseases including cancer. Macrophages represent a major cell type of innate immunity and hepatic macrophages consist of Kupffer cells, which are fetal yolk sack-derived liver resident macrophages18 and infiltrated bone marrow-derived monocytes (IMs) during infection and inflammation.19 20 We have found that in mice, the CD11bhiF4/80+ IMs associated with inflammation are markedly increased in the hepatocyte-specific Hippo mutant mice: the AlbCre; Mst1-/- ; Mst2f/f mice (hereafter referred to as the DKO).15 Consistently, proinflammatory cytokines such as IL-1β, Mcp1 and IL-6 were highly expressed in the DKO liver (see online supplementary figure S1A). Because Mcp1 is a chemokine primarily responsible for monocyte/macrophage chemotaxis in inflammatory diseases and atherosclerosis21 22 and tumour growth has been found to induce CCR2+ (CCR2 is a receptor of Mcp1) monocytes to differentiate into TAMs,23 we focused on investigating the function of the upregulated Mcp1 in promoting macrophage infiltration in the DKO liver. RNA-seq analysis revealed that among all chemokine genes with detectable expression in the liver, upregulation of Mcp1 is the most pronounced (figure 1A). Mcp1 protein levels in the DKO liver were also increased (figure 1B). Ccl4, also known as macrophage inflammatory protein-1β (MIP-1β) that encodes a chemoattractant for a variety of immune cells including monocytes,24 was expressed less robustly and less upregulated in the DKO liver (figure 1A). As the liver overgrowth became more severe and many tumour nodules were found in the 4-month-old DKO liver,11 12 15 Mcp1 expression was also more highly upregulated (figure 1C). Consistent with these findings, Mcp1 protein levels in circulating blood of DKO mice were significantly increased compared with the control (figure 1D). To further investigate whether Mcp1 was secreted from hepatocytes, we isolated Mst1-/-; Mst2f/f hepatocytes and infected them with Cre Adenovirus (Ad-Cre) or Ad-GFP as control and found that Mcp1 protein in the medium was significantly increased in the Ad-Cre infected hepatocytes (figure 1E). Consistent with Mcp1 upregulation, F4/80+ macrophages were more abundant in the DKO liver (see online supplementary figure S1B).11 15 These results suggest that loss of Hippo signalling in hepatocytes promoted Mcp1 expression, which may have led to increased macrophage infiltration.
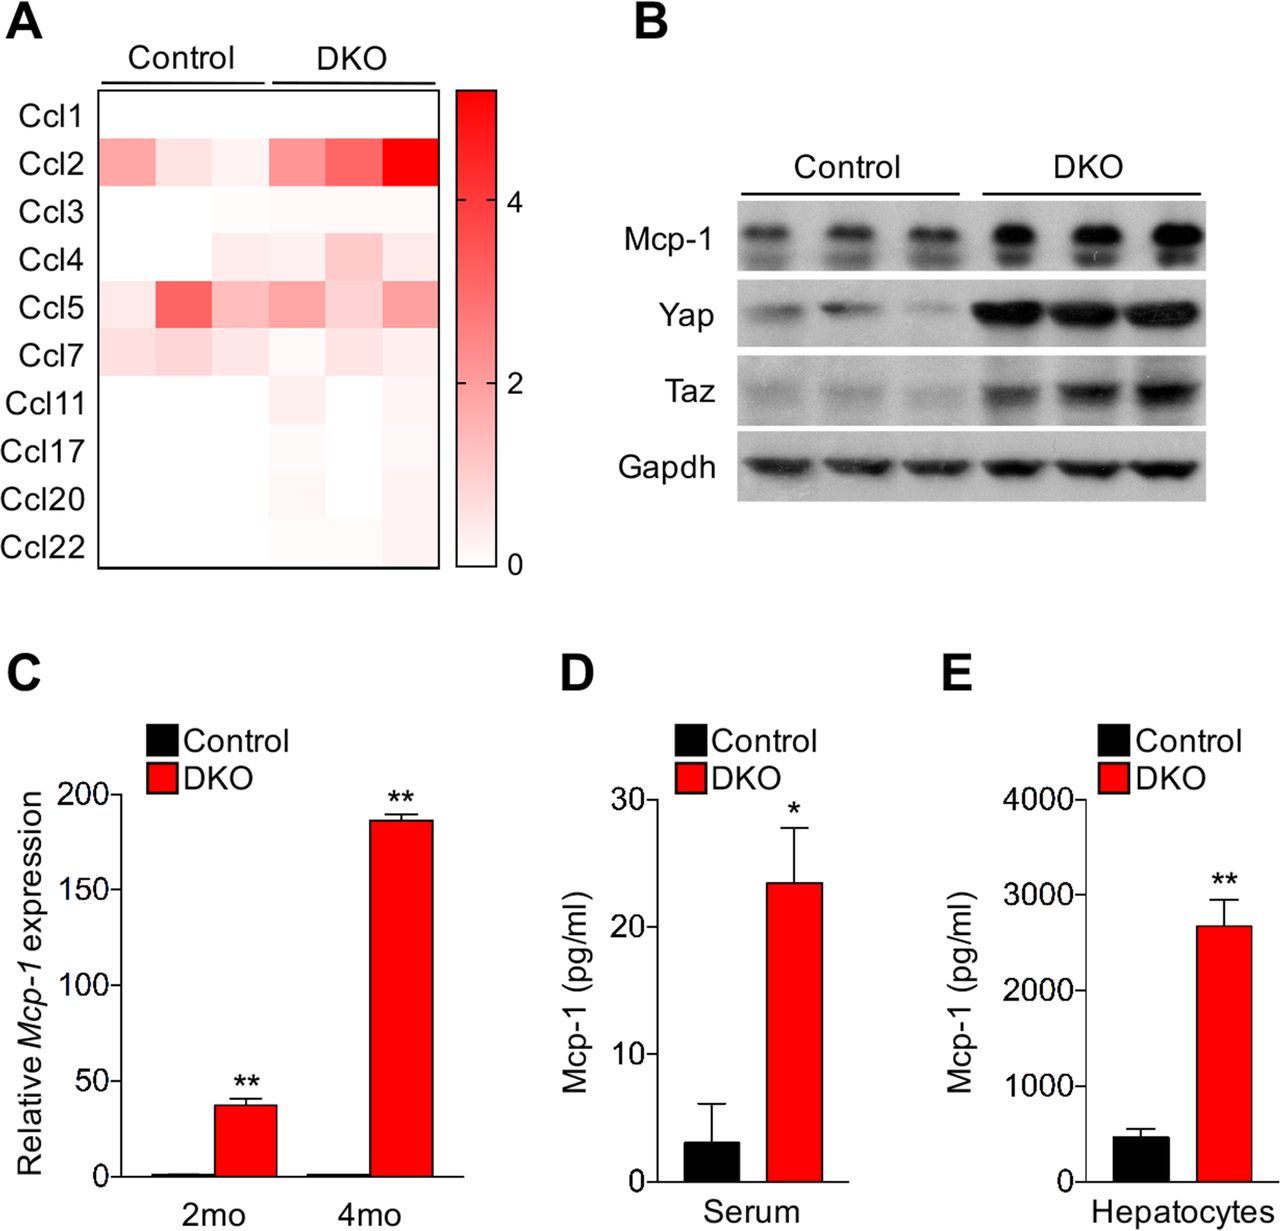
Mcp1 (Ccl2) expression is upregulated in hepatocytes of Hippo-mutant mice. (A) Mcp1 (Ccl2) is the most highly upregulated chemokine in the Mst1/2 DKO liver. Heat-map of detectable Ccl family gene expression from RNA-seq analysis of the 4-week-old mouse liver with the indicated genotypes (n=3 mice per group). (B) Western blotting analysis of liver lysates from 3-month-old control and DKO mice. (C) qRT-PCR of Mcp-1 expression in liver tissues from indicated mice (n=3). Data are expressed as the mean±SEM. **p<0.01 by two-tailed Student’s t-test. (D) the secreted Mcp1 was determined by ELISA in the serum of 3-month-old mice with indicated genotypes. (E) Mst1-/-; Mst2f/f hepatocytes were isolated from 2-month-old mice and infected with Ad-Cre (DKO) or Ad-GFP (control) in vitro. Five days after infection, Mcp1 protein in the medium was determined by ELISA assay. In (D and E), n=3, data are expressed as the mean±SEM. *p<0.01 and **p<0.01 by two-tailed Student’s t-test.
Macrophages are required for growth and tumour formation in the DKO liver
We went on to address whether macrophage infiltration promotes liver growth and HCC formation in the DKO liver by depleting macrophages with clodronate liposomes retro-orbitally injected25 (figure 2A). Clodrosome treatment led to significant reduction of macrophage numbers in the liver, spleen size, liver/body weight ratio and tumour numbers (figure 2B–F). Furthermore, expression of IL-1β and IL-6 was decreased, indicating liver inflammation was reduced by macrophage depletion (figure 2G). These results indicate that macrophages in the DKO liver promoted liver inflammation, growth and tumour formation.

Pharmacological depletion of macrophages reduces liver growth and tumour burden in Mst1/2 DKO liver. (A) The Mst1/2 DKO mice were injected retro-orbitally with 200 µL of Clorodrosome, once per week starting at the age of 4 weeks until 15 weeks. Control mice received liposome alone. (B) Representative macroscopic images of spleen treated with liposome alone or clodronate liposome and the corresponding quantitative comparison (control n=8, clodronate liposome n=8). (C) Liver sections were subjected to immunofluorescence staining with anti-F4/80 antibody to detect macrophages in the liver. Scale bar, 100 µm. Relative F4/80 expression by qRT-PCR shows significant reduction in macrophages in clodronate treated liver. (D) Representative macroscopic images of liver from controls and treatment groups. Black arrows indicate tumour nodules. (E) Quantitative comparison of liver weight and (F) tumour number between control (n=9) and treatment group (n=7). (G) qRT-PCR of IL-1β and IL-6 expression in liver tissues from indicated mice (n=3). Data are expressed as the mean±SEM. *p<0.05 by two-tailed Student’s t-test.
As Mcp1 expression in hepatocytes and macrophage infiltration were both drastically increased in the DKO liver (figure 1 and online supplementary figure S1) and Mcp1 plays important roles in macrophage recruitment,22 we next tested whether Mcp1 is required for increased macrophage infiltration in the DKO liver by blocking its function with a neutralising antibody. Injection of an anti-Mcp-1 antibody reduced hepatomegaly and tumour number in the DKO mice liver (see online supplementary figure S2A–C). Consistent with clodronate liposome study, we observed reduction of F4/80, IL-1β and IL-6 expression in anti-Mcp-1 antibody injected mice (see online supplementary figure S2D–F).
To further confirm these findings, we generated the AlbCre; Mst1-/-; Mst2f/f; Mcp1f/f (TKO) mice16 and found that macrophages, in particular the CD11bhiF4/80lo infiltrated monocytes/macrophages were significantly reduced in the TKO liver (figure 3A, B). In addition, associated with increased inflammation, we found that fibrosis was increased in the DKO liver, and such increase was attenuated in the TKO liver shown by sirius red staining and expression of fibrotic markers (see online supplementary figure S4). Importantly, liver overgrowth and tumour formation in the TKO mice were much reduced compared with those in the DKO mice (figure 3C–E) and consistently, cell proliferation was also reduced in the TKO liver compared with the DKO liver (see online supplementary figure S3). These results demonstrate that Mcp1 expression in hepatocytes of the DKO liver promotes liver growth and tumour formation by regulating macrophage infiltration.

Removal of Mcp1 in the Mst1/2 DKO mice relieves liver phenotypes. (A) A representative immunofluorescent staining of F4/80 in indicated mouse liver tissue at 6 weeks of age. Scale bars: 100 µm (upper panel). F4/80 positive cells were counted and quantified as the number of F4/80+/field of view (FOV) (bottom, left panel). qRT-PCR of F4/80 expression in the same liver tissues was also shown (n=3). Data are expressed as the mean±SEM. *p<0.05 by one-way ANOVA with Tukey’s post hoc test for multiple groups (bottom, right panel). (B) Liver NPCs were isolated from three indicated groups of 6-week-old mice. Same numbers of total NPCs isolated from each mouse were analysed by FACS. Quantified infiltrated macrophages (IMs) and tissue macrophages were shown in the lower panel. n=3. (C) Representative macroscopic images of livers from 3-month-old mice with the indicated genotypes. (D) Analysis of liver-to-body weight ratio of 3-month-old mice with the indicated genotypes. Middle bars in the box plots represent the median value (control: n=5, DKO: n=16, DKO-het: n=10 and TKO-Mcp1: n=6). Data are expressed as the mean ± SEM. *p<0.05 by one-way ANOVA with Tukey’s post hoc test for multiple groups. (E) Analysis of tumour numbers of 3-month-old mice with the indicated genotypes. Data are expressed as the mean ± SEM. *p<0.05 by one-way ANOVA with Tukey’s post hoc test for multiple groups. ANOVA, analysis of variance; FACS, fluorescence-activated cell sorting.
Macrophages in the DKO liver exhibit both M1 and M2 characteristics
Plasticity is a hallmark of cells of the macrophage lineage.26 27 Depending on the local metabolic and immune environment, macrophages can exhibit a range of polarised phenotypes during activation, ranging from a proinflammatory M1 phenotype to an alternative/M2 phenotype involved in the resolution of inflammation and wound healing.19 20 26 27 Transcriptome analysis has shown that macrophages often exhibit mixed M1-M2 polarisation in vivo, and M1-M2 Macrophage polarisation, while conceptually useful, is mostly an oversimplification and does not adequately describe the spectrum of macrophage populations. The TAMs, although behave more like M2 macrophages in many circumstances,19 26 27 do not fit into the stringent criteria for M1 or M2 macrophages.23 28 As shaping macrophage function is an essential link between inflammatory response and cancer,26 we examined whether there are distinct populations of monocytes/macrophages in the DKO liver. It has been shown that Ly6Chi marks inflammatory and tissue-damaging monocytes with M1 characters, while Ly6Clo cells exhibit an anti-inflammatory and tissue-protective phenotypes with M2 macrophage characters, but they are derived from the Ly6Chi cells.29 30 We found that in the CD11bhiF4/80lo IMs (figure 3B), both CD11bhiLy6Clo and CD11bhiLy6Chi monocytes were increased in the DKO liver and both were dramatically decreased in the TKO liver (figure 4A).

Activated macrophages in the MST1/2 DKO liver have both M1 and M2 characteristics. (A) IMs were further analysed according to the expression of Ly6C by FACS. Both Ly6Chi and Ly6Clo cells were increased in the IM fraction from the Mst1/2 DKO liver. Such increased was much reduced in the IMs from the Mst1/2/Mcp1 TKO liver. (B) qRT-PCR of M1 (CD86 and IL-1RA) and M2 (Mrc1 and Ym1) markers expression in liver tissues from the indicated 3-month-old mice (n=3). Data are expressed as the mean ± SEM. *p<0.05 and **p<0.01 by one-way ANOVA with Tukey’s post hoc test for multiple groups (bottom, right panel). (C and D) Representative coimmunofluorescent (Co-IF) staining images for CD206 with F4/80 (C) and iNOS with F4/80 (D) in liver sections from 3-month-old mice with the indicated genotypes. (E) FACS analysis of CD11b, F4/80, Ly6C and CD206 expression in macrophages and IM population from 6-week-old mice. ANOVA, analysis of variance; FACS, fluorescence-activated cell sorting.
To further test macrophage polarisation during its activation in the DKO and TKO liver, we examined expression of markers that are typically associated with M1 or M2 polarisation. We found that gene expression associated with both M1-like (CD86 and IL-1RA) and M2-like (Mrc1 and Ym1) macrophages was both upregulated in the DKO liver, but such upregulation was reduced in the TKO liver (figure 4B). M1 or M2 marker expression was not detected in the hepatocyte fraction from the DKO liver (data not shown). Consistent with this, cytokine expression associated with M1 polarisation such as IL-1β and IL-6 was upregulated in the DKO liver, but such increase was alleviated in the TKO liver (see online supplementary figure S5). Cytokines that can induce M2 macrophage polarisation31 including IL-13, IL-10 and Tgfβs, but not IL-4, were also upregulated in the DKO liver (see online supplementary figure S5). Such increase was again alleviated in the TKO liver. Among these, IL-10 and Tgfβ3 were also produced by M2 macrophages. Furthermore, immunohistochemistry (IHC) of a M1 marker iNOS and M2 marker CD20626 31 also showed both M1 and M2 macrophage polarisation in the DKO liver (figure 4C, D). In the TKO liver, accompanied by reduction in total macrophage numbers (figure 3A, B), both iNOS and CD206-labelled macrophages were decreased. These results indicate that both M1 and M2 polarisation was induced by Hippo-deficient hepatocytes through Mcp1.
To further characterise macrophage phenotypic changes in the DKO liver, we noticed that both the CD11bhiF4/80lo IMs and CD11bloF4/80hi macrophages had increased in numbers and intensities of lineage marker expression (figure 3B). It appears that many of the CD11bloF4/80hi Kupffer cells in the control have upregulated Cd11b expression to become CD11bhiF4/80hi macrophages in the DKO, suggesting that some of these CD11bhiF4/80hi macrophages may have derived from the CD11bhiF4/80lo IMs. Again, such changes were much alleviated in the TKO liver. To further test macrophage heterogeneity in the DKO and TKO liver, we have compared individual marker expression in the IM and F4/80hi macrophage populations from the 6-week-old liver by fluorescence-activated cell sorting (FACS) analysis (figure 4E). Indeed, while CD11b was increased in the macrophage (Kupffer cells in the control) population, F4/80 was also increased in the IM population supporting the notion that some of the CD11bhiF4/80lo infiltrated monocytes had further differentiated to become CD11bhiF4/80hi macrophages in the DKO liver. Interestingly, while a distinct Ly6Chi population was detected in the IM population, the macrophage population always had low Ly6C expression, even in the DKO liver, consistent with the notion that the IMs are associated with inflammation and when the IMs became CD11bhiF4/80hi macrophages, they may have switched to become the anti-inflammatory M2-like Ly6Clo macrophages in the liver.30 Consistent with this, CD206, a marker for M2 macrophage, was expressed at higher levels in the Ly6CloF4/80hi macrophage population in the DKO liver, while in the IM population, CD206 expression was always low, even in the DKO liver in which IMs had increased in number. Taken together, Hippo-deficient hepatocytes have shaped their own microenvironment by inducing macrophage infiltration as well as activation with a mixed M1 and M2 phenotypes, and importantly, these activities depend on Mcp1.
Macrophages regulate hepatocyte proliferation and survival independently of Hippo signalling itself
Because of the different properties of IMs and macrophages that we have identified, we next asked how these macrophages are distributed in the liver and whether these macrophages change their phenotypes in the liver before and after tumours appear. We performed CD11b and Ly6C IHC to recognise the IMs and F4/80 IHC to mark the macrophage populations (figure 5). In the control liver, although there were many F4/80+ resident Kupffer cells, no CD11b+ or Ly6C+ cells were detected, indicating that the CD11blo or Ly6Clo signals recognised in FACS analysis could not be detected by IHC (figure 5A–E, F–J and online supplementary figure 6). We confirmed that there was substantial overlapping between CD11bhi and Ly6Chi macrophages in the DKO and TKO liver (figure 5A′-C′, A″-C″, F′-H′, F″-H″ and online supplementary figure 6), and the CD11bhi and Ly6Chi cell numbers were further increased in the 3-month-old DKO liver compared with the 6-week-old DKO liver. It has been shown that TAMs are distinct from tissue resident macrophage and often derived from infiltrated macrophages. Indeed, we found that in the 3-month-old DKO liver, TAMs and macrophages in the non-tumour region exhibited quite distinct expression patterns of Cd11b, Ly6C and F4/80 (figure 5F′-J′, F″-J″ and online supplementary figure 6). CD11bhi IMs were enriched in the tumour region compared with the non-tumour region (compare figure 5F′, F′″ with F), but F4/80+ cells were hardly increased in the tumour region (compare figure 5I′, I′″ with I), despite huge increase of F4/80+ cells in the non-tumour region. Furthermore, more Ly6Chi expression was detected in non-tumour IMs than in TAMs (figure 5G′, G″ and online supplementary figure 6). Therefore, tumours in the DKO liver are largely populated by CD11bhi Ly6Clo F4/80lo IMs, which are distinct from the tissue resident Kupffer cells and IMs in the non-tumour region.

Detection of different macrophage populations in the liver sections. (A–and C″) Representative Co-IF staining images of CD11b, Ly6C and DAPI in liver sections from 6-week-old mice of the indicated genotypes. (D–and E″) Representative Co-IF staining images of F4/80 and DAPI in liver sections from 6-week-old mice of the indicated genotypes. (F–and H″) Representative Co-IF staining images of CD11b, Ly6C and DAPI in liver sections from 3-month-old mice of the indicated genotypes. (I–and J′″) Representative Co-IF staining images of F4/80 and DAPI in liver sections from 3-month-old mice of the indicated genotypes. Co-IF, coimmunofluorescent; DAPI, 4', 6'-diamidino-2-phenylindole.
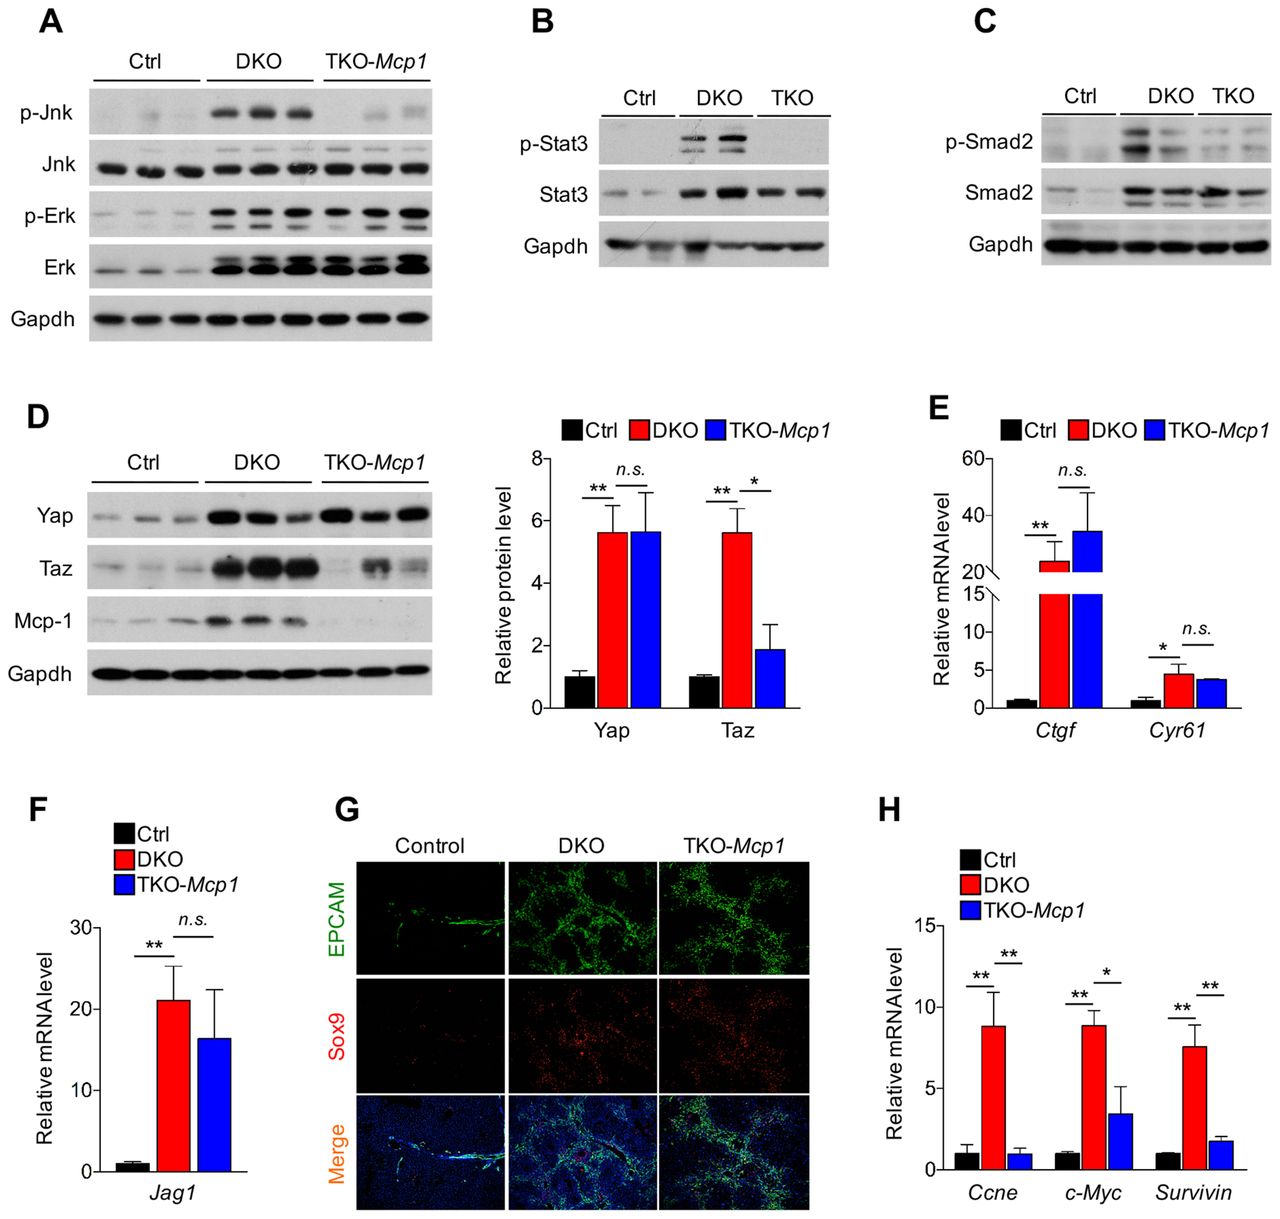
As macrophages play important roles regulating hepatocyte proliferation and survival by secreting cytokines such as tumour necrosis factor α, IL-6 and IL-1β and growth factors such as vascular endothelial growth factor (VEGF), hepatocyte growth factor (HGF) and transforming growth factors (TGFs) (figure 3),19 20 32 we then asked whether reduction of macrophages by removing Mcp1 in hepatocytes altered signalling events downstream of these cytokines and growth factors (figure 6). In the DKO liver, there was increased activation of JNK, Erk, Stat3 and Smad2 (figure 6A-C), and IκB and NF-κB levels were also increased (see online supplementary figure S7). In the TKO liver, while there was reduction of pStat3, pSmad2 and pJNK levels, IκB and NF-κB levels and pErk levels were not altered compared with those in the DKO liver (figure 6A–C and online supplementary figure S7). While we have shown that removal of Stat3 from hepatocytes had little effects in the DKO liver,15 reduction of Tgfβ signalling in Hippo signalling deficiency hepatocytes, indeed leads to reduced liver growth and tumour formation.33 In addition, JNK deficiency in both hepatocytes and non-parenchymal cells also led to reduced liver tumour burdens.34 These results suggest that elevated JNK and Tgfβ signalling are likely resulted from Mcp1-mediated macrophage infiltration and activation, which could lead to liver overgrowth and HCC formation.

Hippo signalling indirectly regulates cell proliferation through Mcp1-mediated liver microenvironment remodelling. (A) Erk and Jnk are activated in the Mst1/2 DKO mouse livers. Western blotting analysis of liver lysates from 3-month-old control, Mst1/2 DKO (DKO) and Mst1/2/Mcp1 TKO (TKO-Mcp1) mice with the indicated antibodies. Jnk, but not Erk, is reduced in the TKO-Mcp1 liver compared with the DKO liver. (B and C) Western blotting analysis of liver lysates from 3-month-old control, DKO and TKO-Mcp1 mice with the indicated antibodies to examine Stat3 and Smad2 activation. (D) Western blotting analysis of liver lysates from 3-month-old control, DKO and TKO-Mcp1 mice with the indicated antibodies (left panel). Quantification of Yap and Taz levels in the indicated mice (right panel). Data are expressed as the mean±SEM. *p<0.05 and **p<0.01 by one-way ANOVA with Tukey’s post hoc test for multiple groups. (E) Yap/Taz target gene expression was not altered in the TKO-Mcp1 mouse liver compared with the DKO liver. qRT-PCR of Yap/Taz target genes Ctgf and Cyr61 expression in liver tissues from indicated mice (n=3). Data are expressed as the mean±SEM. *p<0.05 and **p<0.01 by one-way ANOVA with Tukey’s post hoc test for multiple groups. (F) qRT-PCR of Jagged1 expression in liver tissues from the indicated mice (n=3). Data are expressed as the mean±SEM. **p<0.01 by one-way ANOVA with Tukey’s post hoc test for multiple groups. (G) Representative co-IF staining image of EpCAM and Sox9 in the liver sections from 3-month-old mice of the indicated genotypes. (H) qRT-PCR of CcnE (Cyclin E), c-Myc and Surviviin expression in liver tissues from the indicated 3-month-old mice (n=3). Data are expressed as the mean±SEM. *p<0.05 and **p<0.01 by one-way ANOVA with Tukey’s post hoc test for multiple groups. ANOVA, analysis of variance; co-IF, coimmunofluorescent; n.s., not significant.
To test whether Hippo signalling itself could also be regulated by macrophages or the microenvironment shaped by Mcp1, we examined protein levels of Yap and Taz and found that while there was no change in Yap protein levels in the TKO liver compared with the DKO liver, Taz levels were quite reduced (figure 6D). However, it appears that such reduction of Taz was not sufficient to cause cellular and molecular changes known to be regulated by Hippo signalling. Expression of Yap/Taz target genes including Jagged 1 (Jag1)15 was not altered by Mcp1 deletion (figure 6E, F). Furthermore, Mcp1 deletion failed to rescue oval cell expansion caused by Hippo signalling deficiency11 (figure 6G). Interestingly, despite similar Yap/Taz activities in the liver of the TKO and DKO mice, expression of CyclinE (CcnE), cMyc and Survivin that have been shown to act downstream of Yap/Taz in regulating cell proliferation and survival was reduced in the TKO liver compared with the DKO liver (figure 6H), suggesting that these genes may also be regulated indirectly by Mcp1-mediated liver microenvironment.
Mcp1 expression was directly regulated by Yap/Taz
Requirement of Mcp1 in HCC formation caused by loss of Hippo signalling in hepatocytes led us to test the hypothesis that Mcp1 expression is directly regulated by Yap transcription factors. We first determined in vivo whether genetic reduction of Yap expression in hepatocytes reduces elevation of Mcp1 expression and macrophage infiltration in the DKO liver by generating the Alb-Cre; Mst1-/-; Mst2f/f; Yapf /+ mice.17 In these Mst1/2/Yap-deficient liver, reduction of Yap almost completely restored normal liver growth,15 and we found significant reduction of Yap, Mcp1 and F4/80 protein as well as Mcp1 and F4/80 messenger RNA (mRNA) levels as compared with the DKO liver (figure 7A, B). These results indicate that Mcp1 expression is inhibited by Hippo kinases through suppressing Yap activities.

Mcp1 is a direct target gene of Yaz/Taz. (A) Western blotting analysis of liver lysates from 3-month-old mice with indicated genotypes. (B) qRT-PCR analysis for expression of Mcp-1 and F4/80 in mice liver with indicated genotypes (n=3). Data are expressed as the mean±SEM. **p<0.01 by one-way ANOVA with Tukey’s post hoc test for multiple groups. (C) TEAD family transcription coactivators associate with the indicated motif. YAP/TAZ recognises and binds this consensus sequence via TEAD when Hippo signalling is inactive. (D) Genomic alignment was performed using the regulatory elements of the genes encoding Mcp-1 from various mammals. TEAD binding element in red is highly conserved (left panel). Upward bars indicate the sense orientation and downward bars indicate the antisense orientation (right panel). (E) The TEAD-binding element (red arrow) is located ∼400 bp upstream of the transcription start site of MCP1. Based on ChIP-seq data curated by The ENCODE Project Consortium, the TEAD-binding site is located in a region (blue box), where H3K4me3 and H3K27ac histone modifications associated with transcriptionally active genes are enriched. (F) ChIP-qPCR analysis of indicated TEAD binding sites was performed in promoter regions of MCP1, CTGF and HBB. Data are expressed as the mean±SEM. **p<0.01 by two-tailed Student’s t-test. TSS, transcription start site.
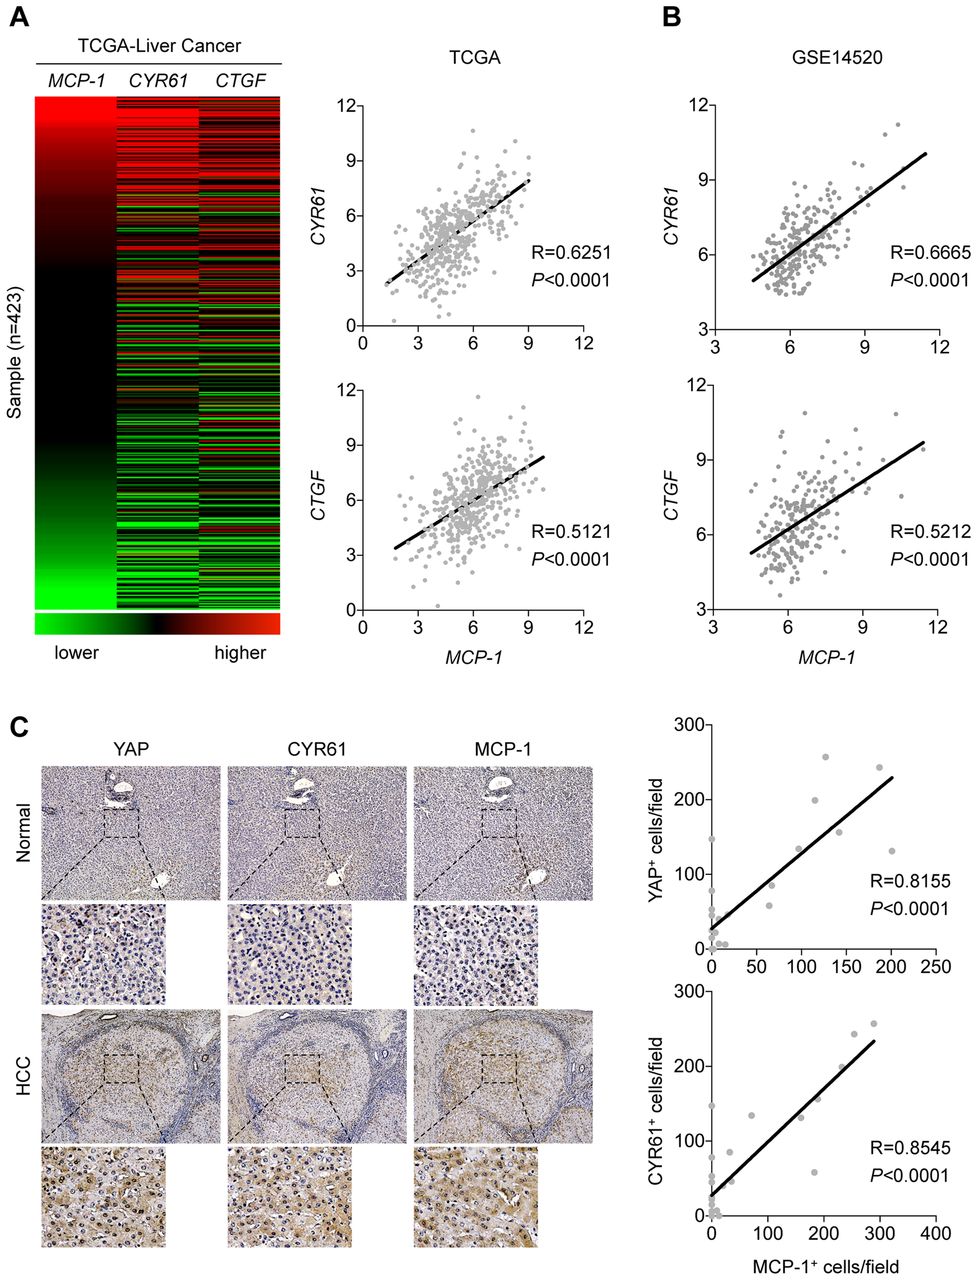
We then went on to determine in vitro whether Mcp1 is a direct transcription target of Yap. Yap activates transcription by binding to transcription factor TEADs that directly bind DNA with the consensus sequence motif (figure 7C).35 We have found that there is a conserved TEAD binding motif in mammals located ∼400 bp upstream of the Mcp-1 transcription start site (figure 7D). Interestingly, based on ChIP-seq data curated by the ENCODE Project Consortium, the TEAD-binding site is located in a region (blue box) where H3K4me3 and H3K27ac histone modifications associated with transcriptionally active genes are enriched (figure 7E). To test whether YAP indeed binds to this region, we performed ChIP-qPCR analysis of the indicated TEAD binding site in the promoter region of MCP1 in the human hepatocyte cell line Huh7 cells. YAP binding to the promoters of target gene CTGF or irrelevant HBB gene was also tested as a positive and negative control, respectively. We found that YAP antibodies can pull down the predicted TEAD binding DNA in the MCP1 promoter region, similar to the one in the CTGF promoter region, but not the HBB promoter sequences (figure 7F). These results indicate that MCP1 is a direct target of YAP transcription factor. This finding prompted us to investigate whether there is a correlation between MCP1 expression and YAP activity in human HCC patients. We reasoned that if MCP1 in human HCC is also regulated by YAP activities, its expression should have positive correlation with other YAP target gene expression. To test this, we analysed mRNA sequencing data of human HCC samples in TCGA database and found that the MCP1 mRNA levels correlate with those of the well-known YAP target genes CYR61 and CTGF in human liver cancers (figure 8A). This conclusion was further strengthened by our analysis of another human HCC cohort data deposited in Gene Expression Omnibus (GSE14520).36 Remarkably, expression of Yap signature was also nicely correlated with MCP1 expression (figure 8B). Furthermore, IHC analysis showed both YAP and CYR61 as well as MCP1 protein expression were increased in 8 of 19 human HCC samples, but not in adjacent non-tumour tissue or normal liver control samples (figure 8C and online supplementary table S1). As HCCs in different data sets were likely caused by a variety of molecular changes, YAP activation of MCP1 production in human HCC may be a common mechanism underlying protumoural growth in a substantial fraction of HCCs.

Mcp1 expression correlates with Yap signature in human HCC patients. (A) RNA-seq data are obtained from TCGA liver cancer data set and gene expression is analysed using the UCSC Xena tool (http://xena.ucsc.edu). The heat map shows the relative levels of transcription of the indicated genes. Red: higher than average; black: average; and green: lower than average. Sample numbers are indicated (left panel). A scatterplot matrix is shown between CYR61 and MCP-1 mRNA expression data in HCC. Pearson correlation R-value and p value are indicated (right panel). (B) Scatterplot matrix are shown between MCP1 and CYR61 (upper panel) or CTGF (bottom panel) mRNA expression data form GSE14520 in HCC. Pearson correlation R-value and p value are indicated. (C) Representative immunohistochemistry with indicated antibodies in serial liver sections from human HCC samples and normal liver samples (left panel) (see Materials and Methods and online supplementary table S1 for more information of these HCC samples). Scatterplot matrix shows the quantification data of immunohistochemistry studies of YAP, CYR61 and MCP1 expression (right panel). Pearson correlation R-value and p value are indicated. HCC, hepatocellular carcinoma.
Discussion
Here we report that Hippo pathway suppresses tumour formation non-cell autonomously by inhibiting protumour inflammation. Our findings significantly extended previous studies on the cell autonomous roles of Hippo signalling in HCC that focused on cell proliferation and survival.7 8 11 15 The identified function of Hippo signalling in shaping an inflammatory microenvironment should also be critical in other processes such as tissue homeostasis and injury repair.
The most significant conceptual advancement of our study is in the finding that Hippo signalling is required in hepatocytes to restrict liver growth and HCC formation by inhibiting monocyte/macrophage infiltration and activation through suppressing Mcp1 expression. Our work here shows that loss of function of the tumour-suppressor Hippo kinase in hepatocytes permits them to progress to malignancy by engaging non-malignant monocytic cells in the protumoural microenvironment, which evolves along with the tumour. Reduced liver growth and tumour formation in the TKO liver as compared with the DKO liver suggests that Mcp1-mediated inflammatory response in the DKO liver is key to both tumour initiation and progression. Our finding is supported by many other studies that show both the systemic and local environment can play a tumour-initiating role by generating persistent inflammatory responses to a variety of stimuli. For instance, persistent inflammation referred to as ‘smoldering inflammation’ caused by chronic infection with viruses such as hepatitis B virus in liver or bacteria like Helicobacter pylori in the stomach is casually associated with cancer initiation.37 In these contexts, it will be interesting to further investigate whether Hippo signalling deficiency plays a role in initiating and/or maintaining ‘smoldering inflammation’. The critical roles of CCL2(MCP1)-CCR2 signalling axis in promoting HCC with various mechanisms have been reported in several studies very recently.38–40 Our studies have significantly advanced these investigations by identifying the Hippo-Yap signalling pathway as a key upstream regulator of Mcp1, linking the hepatic growth control function of Hippo signalling with the regulation of inflammatory responses. It has been recently reported that Lats kinase, which act downstream of Mst1 and Mst2 in the Hippo pathway, suppresses a tumour killing immune response by regulating extracellular vesicle secretion in a tumourgraft model with melanoma cell lines.41 The discrepancy in the findings may be caused by intrinsic differences in the genetic tumour models versus tumour cell graft models involved in the studies and/or hepatocytes versus melanoma cells.
Macrophages can be induced to polarise in M1 or M2 states in vitro, but the in vivo phenotypic plasticity of macrophages and the already described multiple phenotypes of TAMs suggest that simple classification of TAMs into M1 or M2 macrophages does not exist in the complex tumour microenvironment in vivo.28 Indeed, macrophages in the DKO liver were activated with both M1 and M2 polarisation (figure 4). While this is different from a recent publication showing that hepatocytes ectopically expressing an artificially activated Yap protein induce M2 macrophages,42 our conclusion is supported by large-scale transcriptome analysis that have shown TAMs have a mixed phenotype expressing both M1 and M2 markers in vivo.23 28 Our finding that CD11bhi Ly6CLo IMs, not the F4/80hi macrophages, were enriched inside the tumour nodule indicates that TAMs in the DKO liver are not resident Kupffer cells. In addition, previous findings suggest most TAM populations arise from the Ly6Chi populations of circulating mouse monocytes.23 43 Therefore, it is likely that the CD11b+Ly6Clo TAMs in the DKO liver are derived from the CD11b+Ly6Chi macrophages found in pretumour stage or non-tumour regions as shown in another context.30 Our results are consistent with the notion that to help their escape from immune surveillance, tumour cells coax macrophages to a less inflammatory phenotype in the liver.26 It will be interesting to determine in the future which factor(s) secreted from DKO tumour cells promotes CD11b+Ly6Clo macrophage differentiation. In addition, Mst1/2-deficient macrophages showed increased cytokine expression but reduced phagocytic activities.44 It is likely that loss of Hippo signalling in both hepatocytes and infiltrated macrophages led to increased cytokine expression but reduced removal of tumour cells. Therefore, it is possible that enhancing Hippo signalling in both hepatocytes and macrophages would reduce hepatocyte proliferation, reduce inflammation, macrophage infiltration and enhance macrophage phagocytic function, all of which collectively reduce tumour formation. Taken together, our work reported here builds a new foundation by studying the integrated roles of Hippo signalling in regulating hepatocyte proliferation, survival and TAM differentiation as driving forces of HCC initiation and progression.
Acknowledgments
We would like to thank the members of the Yang laboratory for constructive discussions. This study was supported by grants from the intramural research programme of the NHGRI and the HSDM and by a Korean Visiting Scientist Training Award (KVSTA) fellowship from the Korean Health Industry Development Institute (KHIDI) (HI13C1274 to WK). We are grateful to Dr Teizo Yoshimura for providing the Mcp1f/f mice and Dr Eric Olson for the Yapf/f mice.
References
Footnotes
WK, SKK and YL contributed equally.
Contributors WK, SK, YL and RX designed and performed genetic crosses, tissue sampling and mouse experiments. OP designed and performed experiment to analyse Mcp1 secretion from serum and primary hepatocytes. BC analysed Mcp1 promoter and helped with ChIP-qPCR assay analysis. YH cut human HCC sections. WK, SK, YL, BG and YY wrote and reviewed manuscript. BG and YY designed and supervised manuscript.
Competing interests None declared.
Provenance and peer review Not commissioned; externally peer reviewed.