Article Text

Statistics from Altmetric.com
Description of the technology
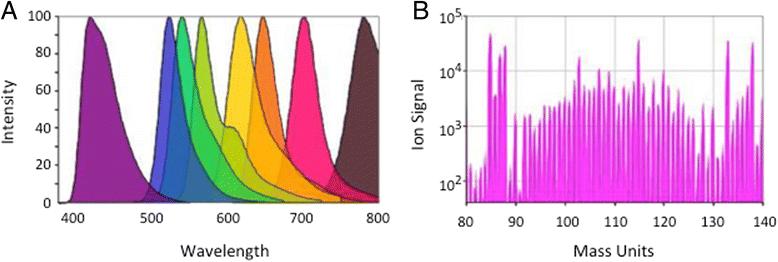
Flow cytometry traditionally uses fluorochrome-labeled probes, such as antibodies, to identify cells expressing the targets of those probes. A sample stream carries single cells in suspension past a laser, exciting the fluorochromes, with quantitation of the emitted fluorescent signals from each cell via optical filters and photomultiplier tubes [1]. In mass cytometry, or CyTOF, the fluorescent labels are replaced with heavy metal ions. The metal ions are chelated to a polymer, which is covalently linked to antibodies or other probes. After staining with these probes, single cells are introduced via an aerosol stream into a plasma torch, resulting in complete ionization of the labeled cells. The heavy ions are then focused via a quadrapole and enter a time-of-flight detector, where the individual ions are quantitated [2, 3]. This results in the simultaneous benefit of more available labels, with much less spillover between detector channels (Fig. 1).
a Example of emission spectra of several dyes used in fluorescence flow cytometry, showing the degree of overlap and consequent spillover between detectors. b Ion signals detected by mass cytometry are by comparison very discrete, allowing many more simultaneous probes to be used, with little or no spillover
Type of data obtained/readout
Flow and mass cytometry uniquely allow for the quantitation of multiple parameters on many individual cells. Up to 17 or more parameters are possible with fluorescence, while 40 or more parameters can be quantitated with mass cytometry [4]. It is not unusual to collect data on 105–107 cells per sample by either technique. The data from each sample is compiled in a Flow Cytometry Standard (FCS) file, for both flow and mass cytometry. The FCS file lists the intensities obtained for each probe on each individual cell. Analysis of FCS files can be carried out in any of a number of commercial software packages, and involves sequential “gating” or selection of populations of interest. For example, single cells might first be selected based on light scatter parameters; then live cells gated by exclusion of a viability dye; then lymphocytes identified by a combination of forward and side-angle light scatter; then T cells selected by expression of CD3; etc. Note that mass cytometry does not allow for light scatter properties to be measured, so all gating is done on the basis of labeled probes, in addition to cell length (as measured by the time duration of the cell’s ion cloud). Accurate quantitation of the proportions of even rare populations of cells can be made if enough events are collected; as can relative levels of expression of cellular proteins such as activation markers, intracellular cytokines, or signaling proteins. Absolute cell counts and quantitation of molecules of bound fluorophore/metal are also possible, for example, with reference to standardized labeled beads. Automated gating algorithms are also available, including unsupervised clustering and dimension reduction techniques [5–8].
Limitations of the approach
Pre-conjugated antibodies are now readily available for both flow and mass cytometry, though the latter generally still requires a few conjugates to be made in-house, in order to complete a specific high-parameter panel. Sensitivity to detect low-abundance proteins can be an issue for both platforms. In general, the best fluorochromes have a detection limit of about 40 molecules per cell, while the detection limit for mass cytometry is about 400–500 molecules per cell. Sensitivity is influenced by factors such as autofluorescence (in traditional flow cytometry) and non-specifically bound antibodies (in both platforms). Compensation for spectral overlap can reduce sensitivity and introduce artifacts in fluorescence flow cytometry. In both platforms, there can be loss of cells in sample preparation washing steps, although mass cytometry generally requires more washing steps than fluorescence assays. Additionally, there are cell losses in the mass cytometer itself, such that data are captured on only about 30 % of introduced cells (improved to 50 % in the latest version of CyTOF instrumentation). Collection speed is also much lower in mass cytometry (300–500 events per second, compared to several thousand events/second in fluorescence flow cytometry).
Types of samples needed and special issues pertaining to samples
Cells for these assays need to be in single-cell suspension. Debris and cell aggregates can interfere with the running of samples and with the interpretation of data. Because of the potential for cell loss, samples with <105 cells are usually not appropriate for either flow or mass cytometry. Functional assays, such as cytokine production, or analysis of phospho-signaling proteins, require cells with good viability. Overnight shipping of blood and cryopreservation of PBMC can compromise these readouts. Variability in sample handling, acquisition, and analysis are all significant in affecting results [9]. Multiple approaches can mitigate these factors, from use of lyophilized reagents [10] to “barcoding” of samples to produce a single composite sample for purposes of uniform processing and acquisition [11–13].
Level of evidence
Flow cytometry is backed by thousands of publications and over 30 years of development. Mass cytometry is more recent, but has seen an exponential rise in publications. Several flow cytometry assays are used in FDA-approved diagnostic tests. Both platforms can produce strong evidence, provided that appropriate controls are included.
References
Footnotes
Competing interests The authors declare that they have no competing interests.
Authors’ contributions HTM drafted the manuscript and AH added to and edited it. Both authors read and approved the final manuscript.