Article Text

Abstract
Background Bispecific antibodies redirecting T cells to the tumor obtain increasing interest as potential cancer immunotherapy. ERY974, a full-length bispecific antibody targeting CD3ε on T cells and glypican 3 (GPC3) on tumors, has been in clinical development However, information on the influence of T cells on biodistribution of bispecific antibodies, like ERY974, is scarce. Here, we report the biodistribution and tumor targeting of zirconium-89 (89Zr) labeled ERY974 in mouse models using immuno-positron emission tomography (PET) imaging.
Methods To study both the role of GPC3 and CD3 on the biodistribution of [89Zr]Zr-N-suc-Df-ERY974, 89Zr-labeled control antibodies targeting CD3 and non-mammalian protein keyhole limpet hemocyanin (KLH) or KLH only were used. GPC3 dependent tumor targeting of [89Zr]Zr-N-suc-Df-ERY974 was tested in xenograft models with different levels of GPC3 expression. In addition, CD3 influence on biodistribution of [89Zr]Zr-N-suc-Df-ERY974 was evaluated by comparing biodistribution between tumor-bearing immunodeficient mice and mice reconstituted with human immune cells using microPET imaging and ex vivo biodistribution. Ex vivo autoradiography was used to study deep tissue distribution.
Results In tumor-bearing immunodeficient mice, [89Zr]Zr-N-suc-Df-ERY974 tumor uptake was GPC3 dependent and specific over [89Zr]Zr-N-suc-Df-KLH/CD3 and [89Zr]Zr-N-suc-Df-KLH/KLH. In mice engrafted with human immune cells, [89Zr]Zr-N-suc-Df-ERY974 specific tumor uptake was higher than in immunodeficient mice. Ex vivo autoradiography demonstrated a preferential distribution of [89Zr]Zr-N-suc-Df-ERY974 to T cell rich tumor tissue. Next to tumor, highest specific [89Zr]Zr-N-suc-Df-ERY974 uptake was observed in spleen and lymph nodes.
Conclusion [89Zr]Zr-N-suc-Df-ERY974 can potentially be used to study ERY974 biodistribution in patients to support drug development.
- antibodies, neoplasm
- immunotherapy
- lymphocyte activation
- translational medical research
- T-lymphocytes
This is an open access article distributed in accordance with the Creative Commons Attribution Non Commercial (CC BY-NC 4.0) license, which permits others to distribute, remix, adapt, build upon this work non-commercially, and license their derivative works on different terms, provided the original work is properly cited, appropriate credit is given, any changes made indicated, and the use is non-commercial. See http://creativecommons.org/licenses/by-nc/4.0/.
Statistics from Altmetric.com
Background
Cancer treatment regimens increasingly contain monoclonal antibodies (mAb) with established mechanisms of action. These mAbs include drugs designed to block immune checkpoints, which are approved for multiple indications including melanoma, non-small-cell lung cancer and renal cell carcinoma.1 Unfortunately, not all patients with these tumor types treated benefit. Moreover, immunotherapy is still not effective in many tumor types. Therefore, novel approaches are exploited. This includes challenging approaches such as T cell redirecting bispecific antibodies, which target both T cells and tumor cells.2 By engaging T cells via CD3 and an antigen on tumor cells, T cells get activated to kill cancer cells.3 4 The activity of the anti-CD19/CD3 bispecific T cell engager blinatumomab in adult and pediatric patients with relapsed and refractory precursor B-cell acute lymphoblastic leukemia and with minimal residual disease resulted in the first approval of such an approach by the US Food and Drug administration and European Medicines Agency.5 For solid tumors, currently, several T cell redirecting bispecific antibodies are studied in clinical trials.4
ERY974 is a T cell redirecting bispecific antibody that targets human CD3 on T cells (Kd 207 nM) and glypican 3 (GPC3; Kd 1.5 nM) on tumor cells.6 GPC3 is an oncofetal cell surface protein that is overexpressed in several tumor types while its expression is suppressed in healthy tissue.7 ERY974 is a fully humanized IgG4 antibody. It has preserved neonatal Fc receptor binding properties to allow extended circulating half-life by reducing lysosomal degradation, but lacks binding to Fcγ receptors (FcγR) to prevent GPC3-indepenent cytokine release by engaging FcγR and CD3. 6 Preclinically, ERY974 inhibits growth of several solid tumor types in a mouse model with reconstituted human immune cells.6 ERY974 is in clinical development.8
Molecular imaging could accelerate drug development by gaining insight in biodistribution and target engagement.9 Recent interesting preclinical data showed that distribution of a radiolabeled bispecific antibody targeting CD3ε and human epidermal growth factor receptor 2 (HER2) is largely dependent on the affinity of the CD3ε arm of the antibody.10 It is difficult to predict the drug distribution of an engineered drug such as ERY974 that has two targets with different affinities. Studying ERY974’s biodistribution might be informative for optimal treatment of patients. Prior to a clinical study, a preclinical study would allow studying additional experimental conditions by using multiple tumors and mouse models combined with different control antibodies. Therefore, to improve the understanding of ERY974’s behavior we aimed to characterize the impact of T cells on the biodistribution of ERY974 in a mouse model. We coupled ERY974 to chelator N-succinyl desferal (N-suc-Df), followed by radiolabeling with the positron emission tomography (PET) isotope zirconium-89 (89Zr) to enable non-invasive molecular imaging of ERY974 to study its behavior in a tumor-bearing mouse model. To study both the role of GPC3 and CD3 on the biodistribution of [89Zr]Zr-N-suc-Df-ERY974, 89Zr-labeled control antibodies targeting CD3 and non-mammalian protein keyhole limpet hemocyanin (KLH) or KLH only were used. CD3 influence was evaluated by comparing biodistribution between tumor-bearing immunodeficient mice and mice reconstituted with human immune cells. In addition, GPC3-dependent tumor targeting was tested in xenograft models with different levels of GPC3 expression. Ex vivo autoradiography was used to study deep tissue distribution.
Methods
Bispecific antibody constructs and cell lines
Bispecific antibody constructs ERY974 (IgG4), KLH/CD3 (IgG1), KLH/KLH (IgG1) and bivalent GPC3 antibody were provided by Chugai Pharmaceutical. The dissociation constants for the binding of ERY974 to human GPC3 and human CD3ε were 1.5±0.4 nM and 207±7, respectively. ERY974 was formulated in 150 mM arginine, 20 mM histidine, 171 mM ʟ-aspartic acid and 0.52 mg/mL poloxamer 188, pH 6.0. KLH/CD3 binds KLH and human CD3ε with similar affinity than ERY974, whereas KLH/KLH binds KLH only. The molecular weight of the antibodies is approximately 146 kDa and all were engineered to abolish FcγR binding.6
The human hepatocellular carcinoma cell line HepG2 (GPC3+), human ovarian clear cell carcinoma cell line TOV-21G (GPC3+) and human hepatocellular carcinoma cell line SK-HEP-1 (GPC3-) were used. All cell lines were obtained from American Type Culture Collection and confirmed to be negative for microbial contamination. Cell lines were authenticated by BaseClear using short tandem repeat profiling. This was repeated once a cell line has been passaged for more than 6 months after previous short tandem profiling. HepG2 cells were cultured in Dulbecco’s Modified Eagle’s Medium (DMEM; Invitrogen), TOV-21G in a 1:1 mixture of Ham’s F12/DMEM, SK-HEP-1 in DMEM with high glucose (Invitrogen) supplemented with 10% fetal bovine serum (Bodinco BV). All cells were cultured under humidified conditions at 37°C with 5% CO2.
Animal experiments
We used female NOD.Cg-Prkdc scid Il2rgtm1Sug/JicTac (NOG; median body weight 22 g with IQR of 21–23 g) mice (Taconic) or female humanized NOG (huNOG; 22 g with IQR 20–23) mice which were engrafted with human CD34 +hematopoietic stem cells (Taconic11). Human leukocyte reconstitution was checked by flow cytometry at 16 weeks postengraftment and CD3+ engraftment was similar between experimental groups (online supplementary figure S1). Mice were housed per five mice in specific pathogen-free cages, with cage enrichment, on a 12-hour day/night cycle, and ad libitum access to food and water. Mice were allowed to acclimate for at least 1 week on arrival. At approximately 25 weeks of age 10×106 HepG2, TOV-21G or SK-HEP-1 cells in 1:1 ratio of medium and Matrigel (BD Biosciences; 0.3 mL) were subcutaneously injected for xenograft development. Tumor growth was assessed by caliper measurements and body weight was monitored twice weekly. Retro-orbital tracer injection (for description of tracer manufacturing see online supplementary additional methods) was performed when tumors reached a size of 200 mm3. This was reached for TOV-21G in 14 days and for HepG2 and SK-HEP-1 in 24 days. Anesthesia during microPET scanning was performed with isoflurane/oxygen inhalation (5% induction, 2.5% maintenance). Details regarding number of animals, microPET scans and time of biodistribution are included in the figure legends.
Supplemental material
Supplemental material
MicroPET scanning and ex vivo biodistribution
All microPET scans were performed in a Focus 200 rodent scanner (CTI Siemens). Mice were kept warm on heating mats. A transmission scan of 515 s was obtained using a 57Co point source for tissue attenuation. The reconstruction of microPET scans was performed as previously described.12 After reconstruction, images were interpolated with trilinear interpolation using PMOD software (V.3.7, PMOD Technologies). Coronal microPET images or maximal intensity projection images were used for display. Volumes of interest (VOI) of the whole tumor were drawn based on biodistribution tumor weight. For the heart, a 92 mm3 VOI in the coronal plane was drawn. VOIs were subsequently quantified. Data are expressed as the mean standardized uptake value (SUVmean).
For all ex vivo biodistribution studies, tumor, whole blood and organs of interest were collected and weighed. Samples together with tracer standards were counted in a calibrated well-type g-counter (LKB Instruments). Uptake is expressed as the percentage injected dose per gram of tissue (%ID/g).
To determine binding to peripheral blood mononuclear cells, whole blood of huNOG mice was separated using SepMate-15 tubes (STEMCELL Technologies) with Ficoll-Paque PLUS (GE Healthcare). Buffy coat fraction was washed twice using phosphate buffered saline (PBS; 140 mM/L NaCl, 9 mM/L Na2HPO4, 1.3 mM/L NaH2PO4, pH 7.4, UMCG) with 2% fetal calf serum. Radioactivity was counted of whole blood and PBMCs.
Ex vivo autoradiography and immunohistochemistry
Tumors, spleen or mesenteric lymph nodes were fixed in formalin overnight, followed by paraffin embedding. Four µm sections were subsequently exposed overnight to a phosphor screen (PerkinElmer) in an X-ray cassette. Signal was detected with a Cyclone Storage Phosphor System (PerkinElmer). Slides used for ex vivo autoradiography were deparaffinized then stained with H&E and digitalized with NanoZoomer and NDP software (Hamamatsu). Subsequent slides were stained for GPC3 (tumor only) and CD3ε (online supplementary additional methods).
For ex vivo tissue, autoradiography quantification of tumor sections, regions of interest (ROIs) were drawn for tumor cells and stromal regions based on H&E. ROIs were exported to ImageJ (National Institutes of Health, USA), rescaled for ex vivo autoradiography and ROIs were measured.
For tumor lysate and plasma analysis, samples were heated for 10 min at 70°C and 40 µg protein of tumor lysates or mouse plasma from three mice, tracer alone as positive control were loaded on mini-PROTEAN TGX Precast Gels (Bio-Rad). Gels were exposed overnight to phosphor imaging screens (PerkinElmer) in X-ray cassettes and analyzed using a Cyclone Storage Phosphor System (PerkinElmer).
Statistical analysis
Statistical analyses were performed using GraphPad Prims V. 7.02. Unless otherwise stated, data are presented as median±IQR. Mann-Whitney U test was performed to test differences between two groups. Bonferroni correction was applied when more than two groups were compared. P values≤0.05 were considered significant.
Results
In vitro characterization of [89Zr]Zr-N-suc-Df-ERY974 and control tracers
We successfully radiolabeled ERY974 and control antibodies with 89Zr with a molar activity (Am) of 72.8 MBq/nmol at the end of synthesis. Radiochemical purity exceeded 95% after labeling and high molecular weight species were below 5%. In vitro, the intermediate N-suc-Df-ERY974 binds GPC3 and CD3ε similarly to unconjugated ERY974 in an ELISA-based binding assay, indicating preserved binding to both targets (online supplementary figure S2A and B). The T cell activation potency of N-suc-Df-ERY974 was not affected, being similar to unmodified ERY974 (online supplementary figure S2C). This in vitro data demonstrate that N-suc-Df-ERY974 can be used as a surrogate for ERY974 to study its biodistribution. In GPC3-positive HepG2 tumor cells, 12.9%±3.2% [89Zr]Zr-N-suc-Df-ERY974 internalized after 4 hours (online supplementary figure S2D). Control tracers KLH/CD3 and KLH/KLH did not bind to GPC3 and only [89Zr]Zr-N-suc-Df-KLH/CD3 bound CD3ε (online supplementary figure S2E and F).
Supplemental material
Tumor xenograft accumulation of [89Zr]Zr-N-suc-Df-ERY974 in time in immunodeficient NOG mice
The optimal time point for microPET imaging with [89Zr]Zr-N-suc-Df-ERY974 providing the highest tumor-to-blood ratio in HepG2 xenograft bearing immunodeficient NOG mice was 168 hours after injection. MicroPET images revealed clear tumor uptake of [89Zr]Zr-N-suc-Df-ERY974 already at 24 hours after intravenous injection (figure 1A). After tracer injection over time, the blood levels decreased and tumor levels increased up to 120 hours, resulting in a maximal tumor-to-blood ratio of 2.2±0.3 at 168 hours (figure 1B,C).

[89Zr]Zr-N-suc-Df-ERY974 distribution in time. (A) Maximal intensity projection images of [89Zr]Zr-N-suc-Df-ERY974 in HepG2 tumor (white dotted circle) bearing NOG mice at 24 hours, 72 hours, 120 hours and 168 hours post 10 µg [89Zr]Zr-N-suc-Df-ERY974 injection. (B) Quantification of tumor and blood pool (n=6). data shown as median SUVmean and IQR. (C) Tumor-to-blood ratio based on SUVmean. Data shown as median tumor-to-blood ratio and IQR. Cr, cranial; Ca, caudal; H, heart; L, liver; SUVmean, standardised uptake value; T, tumor.
Biodistribution and tumor uptake of [89Zr]Zr-N-suc-Df-ERY974 in immunodeficient NOG mice bearing tumor xenografts with different GPC3 expression
In both GPC3 positive tumor models, HepG2 (GPC3 high) and TOV-21G (GPC3 low; online supplementary figure S3A), [89Zr]Zr-N-suc-Df-ERY974 tumor uptake was visualized with microPET, whereas GPC3-negative xenograft SK-HEP-1 revealed lower uptake (figure 2A,B; online supplementary figure S3A). Ex vivo biodistribution at 168 hours after tracer administration confirmed GPC3-dependent uptake of [89Zr]Zr-N-suc-Df-ERY974, with higher uptake in TOV-21G xenografts and lower uptake in SK-HEP-1 compared with HepG2 xenografts (figure 2C). [89Zr]Zr-N-suc-Df-ERY974 tumor-to-blood ratio of was highest in HepG2 tumors (figure 2D). Ex vivo autoradiography of tumor tissue at 168 hours after tracer administration, showed [89Zr]Zr-N-suc-Df-ERY974 presence mainly confined to GPC3 expressing tumor tissue areas of HepG2 and TOV-21G xenografts (online supplementary figure S3A). In contrast, GPC3 negative SK-HEP-1 xenografts showed predominantly 89Zr localization in non-tumor tissue (online supplementary figure S3A). In all xenograft models, 89Zr-uptake reflected intact but also fragments of [89Zr]Zr-N-suc-Df-ERY974 in tumor lysates and blood plasma (online supplementary figure S3B).
Supplemental material
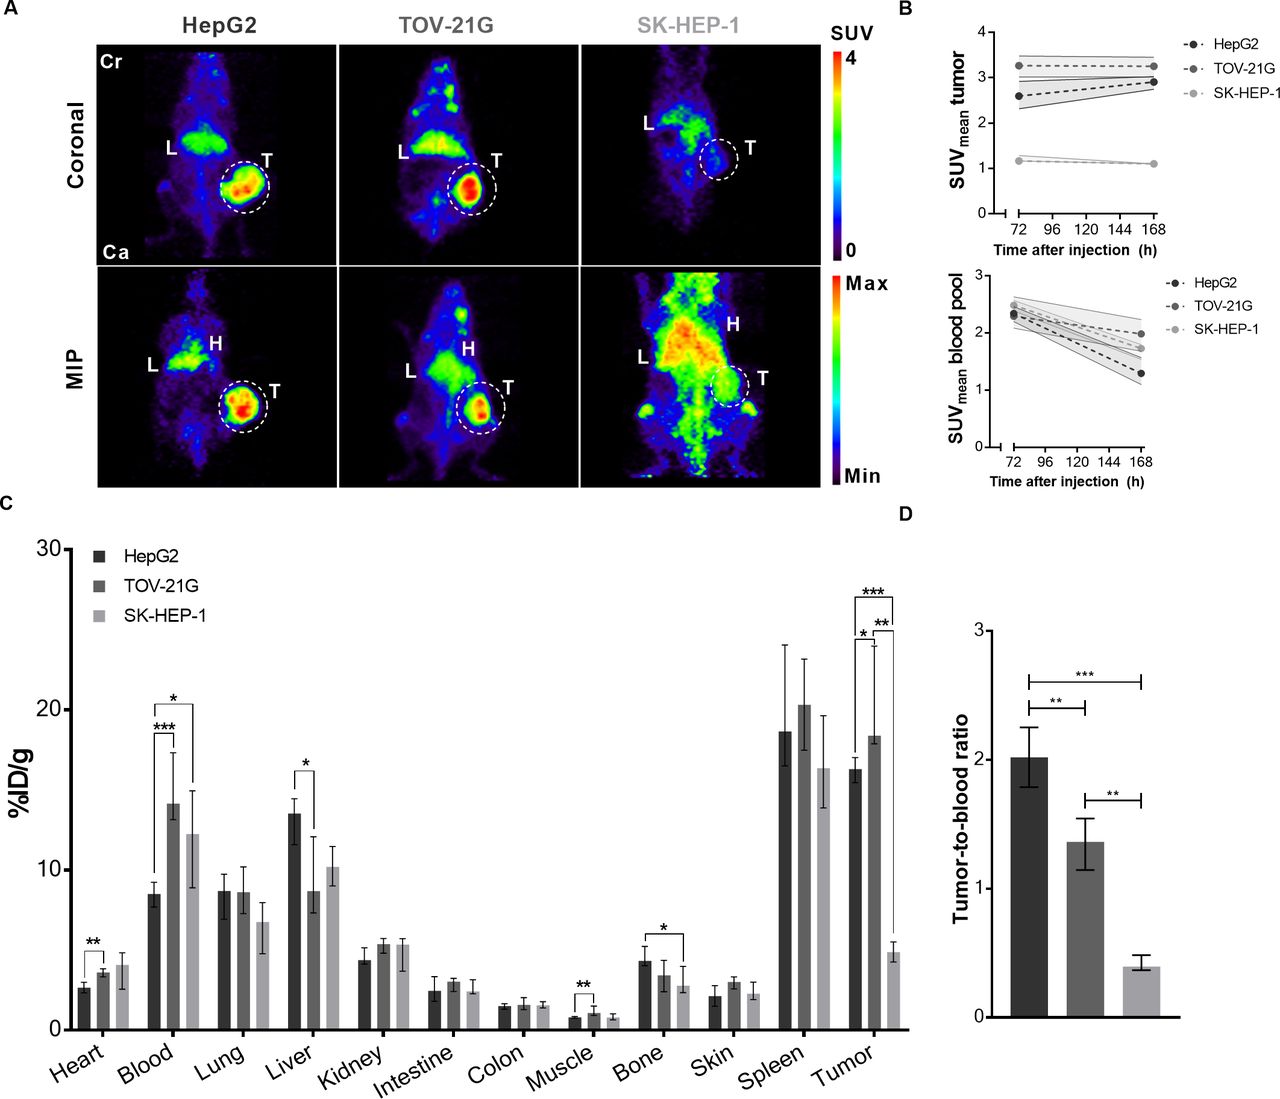
[89Zr]Zr-N-suc-Df-ERY974 distribution in immunodeficient NOG mice bearing different tumor xenografts. (A) Coronal microPET images (upper panel) and maximal intensity projection (MIP) images (lower panel) of NOG mice bearing HepG2, TOV-21G or SK-HEP-1 xenografts (white circle) 168 hours post 10 µg [89Zr]Zr-N-suc-Df-ERY974 injection. (B) Quantification of HepG2 (n=6), TOV-21G (n=6) or SK-HEP-1 (n=6) uptake of [89Zr]Zr-N-suc-Df-ERY974 (upper graph) and corresponding blood pool uptake (lower graph) at 72 hours and 168 hours post-tracer injection. Data shown as median SUVmean and IQR. (C) Ex vivo biodistribution of [89Zr]Zr-N-suc-Df-ERY974 168 hours post-tracer administration. Data are expressed as median with IQR. *P≤0.05; **P≤0.01; ***P≤0.001 (Mann-Whitney U). (D) Tumor-to-blood ratio based on ex vivo biodistribution of C. Data are expressed as median with IQR. **P≤0.01; ***P≤0.001 (Mann-Whitney U). Cr, cranial; Ca, caudal; H, heart; L, liver; PET, positron emission tomography; SUVmean, standardised uptake value; T, tumor; 89Zr, zirconium-89.
[89Zr]Zr-N-suc-Df-ERY974 biodistribution demonstrated highest physiological uptake in spleen followed by liver, lung and kidney at 168 hours after tracer administration (figure 2C). [89Zr]Zr-N-suc-Df-ERY974 blood levels in TOV-21G xenograft bearing mice were higher and liver uptake was lower, compared with HepG2 xenograft bearing mice (figure 2C).
Spleen and bone marrow uptake of [89Zr]Zr-N-suc-Df-ERY974 in immunodeficient NOG mice
[89Zr]Zr-N-suc-Df-ERY974 uptake in the spleen was ±18 %ID/g in all tumor-bearing NOG mice and thereby the highest uptake observed compared with any organ (figure 2C). As shown earlier for severely immunodeficient NOD.Cg-PrkdcscidIl2rgtm1Wjl (NSG) mice,13 spleen uptake in our experiment was also influenced by FcγR-modification of the mAb, with lower spleen uptake for FcγR-silenced mAbs (online supplementary figure S4A and B). In addition, with high radioactive dose spleens of our mice shrunk in time and aplasia was observed 168 hours after injection with median weight of 10 mg IQR 8–12 at higher radioactive dose versus24 mg IQR 20–33 at a lower radioactive dose (online supplementary figure S4C-G 13). Spleen uptake is also affected by mouse strain, as our less immunodeficient nude (BALB/cOlaHsd-Foxn1nu ) mice demonstrated lower relative spleen uptake of [89Zr]Zr-N-suc-Df-ERY974 than NOG mice (online supplementary figure S4H), similarly described for an 89Zr-labeled antibody targeting delta-like protein 3.14 Interestingly, absolute spleen uptake of [89Zr]Zr-N-suc-Df-ERY974 was higher in nude mice (online supplementary figure S4I and J). Relative bone marrow uptake of [89Zr]Zr-N-suc-Df-ERY974 was also lower in nude mice than NOG mice, while cortical bone uptake was similar (online supplementary figure S4K). In summary, a relative high spleen uptake of 89Zr-mAb in NOG mice is related to host and mAb characteristics and mediated by radiation dose, as demonstrated earlier in NSG mice.13
Supplemental material
Influence of ERY974 protein dose on [89Zr]Zr-N-suc-Df-ERY974 tumor xenograft uptake and biodistribution in immunodeficient NOG mice
To test the effect of protein dose on [89Zr]Zr-N-suc-Df-ERY974 tumor targeting and biodistribution, 10 µg [89Zr]Zr-N-suc-Df-ERY974 was supplemented with a dose of unlabeled ERY974. A 200-fold excess of unlabeled protein (2 mg) was unable to reduce HepG2 tumor uptake of [89Zr]Zr-N-suc-Df-ERY974 and even increased uptake in HepG2 xenografts at 168 hours after injection (online supplementary figure S5A). However, this dose did lower [89Zr]Zr-N-suc-Df-ERY974 liver uptake while [89Zr]Zr-N-suc-Df-ERY974 blood levels remained unchanged (online supplementary figure S5B and D). HepG2 xenograft uptake of [89Zr]Zr-N-suc-Df-ERY974 could also not be blocked with 100-fold excess of unlabeled bivalent GPC3 mAb, but resulted in increased blood levels leading to a lower tumor-to-blood ratio (online supplementary figure S5B and C). In TOV21G xenografts, which express less GPC3, data suggests that 2000 µg total protein dose ERY974 reduced, although non-significant, tumor uptake of [89Zr]Zr-N-suc-Df-ERY974 with 62.1% (online supplementary figure S5A; P = 0.07).
Supplemental material
Specificity of HepG2 xenograft uptake of [89Zr]Zr-N-suc-Df-ERY974 in immunodeficient NOG mice
To demonstrate that tumor uptake is GPC3 dependent, control tracers [89Zr]Zr-N-suc-Df-KLH/CD3 and [89Zr]Zr-N-suc-Df-KLH/KLH were administered to HepG2 bearing immunodeficient NOG mice. At 168 hours after injection, tumor uptake on microPET images of [89Zr]Zr-N-suc-Df-ERY974 was better visible than of [89Zr]Zr-N-suc-Df-KLH/CD3 or [89Zr]Zr-N-suc-Df-KLH/KLH (figure 3A). Scan quantification of tumor uptake showed less tumor uptake for [89Zr]Zr-N-suc-Df-KLH/CD3 and [89Zr]Zr-N-suc-Df-KLH/KLH, with a median SUVmean of 0.75 with an IQR of 0.59–0.91 and 1.08 (IQR 0.71–1.82) vs 2.91 (IQR 2.74–3.03) for [89Zr]Zr-N-suc-Df-KLH/CD3, [89Zr]Zr-N-suc-Df-KLH/KLH and [89Zr]Zr-N-suc-Df-ERY974, respectively (figure 3B). Furthermore, ex vivo biodistribution results at 168 hours after injection supported the findings with the microPET images. This also revealed additional differences in tracer distribution such as lower blood levels for [89Zr]Zr-N-suc-Df-KLH/CD3 and higher for [89Zr]Zr-N-suc-Df-KLH/KLH compared with [89Zr]Zr-N-suc-Df-N-suc-Df-ERY974 (figure 3C). Similarly, liver uptake was higher for [89Zr]Zr-N-suc-Df-KLH/KLH and lower for [89Zr]Zr-N-suc-Df-KLH/CD3 compared with [89Zr]Zr-N-suc-Df-ERY974 (figure 3C). [89Zr]Zr-N-suc-Df-ERY974, [89Zr]Zr-N-suc-Df-KLH/CD3 and [89Zr]Zr-N-suc-Df-KLH/KLH all showed relatively high distribution to spleens of immunodeficient NOG mice (figure 3C).
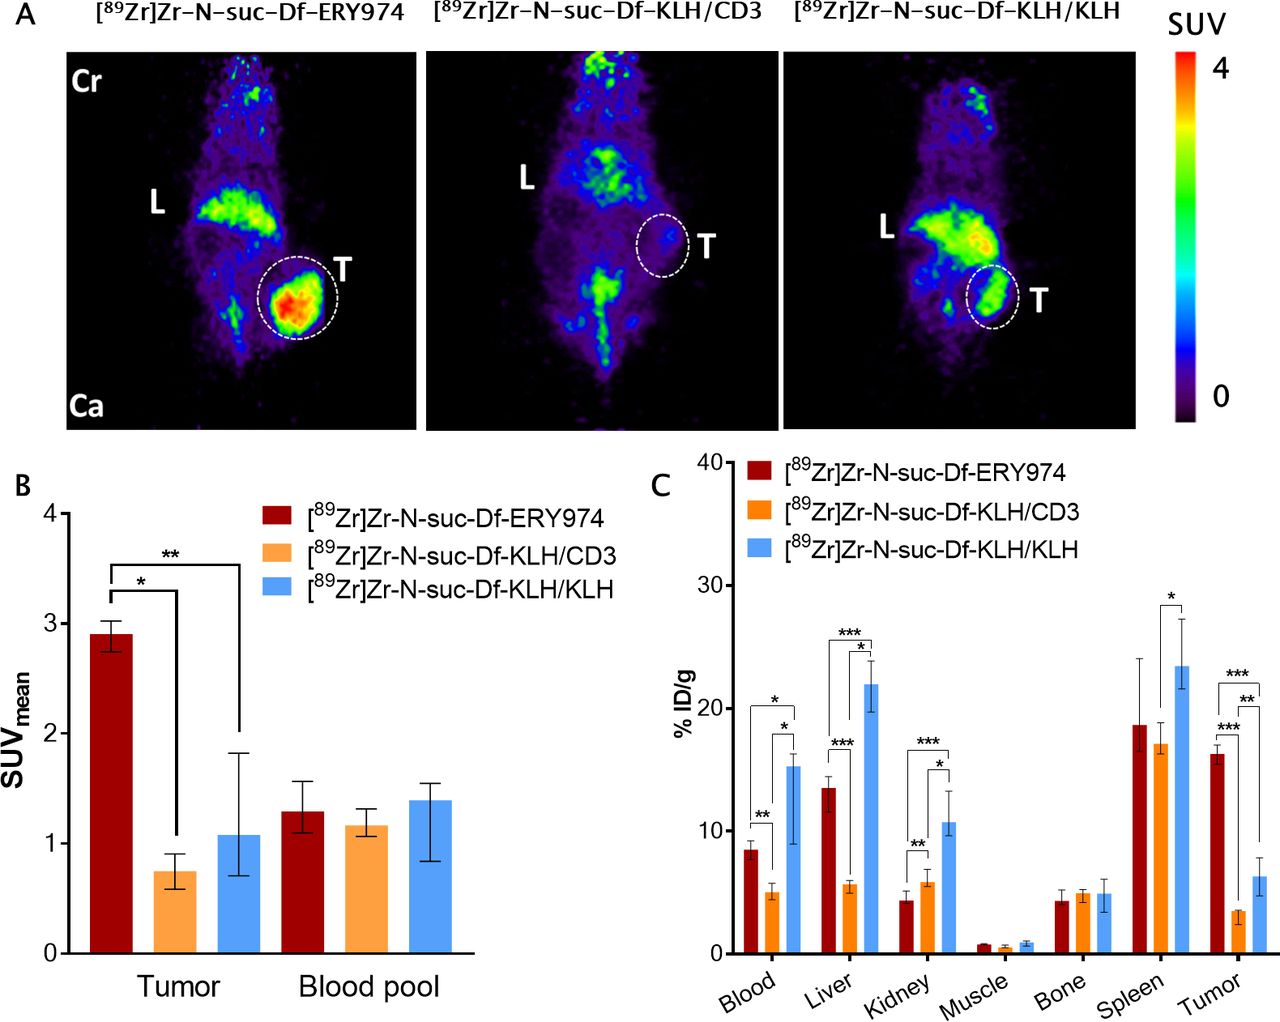
Distribution of [89Zr]Zr-N-suc-Df-ERY974 and control tracers in HepG2 xenograft bearing immunodeficient NOG mice (A) coronal microPET images of HepG2 (white dotted circle) bearing NOG mice injected with 10 µg [89Zr]Zr-N-suc-Df-ERY974, [89Zr]Zr-N-suc-Df-KLH/CD3 or [89Zr]Zr-N-suc-Df-KLH/KLH 168 hours post tracer injection. (B) Quantification of [89Zr]Zr-N-suc-Df-ERY974 (n=6), [89Zr]Zr-N-suc-Df-KLH/CD3 (n=5) or [89Zr]Zr-N-suc-Df-KLH/KLH (n=6) uptake in HepG2 tumor and blood pool. Data shown as median SUVmean and IQR. *P≤0.05; **P≤0.01 (Mann-Whitney U). (C) Ex vivo biodistribution of [89Zr]Zr-N-suc-Df-ERY974, [89Zr]Zr-N-suc-Df-KLH/CD3 and [89Zr]Zr-N-suc-Df-KLH/KLH 168 hours post-tracer administration. Data are expressed as median with IQR. *P≤0.05; **P≤0.01; ***P≤0.001 (Mann-Whitney U). Cr, cranial; Ca, caudal; KLH, keyhole limpet hemocyanin; L, liver; PET, positron emission tomography; SUVmean, standardised uptake value; T, tumor; 89Zr, zirconium-89.
Biodistribution and tumor xenograft uptake of [89Zr]Zr-N-suc-Df-ERY974 in NOG mice engrafted with human immune cells
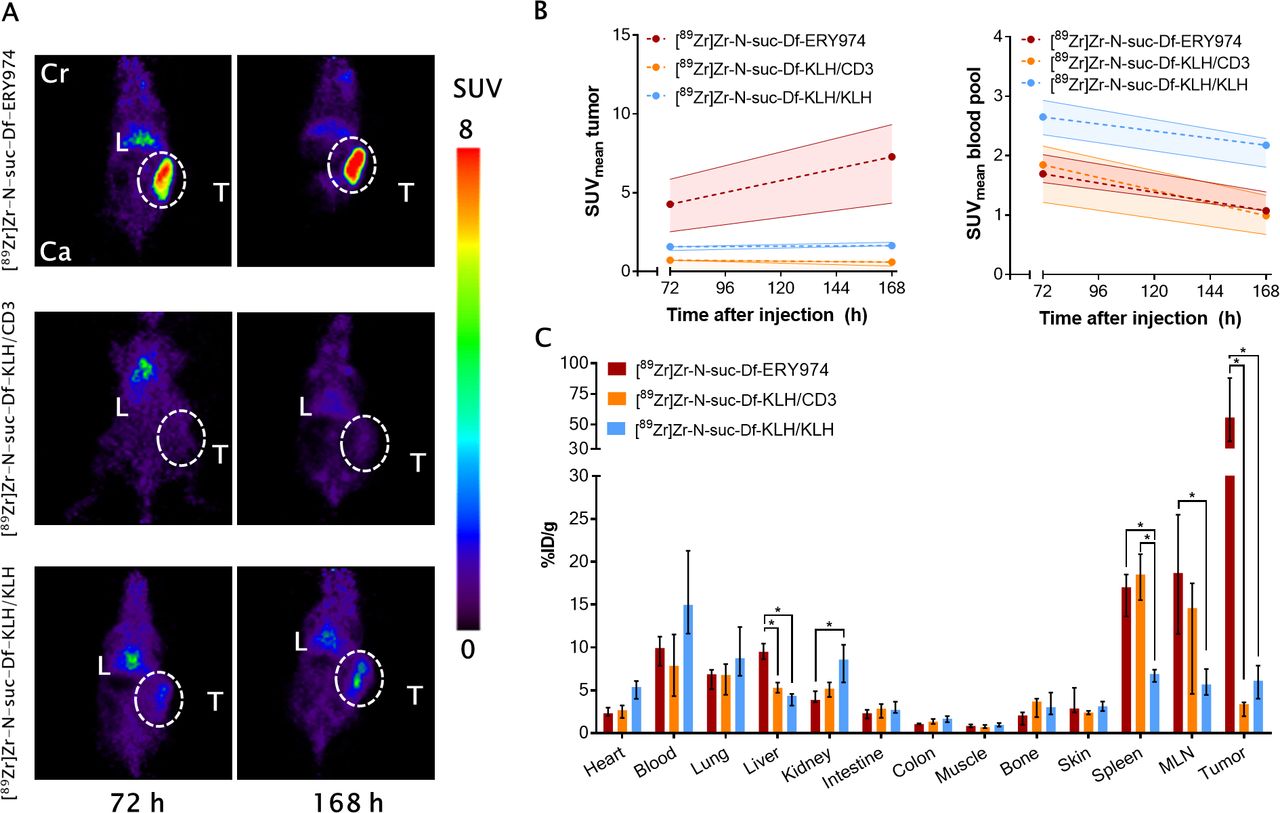
To study the biodistribution and tumor-targeting properties of [89Zr]Zr-N-suc-Df-ERY974 with additional availability of human CD3 on T cells, HepG2 tumor-bearing huNOG mice reconstituted with human immune cells were studied. Compared with HepG2 xenograft bearing NOG mice, [89Zr]Zr-N-suc-Df-ERY974 showed increased tumor uptake in HepG2 bearing huNOG mice with median SUVmean of 7.3 (IQR 4.3–9.3) at 168 hours after injection (figure 4A,B; online supplementary figure S6). Compared with [89Zr]Zr-N-suc-Df-ERY974, control tracers [89Zr]Zr-N-suc-Df-KLH/CD3 and KLH/KLH administered to huNOG mice were taken up lower by the tumor with a median SUVmean of 0.6 (IQR 0.3–0.7) and 1.6 (IQR 1.5–1.9), respectively (figure 4B).
Supplemental material

Distribution of [89Zr]Zr-N-suc-Df-ERY974 and control tracers in HepG2 xenograft bearing humanized NOG mice (A) coronal microPET images of HepG2 (white dotted circle) bearing humanized NOG mice reconstituted with human immune cells injected with 10 µg [89Zr]Zr-N-suc-Df-ERY974, [89Zr]Zr-N-suc-Df-KLH/CD3 or [89Zr]Zr-N-suc-Df-KLH/KLH 72 hours and 168 hours post-tracer injection. (B) Quantification of [89Zr]Zr-N-suc-Df-ERY974 (n=5), [89Zr]Zr-N-suc-Df-KLH/CD3 (n=4) or [89Zr]Zr-N-suc-Df-KLH/KLH (n=6) uptake in HepG2 tumor and blood pool. Data shown as median SUVmean and IQR. (C) Ex vivo biodistribution of [89Zr]Zr-N-suc-Df-ERY974, [89Zr]Zr-N-suc-Df-KLH/CD3 and [89Zr]Zr-N-suc-Df-KLH/KLH 168 hours post-tracer administration. Data are expressed as median with IQR. *P≤0.05 (Mann-Whitney U). Cr, cranial; Ca, caudal; KLH, keyhole limpet hemocyanin; L, liver; MLN, mesenteric lymph node; PET, positron emission tomography; SUVmean, standardised uptake value; T, tumor; 89Zr, zirconium-89.
Apart from tumor uptake, highest organ uptake for [89Zr]Zr-N-suc-Df-ER974 was observed for spleen, followed by mesenteric lymph nodes (MLN) and liver (figure 4C). Both CD3 targeting molecules [89Zr]Zr-N-suc-Df-ERY974 and [89Zr]Zr-N-suc-Df-KLH/CD3 revealed twofold to threefold higher uptake in lymphoid organs such as spleen and MLN than [89Zr]Zr-N-suc-Df-KLH/KLH (figure 4C). Median spleen weight of huNOG mice, as determined by biodistribution at 7 days after tracer administration, was 26 mg (IQR 22–32) and not different between groups. Interestingly, [89Zr]Zr-N-suc-Df-KLH/CD3 showed higher blood levels in huNOG mice than in NOG mice at 168 hours after tracer administration (online supplementary figure S6B). Furthermore, higher binding of [89Zr]Zr-N-suc-Df-ERY974 and [89Zr]Zr-N-suc-Df-KLH/CD3 than [89Zr]Zr-N-suc-Df-KLH/KLH to peripheral blood mononuclear cells of huNOG mice was observed (online supplementary figure S7). Collectively, [89Zr]Zr-N-suc-Df-ERY974 demonstrated increased tumor uptake between NOG and huNOG mice and CD3 specific uptake in lymphoid tissues of huNOG mice.
Supplemental material
Ex vivo autoradiography of tumor and lymphoid tissues of huNOG mice
We performed ex vivo autoradiography and evaluated T cell infiltration to determine microscopic colocalization of tracers in tumors and lymphoid tissues of mice engrafted with human immune cells. In HepG2 tumors, [89Zr]Zr-N-suc-Df-ERY974 gave higher radioactive signal in stromal regions with high CD3+ T cells infiltrate than tumor nests (figure 5A–C). Total radioactivity signal measured by ex vivo autoradiography correlated well with %ID/g of the individual tumor (R2=0.7178; figure 5C). For lymphoid organs spleen and mesenteric lymph nodes, both CD3-targeting tracers located to regions with human CD3+ cells (figure 5E,F). [89Zr]Zr-N-suc-Df-KLH/KLH distributed independent of CD3+ cells (figure 5G).

Intratumoral distribution of [89Zr]Zr-N-suc-Df-ERY974 in HepG2 bearing huNOG mice (A) autoradiography (first panel) of [89Zr]Zr-N-suc-Df-ERY974 in HepG2 bearing huNOG mice with subsequent slides stained for human CD3 (second panel), (H&E; third panel) and human GPC3 (fourth panel). Scale bar length represents 5 mm for whole tissue and 500 µm for magnified tissue. (B) ROI drawing of tumor cells and stromal regions based on H&E staining (upper panel) and the overlay on autoradiography (lower panel). Scale bar length represents 2.5 mm. (C) Quantification of tumor and stromal regions on autoradiography. Circle and square with an inner dot represent the quantification of the tumor and stroma shown in (B). Checked circle and square represents the quantification of tumor and stroma depicted in (A). (D) Mean total tumor value on autoradiography correlated with the %ID/g of the same tumor. (E) Autoradiography (top panel), CD3 immunohistochemistry (middle panel) and H&E staining (bottom panel) of spleen and mesenteric lymph node (MLN) of huNOG mice injected with [89Zr]Zr-N-suc-Df-ERY974. Autoradiography and H&E were performed on the same slide. scale bar length represents 2.5 mm. (F) Autoradiography (top panel), CD3 immunohistochemistry (middle panel) H&E staining (bottom panel) of spleen and MLN of huNOG mice injected with [89Zr]Zr-N-suc-Df-KLH/CD3. Scale bar length represents 2.5 mm. (G) Autoradiography (top panel), CD3 immunohistochemistry (middle panel) and H&E staining (bottom panel) of spleen and MLN of huNOG mice injected with [89Zr]Zr-N-suc-Df-KLH/KLH. Scale bar length represents 2.5 mm. GPC3, glypican 3; huNOG, humanised NOG; KLH, keyhole limpet hemocyanin; 89Zr, zirconium-89.
The T cell infiltration of HepG2 xenografts observed in huNOG mice injected with[89Zr]Zr-N-suc-Df-ERY974 was not observed following injection of [89Zr]Zr-N-suc-Df-KLH/CD3 and [89Zr]Zr-N-suc-Df-KLH/KLH, in both tumor and stromal regions (online supplementary figure S8A). Quantification of CD3+ T cells confirmed less T cell infiltration with 41 (IQR 21–303) CD3+ cells/mm2 for [89Zr]Zr-N-suc-Df-KLH/CD3, 50 (IQR 22–85) CD3+ cells/mm2 for [89Zr]Zr-N-suc-Df-KLH/KLH and 707 (IQR 670–1133) CD3+ cells/mm2 for [89Zr]Zr-N-suc-Df-ERY974, (online supplementary figure S8B). This difference might be explained by the pharmacological effect of 10 µg of [89Zr]Zr-N-suc-Df-ERY974 that leads to immune cell infiltration as demonstrated earlier,6 which effect is absent for [89Zr]Zr-N-suc-Df-KLH/CD3 and [89Zr]Zr-N-suc-Df-KLH/KLH. Tumor weight at 7 days after [89Zr]Zr-N-suc-Df-ERY974 administration was lower compared with [89Zr]Zr-N-suc-Df-KLH/CD3 or [89Zr]Zr-N-suc-Df-KLH/KLH, with median weight of 238 mg (IQR 194–367) vs 676 mg (IQR 479–807), respectively (p<0.05; data not shown). We therefore studied the distribution of [89Zr]Zr-N-suc-Df-KLH/CD3 and [89Zr]Zr-N-suc-Df-KLH/KLH in a HepG2 bearing huNOG mice co-injected with 10 µg of N-suc-Df-ERY974. N-suc-Df-ERY974 coinjection resulted in strong CD3+ T cell infiltration in HepG2 tumors of huNOG administered with [89Zr]Zr-N-suc-Df-KLH/CD3 or [89Zr]Zr-N-suc-Df-KLH/KLH, in similar range as [89Zr]Zr-N-suc-Df-ERY974 (online supplementary figure S9). ERY974 coinjection did not result in major differences in physiological organ uptake of [89Zr]Zr-N-suc-Df-KLH/CD3 or [89Zr]Zr-N-suc-Df-KLH/KLH, but did increase tumor uptake from 3.4 (IQR 2.0–3.6) to 10.0 (IQR 9.9–16.3) and from 6.1 (IQR 4.0–7.9) to 16.6 %ID/g (IQR 10.4–23.8) for [89Zr]Zr-N-suc-Df-KLH/CD3 and [89Zr]Zr-N-suc-Df-KLH/KLH, respectively (online supplementary figure S6).
Supplemental material
Supplemental material
Discussion
This is the first study using molecular imaging to study the influence of T cells on the distribution and tumor uptake of the therapeutic T cell redirecting bispecific antibody ERY974 targeting CD3ε and GPC3. [89Zr]Zr-N-suc-Df-ERY974 tumor uptake was higher in human immune cell engrafted mice than in immunodeficient mice, and localized in the T cell infiltrated stromal regions. Next to tumor uptake, second highest [89Zr]Zr-N-suc-Df-ERY974 uptake was found in CD3+ lymphoid tissues such as spleen and mesenteric lymph nodes, followed by liver.
The role of T cells on the biodistribution of T cell redirecting antibodies is poorly understood since its biodistribution is mainly studied in immunocompromised mice, which prohibits to study the influence of the CD3 arm of the bispecific antibody.12 15 The current study shows that in the presence of T cells, specific physiological uptake is observed in CD3+ T cell containing organs such as spleen and lymph nodes. In contrast, for antibodies targeting tumor cell and growth factors highest physiological uptake is usually observed in liver.16 However, a recent clinical molecular imaging study with the immune checkpoint inhibitor atezolizumab demonstrated that lymphoid tissues can also be an important compartment for drug biodistribution.17 For example, [89Zr]Zr-N-suc-Df-atezolizumab, targeting the immune checkpoint programmed death-ligand 1, showed highest physiological uptake in spleen of patients with cancer. Furthermore, in the majority of the patients molecular PET imaging with [89Zr]Zr-N-suc-Df-atezolizumab was able to detect healthy lymph nodes.
The role of the CD3ε directed arm of a bispecific T cell redirecting antibody will be impacted by its affinity. An interesting study evaluated the impact of a CD3ε binding arm on the biodistribution of T cell redirecting antibodies in a human CD3ε transgenic mouse model using a HER2/CD3 bispecific antibody with different affinities for CD3ε.10 A low affinity for CD3ε (CD3εL), which was considered 50 nM, did not redirect a non-tumor targeting bispecific antibody to lymphoid organs. In contrast, subnanomolar (0.5 nM) and picomolar (0.05 nM) affinity to CD3ε showed extensive distribution to lymphoid tissues such as spleen and lymph nodes, which could be blocked by a 100-fold excess of unlabeled CD3 single arm antibody. For the tumor targeting of HER2/CD3ε antibody, the antibodies with high affinity for CD3ε lowered tumor targeting compared with HER2/CD3εL. Tumor uptake of HER2/CD3εL could only be reduced by an excess of unlabeled HER2 single arm antibody and not by CD3 single arm antibody, suggesting limited effect of CD3ε on tumor uptake. [89Zr]Zr-N-suc-Df-ERY974 and [89Zr]Zr-N-suc-Df-KLH/CD3, with a submicromolar (207 nM) affinity for CD3ε, have a lower affinity compared with the CD3εL. Despite the lower affinity for CD3ε, specific uptake in spleen and lymph nodes was shown for [89Zr]Zr-N-suc-Df-ERY974 and [89Zr]Zr-N-suc-Df-KLH/CD3 in huNOG mice. Moreover, tumor uptake of [89Zr]Zr-N-suc-Df-ERY974 was threefold higher compared with uptake in the tumors of mice lacking T cells. On administration of a pharmacological active dose of [89Zr]Zr-N-suc-Df-ERY9746 tumors got heavily infiltrated with T cells, both in intratumoral and in stromal regions. Autoradiography illustrated that [89Zr]Zr-N-suc-Df-ERY974 was predominantly localized to T cell infiltrated stromal regions. The T cell infiltration of the tumor might be due to local proliferation of resident T cells on activation by the bispecific antibody as demonstrated in earlier studies6 18 19 or by bispecific antibody mediated migration. In our study [89Zr]Zr-N-suc-Df-ERY974 specifically bound to peripheral blood cells. On encountering the tumor, [89Zr]Zr-N-suc-Df-ERY974-bound T cells might get into the tumor due to GPC3 expression, resulting in increased tumorous T cell infiltration and ERY974 uptake. An immunoPET study in a CD3 transgenic mouse model bearing a mucin16 (MUC16) positive xenograft with an 89Zr-labeled full-length bispecific T cell redirecting antibody REGN4018 targeting MUC16 and CD3ε also demonstrated tumor and secondary lymphoid organ targeting.20 However, affinities for both targets were not disclosed and tumor uptake of 89Zr-labeled REGN4018 was not compared with control tracers or tumor-bearing wild type mice.
As T cell redirecting bispecific antibodies have not shown antitumor effects in patients with solid tumors yet, it is key to better understand its behavior to support drug development. Clinical information regarding the biodistribution of T cell redirecting antibodies could provide additional insight in tumor targeting properties and off-target distribution. However, clinical data are strikingly limited. The distribution of an 89Zr-labeled 54 kDa bispecific T cell engager AMG211 targeting CD3ε (affinity 310 nM) and carcinoembryonic antigen (affinity 5.5 nM) was studied in a feasibility study in nine patients with advanced gastrointestinal adenocarcinomas.21 [89Zr]Zr-N-suc-Df-AMG211 clearly accumulated in spleen and bone marrow, both CD3-rich tissues. Uptake of [89Zr]Zr-N-suc-Df-AMG211 in tumor lesions was highly heterogeneous within and between patients. For [89Zr]Zr-N-suc-Df-ERY974, evaluation in a clinical trial would be helpful to further understand ERY974’s behavior and tumor targeting properties. Whole body non-invasive imaging of [89Zr]Zr-N-suc-Df-ERY974 might help to inform potential target-related drug impact in vivo including off-tumor/on-target or off-target uptake. Information regarding distribution of [89Zr]Zr-N-suc-Df-ERY974 at baseline and during ERY974 treatment, could further aid in the drug development of ERY974. Biopsies would allow to correlate PET signal with multiple parameters such as tumorous T cell infiltration and GPC3 protein expression. Furthermore, biopsies combined with tissue autoradiography could provide information regarding 89Zr distribution in both stroma and tumor areas, as shown in this preclinical study. With the potency of T cell redirecting bispecific antibodies, radiolabeling a low protein dose would be a challenge in a clinical study. In the end, results from such a clinical study could support rational future trial design.
Although the engraftment of human immune cells allowed us to study the influence of T cells on the biodistribution of [89Zr]Zr-N-suc-Df-ERY974, the mouse model used in this study does not fully recapitulate the human environment. The reconstituted immune cells that were present in the mice in this study did home to lymphoid tissues and were able to infiltrate xenografts, leading to CD3 specific uptake of [89Zr]Zr-N-suc-Df-ERY974 and [89Zr]Zr-N-suc-Df-KLH/CD3. Uptake of [89Zr]Zr-N-suc-Df-ERY974 found in lymphoid organs of these mice needs to be interpreted and potentially translated with caution. We observed CD3 independent uptake of [89Zr]Zr-N-suc-Df-ERY974 in spleens due to the genetic background of the mice used in this study. This effect was mediated by radioactivity-related spleen aplasia and mAb affinity for FcγR. The non-specific spleen uptake was observed earlier in SCID mice,22 NOG mice23 and NSG mice.14 In a more comprehensive study, the role of radioactivity, mouse strain and FcγR affinity of the mAb confirmed the underlying mechanism.13 Besides the lack of a fully intact and functional human immune system, lack of cross-reactivity toward GPC3 did not allow us to study the non-tumor targeting of ERY974 to organs with physiological GPC3 expression and is therefore a limitation of this study. However, GPC3 expression in healthy tissues in adult mammals is rarely observed and is, therefore, less likely to influence biodistribution of [89Zr]Zr-N-suc-Df-ERY974.
In our study, we did not observe a reduction in HepG2 xenograft uptake of [89Zr]Zr-N-suc-Df-ERY974 in the presence of an excess of unlabeled ERY974. This might be due to several reasons. First, high GPC3 expression of HepG2 in vitro and ex vivo was observed, and might be too high to be blocked by excess of unlabeled ERY974 in vivo. In the TOV-21G xenograft, which expresses lower levels of GPC3, an excess of unlabeled ERY974 was able to reduce tumor uptake of [89Zr]Zr-N-suc-Df-ERY974. Second, the monovalent character of ERY974 might be partial responsible for the lack of reduction in HepG2 xenograft uptake on an excess of unlabeled ERY974. Adding an excess of bivalent GPC3 mAb namely reduced tumor-to-blood ratio. Furthermore circulating GPC3 protein shedded from the HepG2 tumor xenograft might redirect [89Zr]Zr-N-suc-Df-ERY974 to the liver and prevent tumor uptake. This phenomenon has been described for the epidermal growth factor receptor (EGFR) and an EGFR targeting mAb imgatuzumab. Shed EGFR in the circulation derived from the xenograft A431, that expresses high levels of EGFR, was able to redirect the 89Zr-labeled imgatuzumab to the liver at a low tracer protein dose.24 In that study, increasing the tracer protein dose led to a reduced liver and increased tumor uptake. Although we do not have data on the levels of circulating GPC3 protein in our study, in the presence of an excess of unlabeled ERY974 liver uptake of [89Zr]Zr-N-suc-Df-ERY974 was reduced. The cell line HepG2 has been shown to gradually increase secretion of GPC3 protein up to 48 hours of in vitro culture.25 In addition, concentration of GPC3 protein in serum has been described in patients with hepatocellular carcinoma ranging from 150 to 3000 ng/mL.26
These data provide a rationale to study the biodistribution and tumor targeting properties of [89Zr]Zr-N-suc-Df-ERY974 in a clinical trial to support ERY974 drug development.
Supplemental material
Acknowledgments
We thank Linda Pot for assistance with immunohistochemical stainings and Iris Kluft for assistance with the manufacturing of the conjugated antibodies. Furthermore, we thank Athos Gianella-Borradori, Shohei Kishishita, Kenji Hashioto, Norihisa Ohishi for their input in the design of this study.
References
Footnotes
Contributors Study concept and design: all authors. Acquisition of data: SJHW and DG. Analysis and interpretation of data: all authors. Study supervision: CPS, ML-dH and EDV. Writing, review and/or revision of the manuscript: all authors.
Funding A research grant to EDV was obtained from Chugai and made available to the institution.
Competing interests TI, YS and NS are employees of Chugai Pharmaceutical and have ownership interest (including stocks and patents) in Chugai Pharmaceutical. A research grant to EDV was obtained from Chugai and made available to the institution.
Patient consent for publication Not required.
Ethics approval All animal experiments were approved by the Institutional Animal Care and Use Committee of the University of Groningen.
Provenance and peer review Not commissioned; externally peer reviewed.
Data availability statement Data that support the findings of this study are available from the corresponding author on request.