Article Text

Abstract
Background Despite their revolutionary success in cancer treatment over the last decades, immunotherapies encounter limitations in certain tumor types and patients. The efficacy of immunotherapies depends on tumor antigen-specific CD8 T-cell viability and functionality within the immunosuppressive tumor microenvironment, where oxygen levels are often low. Hypoxia can reduce CD8 T-cell fitness in several ways and CD8 T cells are mostly excluded from hypoxic tumor regions. Given the challenges to achieve durable reduction of hypoxia in the clinic, ameliorating CD8 T-cell survival and effector function in hypoxic condition could improve tumor response to immunotherapies.
Methods Activated CD8 T cells were exposed to hypoxia and metformin and analyzed by fluorescence-activated cell sorting for cell proliferation, apoptosis and phenotype. In vivo, metformin was administered to mice bearing hypoxic tumors and receiving either adoptive cell therapy with tumor-specific CD8 T cells, or immune checkpoint inhibitors; tumor growth was followed over time and CD8 T-cell infiltration, survival and localization in normoxic or hypoxic tumor regions were assessed by flow cytometry and immunofluorescence. Tumor oxygenation and hypoxia were measured by electron paramagnetic resonance and pimonidazole staining, respectively.
Results We found that the antidiabetic drug metformin directly improved CD8 T-cell fitness in hypoxia, both in vitro and in vivo. Metformin rescued murine and human CD8 T cells from hypoxia-induced apoptosis and increased their proliferation and cytokine production, while blunting the upregulation of programmed cell death protein 1 and lymphocyte-activation gene 3. This appeared to result from a reduced production of reactive oxygen species, due to the inhibition of mitochondrial complex I. Differently from what others reported, metformin did not reduce tumor hypoxia, but rather increased CD8 T-cell infiltration and survival in hypoxic tumor areas, and synergized with cyclophosphamide to enhance tumor response to adoptive cell therapy or immune checkpoint blockade in different tumor models.
Conclusions This study describes a novel mechanism of action of metformin and presents a promising strategy to achieve immune rejection in hypoxic and immunosuppressive tumors, which would otherwise be resistant to immunotherapy.
- immunotherapy
- lymphocytes, tumor-infiltrating
- tumor microenvironment
Data availability statement
Data are available on reasonable request. All data relevant to the study are included in the article or uploaded as supplementary information.
This is an open access article distributed in accordance with the Creative Commons Attribution Non Commercial (CC BY-NC 4.0) license, which permits others to distribute, remix, adapt, build upon this work non-commercially, and license their derivative works on different terms, provided the original work is properly cited, appropriate credit is given, any changes made indicated, and the use is non-commercial. See http://creativecommons.org/licenses/by-nc/4.0/.
Statistics from Altmetric.com
WHAT IS ALREADY KNOWN ON THIS TOPIC
Tumor hypoxia is a hallmark of solid cancers and contributes to create an immunosuppressive microenvironment that restricts CD8 T-cell infiltration and function within the tumor.
Thus, hypoxia represents a limitation to the efficacy of anticancer immunotherapies.
WHAT THIS STUDY ADDS
CD8 T cells treated with the antidiabetic drug metformin resist to hypoxia-induced apoptosis and immunosuppression, in vitro and in vivo.
Through this newly described effect, metformin improves response to immunotherapy in hypoxic and immunosuppressive tumors.
HOW THIS STUDY MIGHT AFFECT RESEARCH, PRACTICE OR POLICY
Metformin, alone or in combination with cyclophosphamide in highly immunosuppressive tumors, represents a promising and clinically relevant strategy to extend the benefit of immunotherapies to a larger number of patients with cancer.
Introduction
In the last years, immunotherapy has emerged as a very promising treatment against cancer. Immune checkpoint inhibitors, in particular blocking antibodies against the cytotoxic lymphocyte-associated protein 4 (CTLA-4), the programmed cell death protein 1 (PD-1) and its ligand PD-L1, have been approved for several tumor types including advanced melanoma, non-small cell lung cancer and renal cell carcinoma.1 In 2017, two chimeric antigen receptor (CAR) T-cell therapies received Food and Drug Administration approval for hematopoietic tumors.1 However, long-term durable responses remain limited to a relatively low percentage of patients and tumor types.1 Whether consisting in the reinvigoration of pre-existing but suppressed tumor-specific CD8 T cells, as is the case for immune checkpoint inhibitors, or in the infusion of CD8 T cells recognizing tumor antigens, as for adoptive cell therapies (ACT), immunotherapies depend on CD8 T cell-tumor infiltration, localization, fitness and effector activity in the hostile, immunosuppressive tumor microenvironment (TME).
Hypoxia is a common feature of most solid tumors, which are poorly or inefficiently perfused due to insufficient or aberrant blood vessel formation within the tumor, leading to low concentrations of oxygen and nutrients and accumulation of waste products.2–5 Through the activity of the hypoxia-inducible factor (HIF)-1, hypoxia enhances glycolysis and reduces oxidative phosphorylation, exacerbating the competition for glucose.4–6 Beside metabolic stress, hypoxia also promotes tumor malignancy, favors tumor immune evasion by downregulating major histocompatibility complex class I expression on tumor cells, and affects immune-cell infiltration and phenotype through the production of chemokines and cytokines.4 5 7 Hypoxia induces the recruitment of myeloid cells and regulatory T cells,4 5 and it enhances their immunosuppressive phenotype inducing the expression of arginase-1, nitric oxide synthase, PD-L1 and of the ectonucleotidases CD39 and CD73 which degrade extracellular ATP into the immunosuppressive metabolite adenosine.4 5 8
Overall, even though HIF-1α stabilization sustains CD8 T-cell effector function by increasing the expression of effector molecules and inhibitory or costimulatory receptors,9 10 tumor hypoxia creates a highly immunosuppressive environment so that these cells do not usually infiltrate hypoxic tumor areas but rather tend to localize close to blood vessels.11 12 Therefore, tumor hypoxia remains a challenge that restrains the success of immunotherapy.
Metformin, the first-line therapy for type 2 diabetes, was shown to reduce tumor incidence in patients with diabetes and is currently evaluated in several cancer clinical trials.13 14 Various direct and indirect antitumoral effects of metformin have been described. Metformin was reported to target cancer-initiating stem cells.14 15 Preclinical studies have shown a synergism between metformin and different types of immunotherapies.16–21 Metformin can modulate the TME through several mechanisms, for instance, by diminishing intratumoral accumulation of myeloid-derived suppressor cells (MDSCs)22 or by reducing their suppressive phenotype.23 24 Metformin was also shown to downregulate PD-L1 expression on cancer cells,20 21 25 26 thus improving CD8 T-cell function against the tumor. Moreover, by reducing oxidative phosphorylation through mitochondrial complex I targeting, metformin attenuates tumor hypoxia in certain cancer types, resulting in better tumor response to PD-1 blockade, γδ T cells immunity or radiotherapy.16 17 27 Metformin was also shown to affect memory/effector T-cell differentiation.18–20 28 In particular, Eikawa et al demonstrated that metformin protects tumor-infiltrating CD8 T cells from apoptosis and exhaustion while favoring conversion from central memory (TCM) to effector memory T cells (TEM) in highly immunogenic tumor models.18 However, the cellular and molecular mechanisms through which metformin reverted immune exhaustion were not explored.
Here, we show that metformin has a direct effect on CD8 T-cell survival and fitness in hypoxia, in vitro and in vivo. This results in improved response to immunotherapies in different tumors, including an autochthonous melanoma model developed in our lab and named TiRP.29 30 This model expresses the MAGE-type antigen P1A and is highly immunosuppressive, representing therefore a clinically relevant model to study primary resistance to immunotherapy.30–32 Through this newly described mode of action, metformin rescues CD8 T cells from a strong immunosuppressive cue that limits the efficacy of immune checkpoint inhibitors or ACT. Alone or in synergism with the lymphodepleting preparative drug cyclophosphamide (CTX), metformin sensitizes resistant and hypoxic tumors to immunotherapy.
Materials and methods
Mice
B10.D2 TiRP-10B+/+;Ink4a/Arfflox/flox (TiRP) mice, B10.D2;Ink4a/Arfflox/flox mice and B10.D2-Rag1KO mice heterozygous for the H-2Ld/P1A35-43-specific TCR transgene (TCRP1A) were previously described.30 C57BL/6 mice, C57BL/6-Tg(Tcra Tcrb)1100Mjb/Crl (OT-1 OVA-TCR) and NOD scid gamma (NSG) mice were purchased, respectively, from Harlan, Charles River, Jackson lab. TiRP RAG1KO mice were a gift from A.M. Schmitt-Verhulst (Marseille)31. Mice were maintained under specific pathogen-free conditions at the Platform Laboratory Animal Facility of the de Duve Institute.
Cell lines
L1210.P1A.B7-1, P511 and P1.204 cell lines were already described.30 MC38 cells were a gift from P. Berraondo (Navarra); LL2-Thy1.1-OVA (LLC-OVA) cells, expressing a cytoplasmic form of ovalbumin, were a gift from D. Fearon (Cambridge); OVA-transfected EL-4 cells (EG7) were a gift from J. Van Ginderachter (Brussels); B16F1 cells were obtained from ATCC (CRL-6323). T429.11 clone was derived from an inducible TiRP melanoma as already described.30
All cells were maintained at 37°C and 8% CO2. All culture media contained 10% fetal bovin serum, L-arginine (0.55 mM, Merck), L-asparagine (0.24 mM, Merck), glutamine (1.5 mM, Merck), 50 U/mL penicillin and 50 mg/mL streptomycin (Life Technologies) (complete medium). Cell lines were routinely tested for mycoplasma contamination. For experiments in hypoxia, a hypoxystation (Whitley H35) at 37°C, 8% CO2 and 1% O2 was used.
Mice treatments
4OH-Tamoxifen (Imaginechem) dissolved in ethanol and mineral oil (1:9 ratio) and sonicated for 30 min, was injected subcutaneously (2 mg/200 µL) in the neck area of gender-matched TiRP mice aged 7–9 weeks; experiments were performed on unpigmented tumors. Gender-matched C57BL/6 wild-type mice aged 7–9 weeks were injected subcutaneously with 106 B16F1, LLC-OVA, EG7-OVA or MC38 cells; B10.D2;Ink4a/Arfflox/flox or TiRP RAG1KO mice were injected intradermally with 2×10⁶ million cells of freshly dissociated TiRP tumors. Tumor volume was calculated as: volume=π×width2×length/6. Before treatment, mice were randomized based on tumor size. CTX (Sigma C7397) was injected intraperitoneally at 100 mg/kg. For ACT, 107 TCRP1A CD8 T cells or 2×10⁶ OT-1 CD8 T cells (in 200 μL phosphate buffered saline) were injected in the mouse tail vein. Metformin (Enzo ALX-270-432) was dissolved in mice drinking water at 0.5 mg/mL and refreshed every 3 days. Four injections of anti-PD1 antibody (Bio-X-Cell, RMP1-14) or RatIgG2a isotype (Bio-X-Cell, 2A3) at 100 µg/mouse (B16F1) or 200 µg/mouse (MC38) were performed intraperitoneally every 3 days. For hypoxia detection, 60 mg/kg of pimonidazole hydrochloride (Hypoxyprobe) was injected intraperitoneally 45 min before mice sacrifice. Sample sizes for all experiments were chosen based on previous experiences.
Mouse CD8 T-cell activation and treatment
CD8 T cells were isolated from spleen, axillary and inguinal lymph nodes of TCRP1A females aged 7–10 weeks using antimouse CD8α (Ly-2) MicroBeads (Miltenyi Biotech, 130-117-044), and co-cultured with irradiated (10 000 rads) L1210.P1A.B7-1 cells at 1:2 ratio in IMDM (GIBCO 12440053) complete medium containing b-mercaptoethanol (50 μM, Sigma, M3148). Four days later, CD8 T cells were purified on a lymphoprep gradient (StemCell, 07851) and used for ACT or cultured in presence of rhIL-2 (25 U/mL, StemCell, 78036.2) and the indicated treatment at 21% or 1% O2. The following reagents were used: metformin (Enzo, ALX-270-432, 2 mM in H2O), tert-butyl hydroperoxide (Sigma, 458139), L-glutathione (Sigma, G6529, 3.2 mM in H2O), N-acetyl-L-cysteine (Merck Life Science, A7250-25G, 10 mM in PBS), IACS-010759 (Axon Medchem, 2909, 100 nM in dimethyl sulfoxide). For proliferation, 106/mL cells were labeled with Violet CellTrace (Invitrogen, C34557) at 5 µM for 20 min at 37°C according to the manufacturer’s instructions, before treatments. For preconditioning experiments, CD8 T cells were treated with metformin (2 mM) or H2O for 3 days before ACT.
For OT-1 CD8 T-cell activation, splenocytes of OT-1 OVA-TCR females aged 7–12 weeks were cultured for 3 days in RPMI (GIBCO 52400041) complete medium containing b-mercaptoethanol (50 μM, Sigma), sodium pyruvate (1 mM, GIBCO 11360070), 1 µg/mL SIINFEKL peptide and rhIL-2 at 25 U/mL. On day 3, cells were seeded in fresh medium with rhIL-2. After 3 days, CD8 T cells were purified on a lymphoprep gradient and used for in vitro experiments or for ACT, as above; for preconditioning experiments, metformin (2 mM) or H2O were added during the last 3 days of culture.
Flow cytometry staining
Annexin V staining was performed in annexin buffer (20 min, room temperature); 7-aminoactinomycin D was added before acquisition. CM-H2DCFDA or dihydrorhodamine 123 staining were performed in preconditioned Hank’s balanced salt solution (Sigma, 6648) in normoxia or hypoxia for 30 min. Fixable viability dye (15 min, 4°C) was used to identify dead cells, followed by CD16/CD32 blocking (15 min, 4°C) and incubation with extracellular antibody (20 min, 4°C). Intracellular stainings (30 min, 4°C) were performed after cell fixation and permeabilization; anti-pimonidazole antibody was incubated 1 hour at 37°C. Samples were acquired at BD LRSFortessa or BD FACSVerse based on the experiment and analyzed with FlowJo V.10.7.1. Antibodies and reagents are listed in online supplemental table S1.
Supplemental material
Statistics
Data entry and analyses were performed in a blinded fashion. Statistical analyses were performed using GraphPad Prism software (V.9.2) using two-tailed unpaired t-test for pairwise comparison; for tumor growth two-way analysis of variance was used, with Tukey’s correction for multiple comparisons when comparing groups; survival curves were compared with log-rank (Mantel-Cox) test.
Additional information, including lists of antibodies used for immunohistochemistry (online supplemental table S2) and for western blot (online supplemental table S3), can be found in the online supplemental material.
Results
Metformin rescues CD8 T-cell fitness in hypoxia in vitro
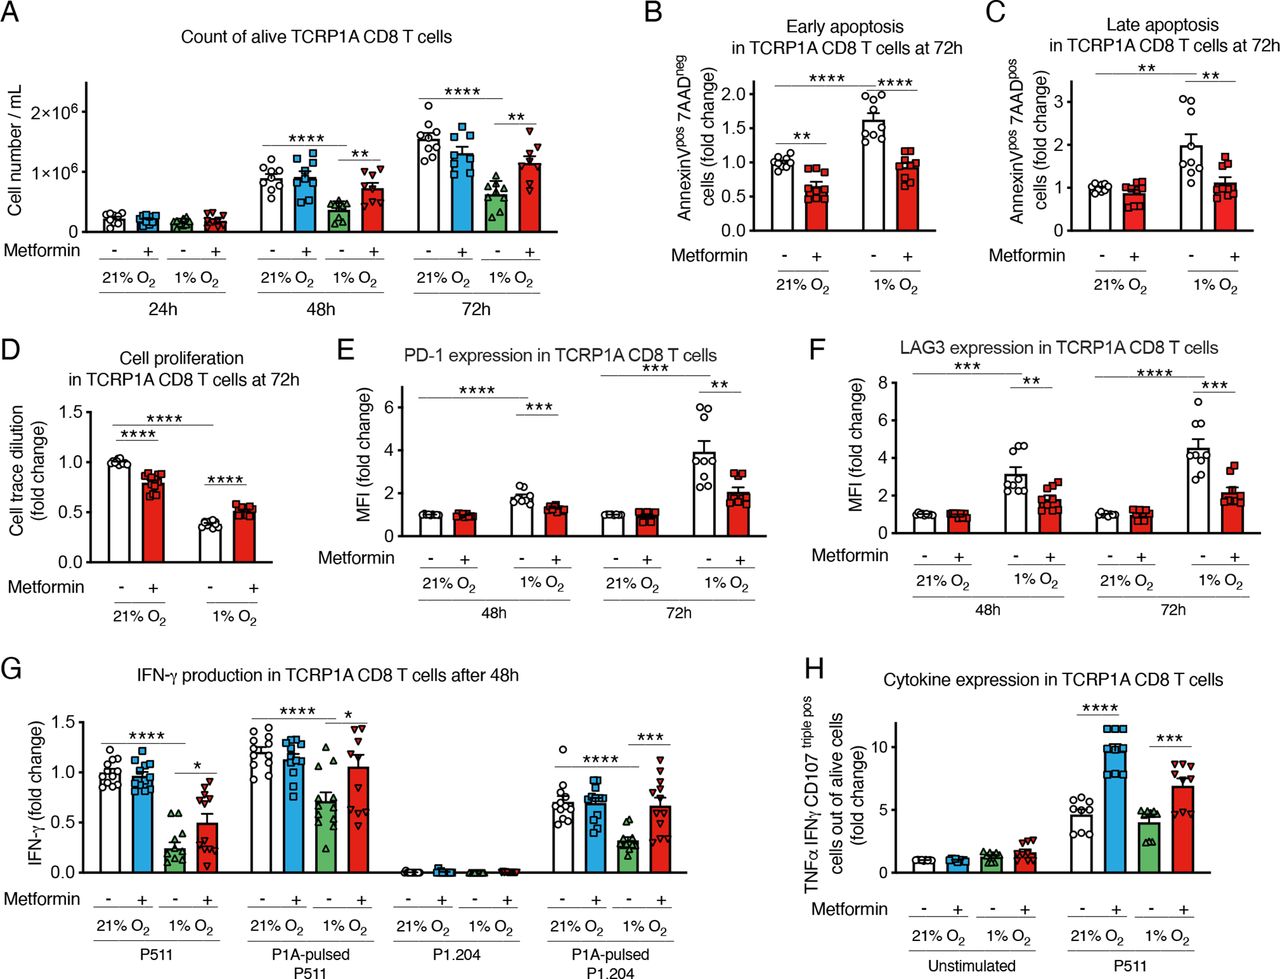
To study the effect of hypoxia on activated CD8 T cells, we used CD8 T cells from TCRP1A transgenic mice, which recognize the MAGE-type tumor antigen P1A. After 4 days of activation in normoxia, cells were incubated at 21% or 1% oxygen for 24–72 hours. Exposure to hypoxia reduced cell number and expansion compared with cells incubated in normoxia (figure 1A); in particular, hypoxia increased early and late apoptosis and reduced CD8 T-cell proliferation (figure 1B–D and online supplemental figure 1A–D). Interestingly, the reduced cell number and proliferation and the induction of apoptosis in cells incubated at 1% oxygen were partially rescued when CD8 T cells were treated with metformin, indicating that this drug directly improved CD8 T-cell survival in hypoxic conditions (figure 1A–D and online supplemental figure 1A–D). Similar results were obtained with OT-1 CD8 T cells, which recognize the ovalbumin antigenic peptide (OVA) (online supplemental figure 1E–H).

Metformin rescues CD8 T-cell fitness in hypoxia in vitro. (A) Viable cell count of activated TCRP1A CD8 T cells incubated in normoxia (21% O2) or hypoxia (1% O2) in presence or not of metformin (2 mM). (B, C) Quantification of early (B) and late (C) apoptosis measured by fluorescence-activated cell sorting (FACS) staining for Annexin V and 7-aminoactinomycin D (7-AAD) in cells treated as in (A) for 72 hours. (D) Activated TCRP1A CD8 T cells were labeled with CellTrace Violet Cell Proliferation Kit before being treated as in (A) to assess cell proliferation; proliferation was calculated as dilution of median fluorescence intensity of the violet dye between day 0 (before treatments) and 72 hours of treatments. (E, F) Programmed cell death protein 1 (PD-1) (E) and lymphocyte-activation gene 3 (LAG3) (F) expression measured by FACS in cells treated as in (A). (G) ELISA for interferon (IFN)-γ in the supernatant of cells treated as in (A) for 48 hours before being co-cultured ON with P511 or P1.204 cells, pulsed or not with the P1A antigen as indicated. (H) tumor necrosis factor (TNF)-α, IFN-γ and lysosomal-associated membrane protein 1 (Lamp-1/CD107) expression measured by FACS in cells treated as in (A) for 48 hours before being stimulated with P511 cells for 5 hours. Results in B-H are expressed in fold changes compared with normoxia control. A–C, E, F, H is a pool of three independent experiments; D, G is a pool of four independent experiments. All the conditions are assessed in triplicate in each individual experiment. MFI, median fluorescence intensity. All data are mean±SEM. *P<0.05; **p<0.01; ***p<0.001; ****p<0.0001, calculated by two-tailed unpaired t-test.
We also analyzed CD8 T-cell phenotype. As previously reported,9 hypoxia increased the expression of the immune checkpoint markers PD-1 and LAG3 (figure 1E,F); yet, this induction was reduced by metformin (figure 1E,F). Consistent with the immunosuppressive effect of hypoxia, incubation at low oxygen tension reduced interferon (IFN)-γ production by CD8 T cells co-cultured with P815 cells expressing the P1A antigen (P511) or with P1A-negative cells (P1.204) pulsed with the P1A antigenic peptide (figure 1G); however, metformin restored cytokine production in response to target cell exposure in hypoxic condition (figure 1G). Similar results were obtained by intracellular cytokine staining (ICS) for tumor necrosis factor (TNF)-α, IFN-γ and lysosomal-associated membrane protein 1 (Lamp-1/CD107) (figure 1H).
These findings indicated a direct beneficial effect of metformin on CD8 T cells exposed to hypoxia, rescuing them from cell growth arrest and apoptosis, and restoring CD8 T-cell effector function, by downregulating the expression of exhaustion markers and improving cytokine production.
Metformin improves tumor response to adoptive cell therapy and CD8 T-cell infiltration in hypoxic TiRP tumor areas
Given these results we sought to investigate whether metformin could improve CD8 T-cell fitness in vivo in hypoxic tumors. We previously showed that the autochthonous melanoma TiRP tumors are resistant to ACT with activated TCRP1A CD8 T cells due to an immunosuppressive TME that induces apoptosis of tumor-specific CD8 T cells and their disappearance from the tumor.30 Apoptosis of tumor-infiltrating T lymphocytes (TILs) was triggered by Fas-L expressed by polymorphonuclear MDSC (PMN-MDSC), which are highly enriched in TiRP tumors. Therefore, to create a favorable milieu for the engraftment of newly transferred CD8 T cells, we treated TiRP mice with one injection of lymphodepleting dose of cyclophosphamide (CTX) one day before ACT, similarly as in the preparative regimen for CAR T-cell therapy.33 34 In parallel, metformin was supplemented in the drinking water from the day of ACT until the end of the experiment. Consistent with our previous report,30 ACT per se did not affect tumor growth in TiRP mice (figure 2A and online supplemental figure 2A). In contrast, both CTX or metformin alone sensitized TiRP tumors to ACT, resulting in reduced tumor growth and enhanced mice survival (figure 2A,B and online supplemental figure 2A); these effects were further improved when CTX and metformin were combined together (figure 2A,B and online supplemental figure 2A). Interestingly, we observed that a single injection of CTX significantly delayed tumor growth in TiRP mice even in the absence of ACT, although tumor response was further improved by immunotherapy (figure 2A and online supplemental figure 2A), suggesting a direct antitumor effect that could be due to the cytostatic properties of CTX. In contrast, metformin was ineffective in the absence of ACT (figure 2A and online supplemental figure 2A), indicating that the antitumoral effect of metformin was dependent on adoptively transferred tumor antigen-specific CD8 T cells in this model. In line with that, we confirmed that CTX, but not metformin, retarded growth of TiRP and MC38 tumors, in both immunocompetent and immunodeficient mice (online supplemental figure 2B,C). We further validated the direct cytostatic effect of CTX on tumor cells by treating the TiRP-derived cell line (T429.11) and the MC38 cell line in vitro with an active metabolite of CTX, 4-hydroperoxycyclophosphamide (online supplemental figure 2D).
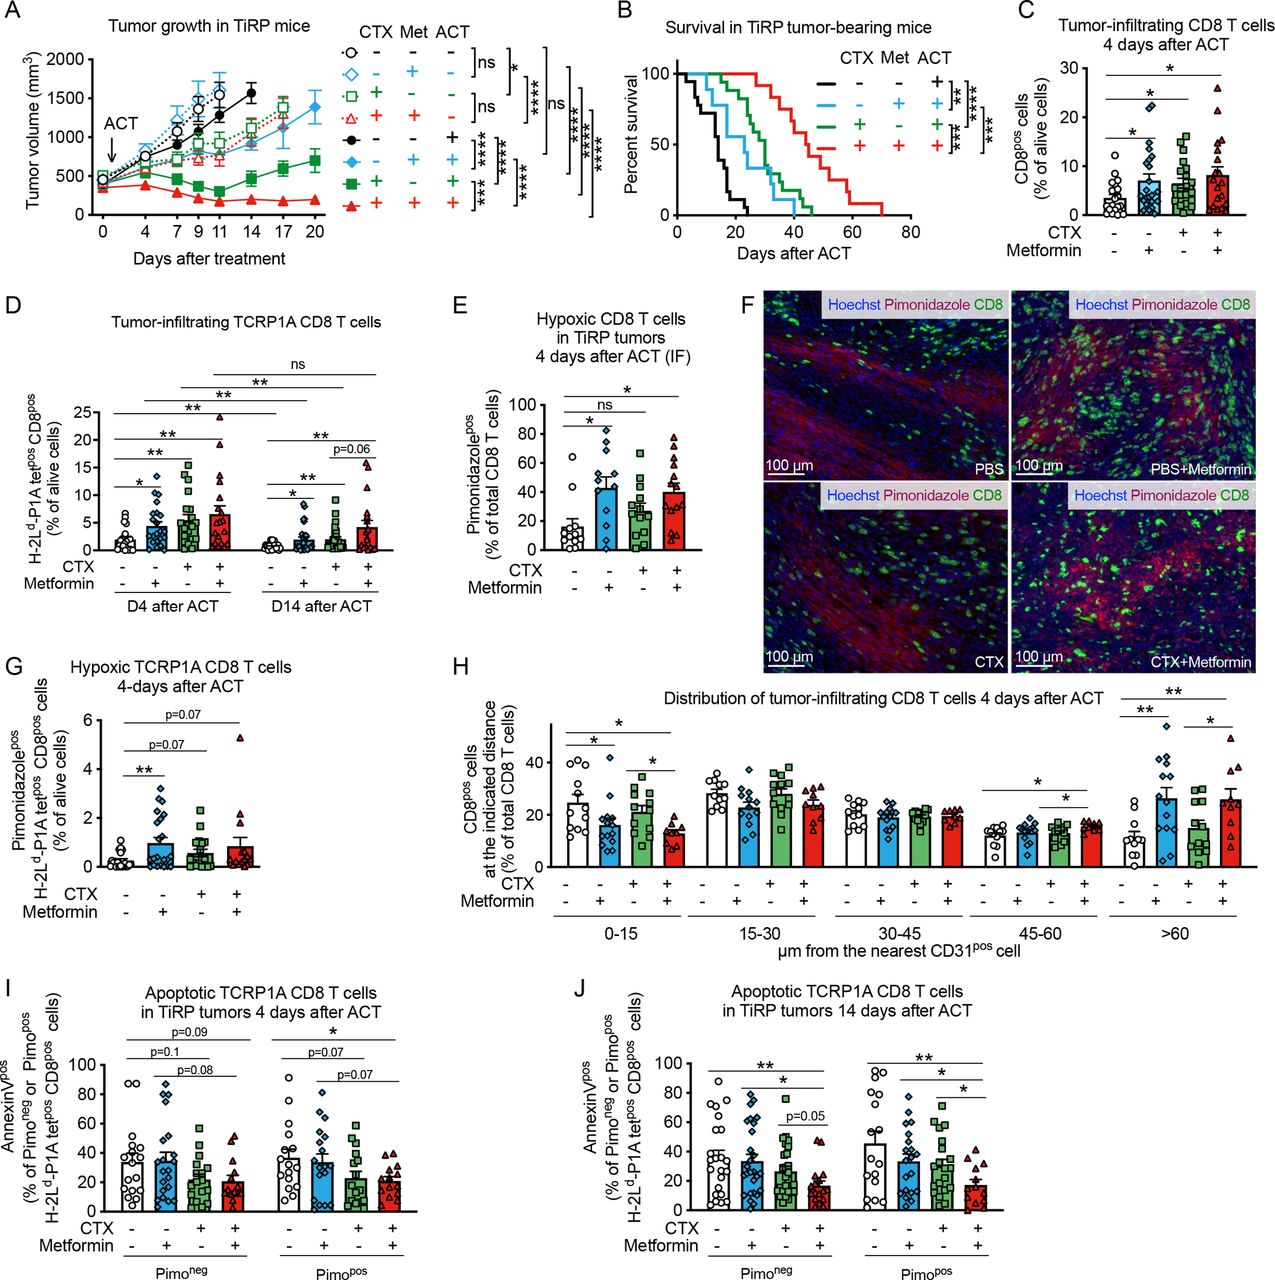
Metformin improves tumor response to adoptive cell therapy (ACT) and CD8 T-cell infiltration in hypoxic TiRP tumor areas. (A) Tumor growth in TiRP mice that have received a single injection of cyclophosphamide (CTX, 100 mg/kg) or phosphate buffered saline (PBS) when the tumor size was around 400 mm3, followed (continuous lines) or not (dotted lines) by ACT of 10 million activated TCRP1A CD8 T cells 24 hours later and treated or not with metformin (0.5 mg/mL) in drinking water for 20 days after ACT or when any humane end point was reached (A, PBS no ACT: n=12; PBS+metformin no ACT: n=8; CTX no ACT: n=10; CTX+metformin no ACT: n=9; PBS and ACT: n=25; PBS+metformin and ACT: n=23; CTX and ACT: n=17; CTX+metformin and ACT: n=13). (B) Kaplan-Meier survival curve in TiRP mice treated as in (A) on ACT (B, PBS: n=18; PBS+metformin: n=9; CTX: n=17; CTX+metformin: n=12). (C) Fluorescence-activated cell sorting (FACS) analysis of CD8 T-cell tumor infiltration in TiRP mice treated as in (A) 4 days after ACT (C, PBS: n=21; PBS+metformin: n=23; CTX: n=20; CTX+metformin: n=19). (D) FACS analysis of TCRP1A CD8 T-cell tumor infiltration in TiRP mice treated as in (A), 4 days and 14 days after ACT (D, 4 days after ACT, PBS: n=20; PBS+metformin: n=22; CTX n=20; CTX+metformin: n=19; 14 days after ACT, PBS: n=23; PBS+metformin: n=28; CTX: n=25; CTX+metformin: n=18). (E, F) Immunofluorescence (IF) quantification and representative images of hypoxic CD8 T cells in TiRP tumors treated as in (A), 4 days after ACT (F, PBS: n=12; PBS+metformin: n=12; CTX: n=13; CTX+metformin: n=14). (G) FACS analysis of hypoxic TCRP1A CD8 T cells among alive cells in TiRP tumors treated as in A, 4 days after ACT (G, PBS: n=20; PBS+metformin: n=22; CTX: n=18; CTX+metformin: n=15). (H) IF analysis of the percentage of CD8 T cells (among total CD8 T cells) found at the indicated distance from the closest CD31pos cells in TiRP tumors treated as in (A), 4 days after ACT (H, PBS: n=12; PBS+metformin: n=14; CTX: n=13; CTX+metformin: n=10). (I), (J) FACS analysis of apoptosis in pimonidazole-negative or pimonidazole-positive TCRP1A CD8 T cells in TiRP tumors treated as in (A), 4 days after ACT (I) and 14 days after ACT (J) (I, PBS: n=17; PBS+metformin: n=21; CTX: n=17; CTX+metformin: n=14; J, PBS: n=23; PBS+metformin: n=27; CTX: n=26; CTX+metformin: n=17). All data are mean±SEM. ns, not significant; *p<0.05; **p<0.01; ***p<0.001; ****p<0.0001, calculated by two-way analysis of variance with Tukey’s multiple comparison correction in (A), log-rank (Mantel-Cox) test in (B), two-tailed unpaired t-test in (C–E, G–J).
When analyzing the cellular composition of the TME, we found that CTX, but not metformin, reduced tumor infiltration by PMN-MDSCs (CD11bposLy6Cneg/lowLy6Gpos cells) (online supplemental figure 3A), whose immunosuppressive functions in the TiRP model were extensively characterized,30 and also reduced infiltration by regulatory T (Treg) cells (online supplemental figure 3B), in line with previous reports.33 CTX also induced the expression of C-X-C motif chemokine ligand (CXCL)9 and CXCL10 by CD45-negative cells (online supplemental figure 3C–F), and of homeostatic cytokine interleukin (IL)-7 (online supplemental figure 3G). Metformin-treated and/or CTX-treated tumors showed higher levels of IL-2 transcripts compared with the control group (online supplemental figure 3H).
In line with the mitigation of tumor immunosuppression and the induction of cytokine storm, CTX increased tumor infiltration of CD8 T cells, particularly the adoptively transferred TCRP1A CD8 T cells, shortly after ACT and at later time points (figure 2C,D). Metformin treatment alone also improved tumor infiltration of CD8 T cells and TCRP1A CD8 T cells compared control mice (figure 2C,D). In line with our previous results,30 the persistence of TCRP1A CD8 T cells after ACT was very limited (figure 2D). However, it was improved in mice treated with CTX and metformin, particularly when used in combination (figure 2D). Thus, the reduced tumor growth and improved survival observed in mice receiving ACT together with CTX and/or metformin, correlated with increased infiltration of tumor-specific CD8 T cells.
Given our in vitro observations that metformin improved CD8 T-cell fitness in hypoxia, we analyzed CD8 T-cell localization within the tumor. We observed that metformin alone or in combination with CTX increased CD8 T-cell infiltration in hypoxic tumor areas compared with control groups 4 days after ACT (figure 2E,F). Similar results were found when looking at tumor antigen-specific CD8 T cells, although in this case a significant difference was observed with metformin alone but not with the combination (figure 2G). Fourteen days after ACT, in mice treated with both CTX and metformin, CD8 T-cell infiltration in hypoxic tumor areas was increased compared with mice treated with CTX alone (online supplemental figure 4A) and the percentage of TCRP1A CD8 T cells out of pimonidazole-positive (hypoxic) cells was increased 10-fold compared with control group, although this effect was driven by a small subgroup of mice (online supplemental figure 4B). Accordingly, more CD8 TILs were localized at distance from blood vessels in metformin-treated mice (figure 2H and online supplemental figure 4C), while tumor blood vessel areas were similar among the different treatments (online supplemental figure 4D,E). We also wondered whether metformin was able to improve CD8 T-cell survival in hypoxic tumor areas. Metformin or CTX treatment alone did not significantly reduce the high TIL apoptosis observed in this model, among both pimonidazole-negative (normoxic) or pimonidazole-positive (hypoxic) cells (figure 2I,J). However, the combination of CTX and metformin significantly reduced apoptosis of tumor-infiltrating TCRP1A CD8 T cells among hypoxic cells 4 days after ACT compared with control group (figure 2I) and among both normoxic and hypoxic cells 14 days after ACT (figure 2J). When analyzing tumor-draining lymph nodes, we observed that metformin did not have an effect on the infiltration nor the apoptosis of TCRP1A CD8 T cells, further supporting our data that metformin has a direct effect on TILs infiltrating into hypoxic tumor areas (online supplemental figure 4F,G).
Since metformin was reported to influence T cell memory differentiation, we analyzed the expression of CD62L and KLRG1 in tumor infiltrating TCRP1A CD8 T cells. We observed an increase of CD44pos CD62Lneg KLRG1neg effector memory cells in hypoxic tumor areas in TiRP mice receiving metformin alone or CTX alone compared with control group; however, no difference was observed when comparing the combination of metformin and CTX versus CTX alone (online supplemental figure 4H,I). The frequency of CD44pos CD62Lpos KLRG1neg central memory cells or CD44pos CD62Lneg KLR1pos short-living effector cells in normoxic or hypoxic tumor areas were not significantly affected by the treatments (online supplemental figure 4H,I).
These results show that both metformin and CTX treatment increase CD8 T-cell recruitment to the tumor but metformin, in particular, favors their infiltration into hypoxic tumor areas. The combination of both treatments further improves these effects, leading to increased TIL persistence, infiltration and survival in tumor hypoxic areas at later time points after ACT, thus improving tumor response to immunotherapy.
Metformin does not affect tumor hypoxia in TiRP mice
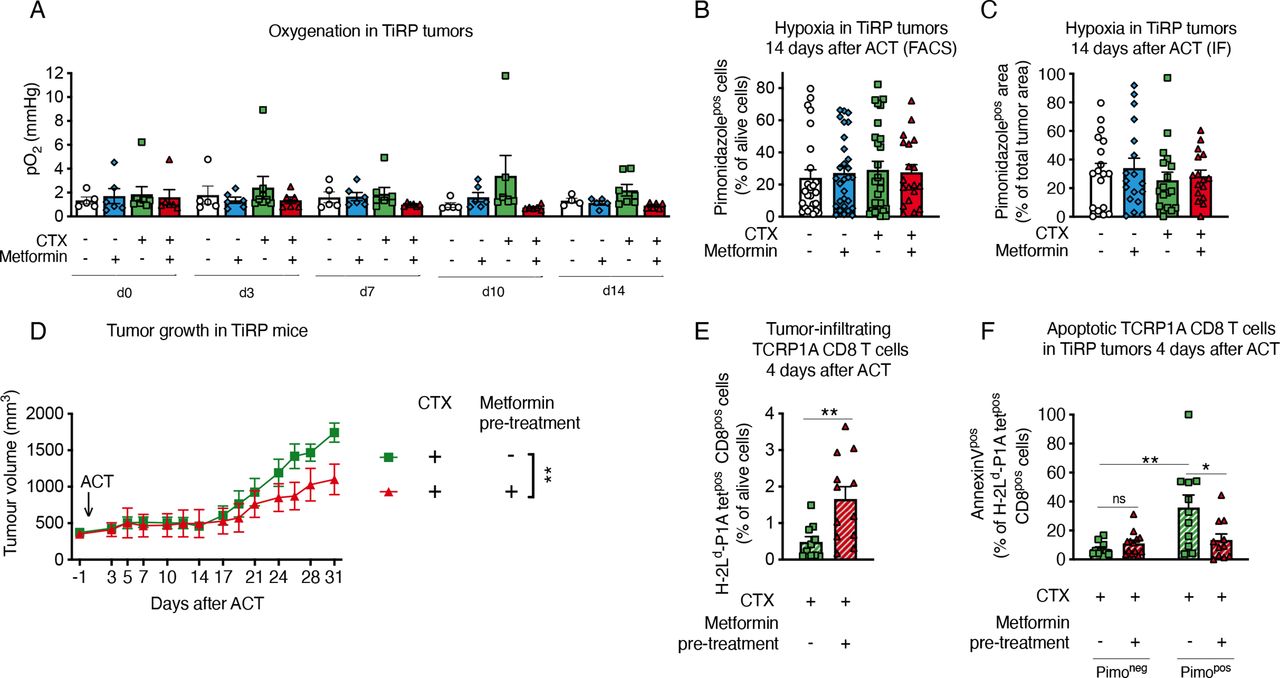
It has been reported that metformin can indirectly improve TIL function by diminishing hypoxia, as a consequence of the reduced oxidative metabolism by tumor cells.16 17 However, when we analyzed TiRP tumor oxygen levels by electron paramagnetic resonance (EPR), we found no increased oxygenation by metformin treatment (figure 3A). Likewise, metformin did not reduce tumor hypoxia as measured with pimonidazole (figure 3B,C and online supplemental figure 5A,B).

Metformin does not affect tumor hypoxia in TiRP mice. (A) Measurements of tumor oxygenation by in vivo electron paramagnetic resonance (EPR) oximetry in TiRP mice that have received a single injection of cyclophosphamide (CTX, 100 mg/kg) or phosphate buffered saline (PBS) when the tumor size was around 260 mm3, followed on day 0 by adoptive cell transfer (ACT) of 10 million activated TCRP1A CD8 T cells 24 hours later and treated or not with metformin (0.5 mg/mL) in drinking water (A, PBS: n=5; PBS+metformin: n=6; CTX: n=8; CTX+metformin: n=6). (B, C) Tumor hypoxia quantification through pimonidazole staining in TiRP mice treated as in figure 2, by fluorescence-activated cell sorting (FACS) (B) or immunofluorescence (IF) (C), 14 days after ACT (B, PBS: n=25; PBS+metformin: n=29; CTX: n=27; CTX+metformin: n=19; C, PBS: n=15; PBS+metformin: n=17; CTX: n=14; CTX+metformin: n=19). (D) Tumor growth in TiRP mice that have received a single injection of CTX (100 mg/kg) followed the day after by ACT of TCRP1A CD8 T cells pretreated or not with metformin in vitro for 3 days before ACT (D, CTX: n=12; CTX+metformin pretreatment: n=11). (E, F) FACS analysis of TCRP1A CD8-T cell tumor infiltration (E) and apoptosis among pimonidazole-negative or pimonidazole-positive cells (F) in TiRP tumors treated as in (D), 4 days after ACT (E, CTX: n=10; CTX+metformin pretreatment: n=12; F, CTX: n=11; CTX+metformin: n=13). All data are mean±SEM. ns, not significant; *p<0.05; **p<0.01, calculated by two-way analysis of variance in (D), two-tailed unpaired t-test in (E, F).
These data suggest that metformin could improve TiRP tumor response to ACT by acting directly on CD8 T cells, which would be consistent with our in vitro data. To confirm this hypothesis, we pretreated activated TCRP1A CD8 T cells with metformin in vitro, before ACT in tumor-bearing mice that received no metformin. We found that pretreated T cells better reduced the growth of TiRP tumors (figure 3D). Moreover, pretreated T cells better infiltrated the tumors (figure 3E) and resisted apoptosis in hypoxic areas (figure 3F).
All these data clearly indicate that metformin directly ameliorates CD8 T-cell survival and function in hypoxia.
Metformin improves tumor response to ACT in different models
We also assessed whether metformin could improve the response of Lewis lung carcinoma cells (LLC) or lymphoma EL4 cells expressing the OVA peptide (LLC-OVA and EG7, respectively), to ACT of OT-1 CD8 T cells. As we observed in the TiRP mice, systemic administration of metformin alone did not significantly affect tumor growth in these models (figure 4A,B); however, metformin enabled tumor response to ACT in LLC-OVA-bearing mice, which were otherwise insensitive to OT-1 T-cell injection (figure 4A). Metformin also reduced tumor growth in the EG7 model after ACT (figure 4B). Again, metformin did not affect pimonidazole staining (online supplemental figure 6A), while it increased the percentage of hypoxic CD8 T cells in LLC-OVA tumors (online supplemental figure 6B,C). Moreover, pretreatment of OT-1 cells in vitro with metformin before ACT induced a small but significant reduction of tumor growth and increased CD8 T-cell infiltration in hypoxic regions of LLC-OVA tumors (figure 4C–E).
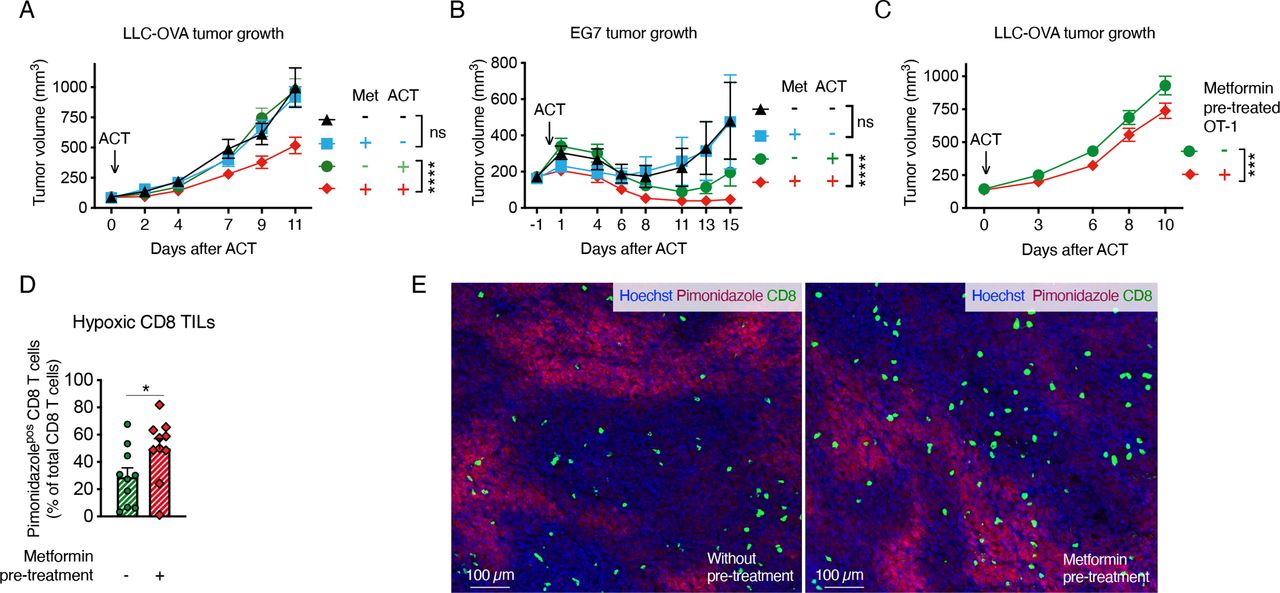
Metformin improves tumor response to adoptive cell transfer (ACT) in different models. A, B Growth curve of Lewis lung carcinoma cells (LLC)-ovalbumin (OVA) (A) or EG7 (B) tumors treated or not with ACT of 2 million activated OT-1 CD8 T cells and metformin at 0.5 mg/mL in drinking water (A, pool of four independent experiments, no ACT: n=19; metformin no ACT: n=13; ACT: n=25; metformin and ACT: n=25; B, pool of two independent experiments, no ACT: n=12; metformin no ACT: n=11; ACT: n=13; metformin and ACT: n=13). (C) Growth curve of LLC-OVA tumors on ACT of 2 million activated OT-1 CD8-T cells, pretreated or not in vitro for 3 days with metformin (2 mM) (C, pool of four independent experiments, not-pretreated OT-1: n=38; metformin-pretreated OT-1: n=36). (D, E) Quantification (D) and representative images (E) of hypoxic CD8 T cells in end-stage LLC-OVA tumors treated as in (C) by immunofluorescence (IF) (D, n=10). All data are mean±SEM. ns, not significant; *p<0.05; ***p<0.001; ****p<0.0001, calculated by two-way analysis of variance in (A–C), two-tailed unpaired t-test in (D).
Metformin prevents hypoxia-induced apoptosis by reducing ROS production
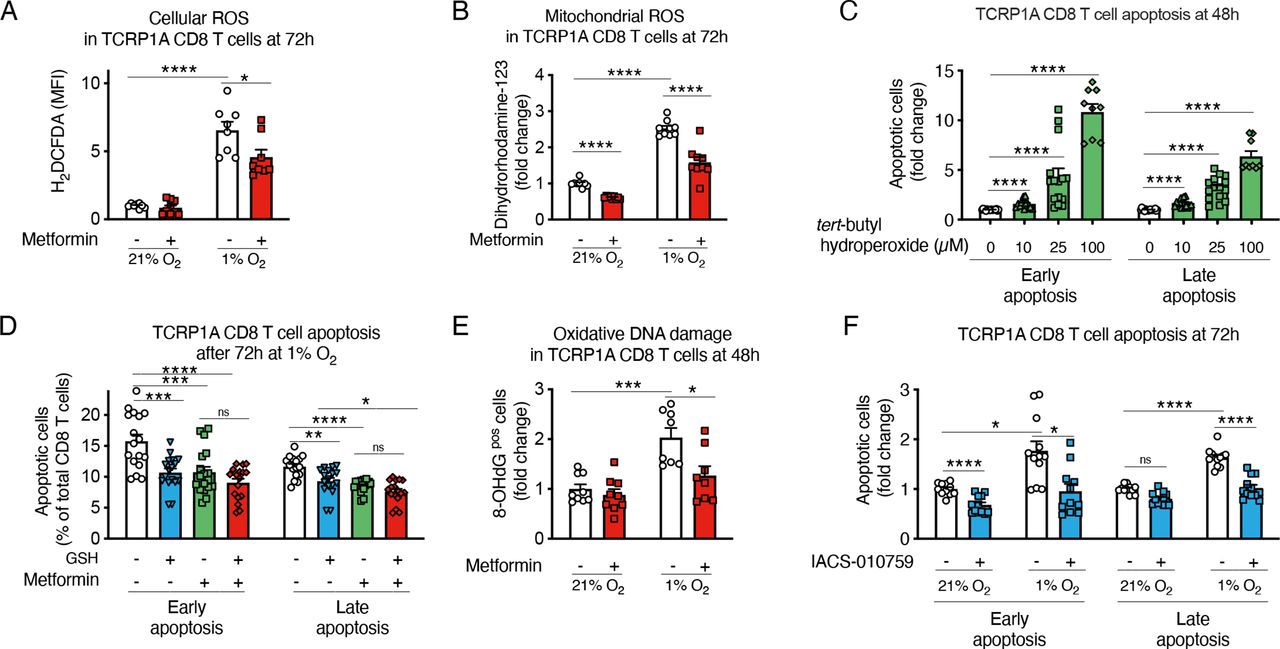
Metformin is a direct inhibitor of the mitochondrial complex I, which is a possible site of production of reactive oxygen species (ROS) together with complex III.35 Due to a suboptimal functioning of the mitochondrial respiratory chain, electron leakage can occur in hypoxia leading to increased ROS production. High ROS production has been associated with T-cell dysfunction in chronic infections and tumors.36–39
We found that metformin reduced ROS accumulation in hypoxic CD8 T cells (figure 5A,B). Moreover, by treating CD8 T cells with different doses of a ROS precursor, tert-butyl hydroperoxide solution (Luperox), we confirmed that oxidative stress decreased CD8 T-cell survival and proliferation (figure 5C and online supplemental figure 7A). Consistently, the antioxidant reduced glutathione (GSH) protected CD8 T cells from hypoxia-induced apoptosis, to a similar extent as metformin (figure 5D). Likewise, N-acetyl-L-cysteine, a cell permeable antioxidant, diminished ROS and reduced apoptosis in normoxic and hypoxic TCRP1A CD8 T cells (online supplemental figure 7B,C). We also observed that hypoxia induced oxidative DNA damage, which was prevented by metformin (figure 5E).

Metformin prevents hypoxia-induced apoptosis by reducing reactive oxygen species (ROS) production. (A, B) Fluorescence-activated cell sorting (FACS) quantification of cellular ROS (A) and mitochondrial ROS (B) in activated TCRP1A CD8 T cells incubated in normoxia (21% O2) or hypoxia (1% O2) in presence or not of metformin (2 mM) at 72 hours; data are expressed as fold change compared with control. (C) FACS quantification of early (Annexin Vpos and 7-aminoactinomycin D (7-AAD)neg) and late apoptosis (Annexin Vpos and 7-AADpos) in activated TCRP1A treated with different doses of tert-butyl hydroperoxide for 48 hours; data are expressed as fold change compared with control. (D) FACS quantification of early (Annexin Vpos and 7-AADneg) and late apoptosis (Annexin Vpos and 7-AADpos) in activated TCRP1A incubated in hypoxia (1% O2) in presence or not of metformin (2 mM) and/or glutathione (GSH) (3.2 mM). (E) Immunofluorescence (IF) quantification of 8-OHdG positive cells among TCRP1A CD8 T cells treated as in A, B for 48 hours by IF; data are expressed as fold change compared with normoxia vehicle. (F) FACS quantification of early (Annexin Vpos and 7-AADneg) and late apoptosis (Annexin Vpos and 7-AADpos) in activated TCRP1A incubated in normoxia (21% O2) or hypoxia (1% O2) in presence or not of IACS-010759 (100 nM); data are expressed as fold change compared with normoxic control. (A, B, E) is a pool of three independent experiments; (C) is a pool of five independent experiments (100 µM dose was assessed in three independent experiments); (D) is a pool of six independent experiments; (F) is a pool of four independent experiments. All the conditions are assessed in triplicate in each individual experiment. MFI, median fluorescence intensity. All data are mean±SEM. ns, not significant; *p<0.05; **p<0.01; ***p<0.001; ****p<0.0001, calculated by two-tailed unpaired t-test.
Overall, our data demonstrate that, by reducing ROS accumulation in hypoxia, metformin prevents mitochondrial dysfunction and oxidative DNA damage and thereby directly improves CD8 T-cell survival and function.
To confirm that the prosurvival effect of metformin in hypoxic CD8 T cells is dependent on the inhibition of the mitochondrial complex I, we treated CD8 T cells with IACS-010759, a selective and potent inhibitor of the mitochondrial complex I and again we observed a reduction of CD8 T-cell apoptosis in hypoxia and improved proliferation (figure 5F and online supplemental figure 7D); ROS induction in hypoxia was also prevented (online supplemental figure 7E,F). As already reported,18 metformin induced phosphorylation of AMPK and its downstream target acetyl-CoA carboxylase (online supplemental figure 7G). To understand the role AMPK activation, we deleted the AMPK alpha 1 catalytic subunit in activated TCRP1A CD8 T cells (online supplemental figure 7G) and cultured them in hypoxia in presence or absence of metformin; as expected, incubation in hypoxia stabilized HIF-1α, which was further increased in cells KO for AMPK alpha 1 (online supplemental figure 7G), as already described.40–42 We observed that metformin maintained an effect on CD8 T-cell apoptosis, at least partially, and on CD8 T-cell proliferation and ROS accumulation (online supplemental figure 7H–K), indicating that AMPK activation is dispensable for the phenotypes described.
Metformin improves tumor response to anti-PD-1 treatment
Currently, immune checkpoint inhibitors have a wider clinical application compared with adoptive cell therapy for cancer treatment. Therefore, we assessed the efficacy of metformin in combination with a blocking antibody against PD-1. In the B16F1 melanoma model, which is refractory to anti-PD-1, metformin enabled response to PD-1 blockade of tumors pretreated with CTX, while no effect was observed with metformin treatment alone (figure 6A and online supplemental figure 8A,B). The reduction of tumor growth after metformin and PD-1 therapy did not affect CD8 T-cell infiltration but, interestingly, correlated with higher survival of CD8 T cells in hypoxic tumor areas (online supplemental figure 8C,D). In the MC38 colorectal cancer model, which is more sensitive to anti-PD-1 therapy, the combination with metformin enhanced tumor regression compared with anti-PD-1 treatment alone, leading to tumor disappearance in 8 out of 11 mice, compared with 1 out of 9 and 4 out of 9 tumor rejection achieved by metformin or anti-PD-1 treatment alone, respectively (figure 6B,C). Moreover, mice treated with metformin in combination with PD-1 blockade were completely protected from MC38 tumor rechallenge, indicating long-term antitumor immunity (online supplemental figure 8E).
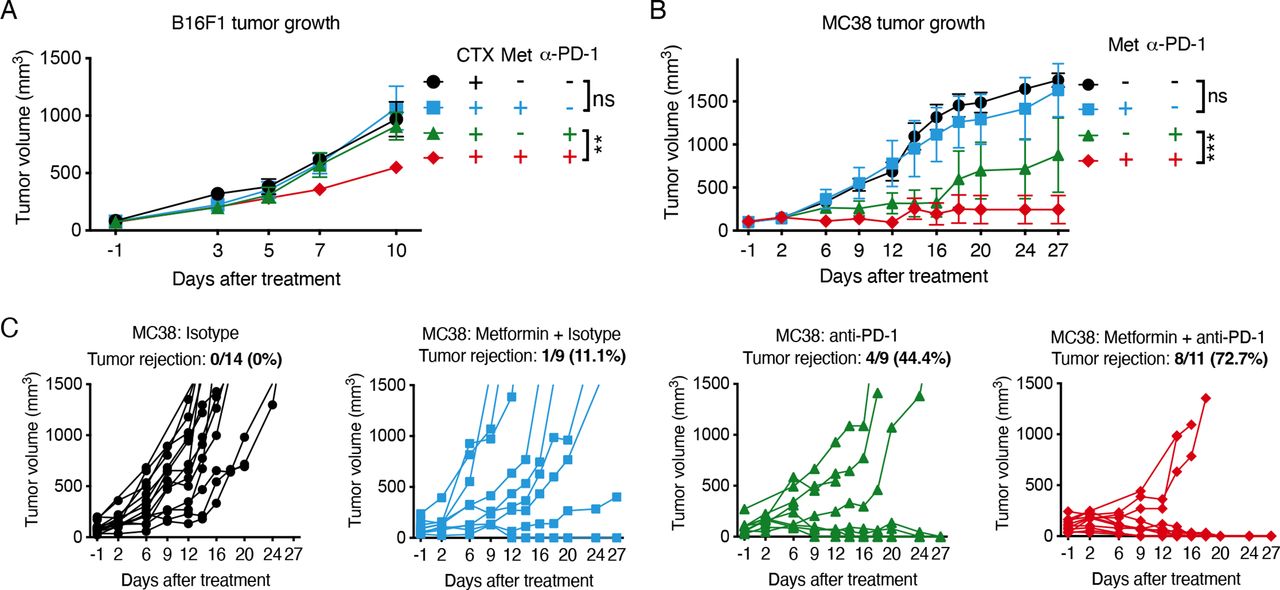
Metformin improves tumor response to anti-programmed cell death protein 1 (anti-PD-1) treatment. (A) Growth curves of B16F1 tumors treated once with 100 mg/kg cyclophosphamide (CTX) (day −1) 1 week after tumor cell injection, followed by metformin (0.5 mg/mL) administration in drinking water in combination with intraperitoneal injection of anti-PD-1 antibody (100 µg/mouse) or isotype every 3 days starting from day 0 (A, pool of two independent experiments: CTX+isotype: n=7; CTX+metformin+isotype: n=9; CTX+anti-PD-1: n=10; CTX+metformin+anti-PD-1: n=11). (B, C) Combined (B) and single (C) growth curves of MC38 tumors treated or not with metformin (0.5 mg/mL) in drinking water, in combination with intraperitoneal injection of anti-PD-1 antibody (200 µg/mouse) or isotype every 3 days starting from day 0 (B, pool of three independent experiments: isotype: n=11; metformin+isotype: n=9; anti-PD-1: n=9; metformin+anti-PD-1: n=11). Data in A, B are mean±SEM. ns, not significant; **p<0.01; ***p<0.001, calculated by two-way analysis of variance.
These data demonstrate that metformin improves tumor response to different types of immunotherapies.
Metformin reduces hypoxia-dependent apoptosis in human CD8 T cells
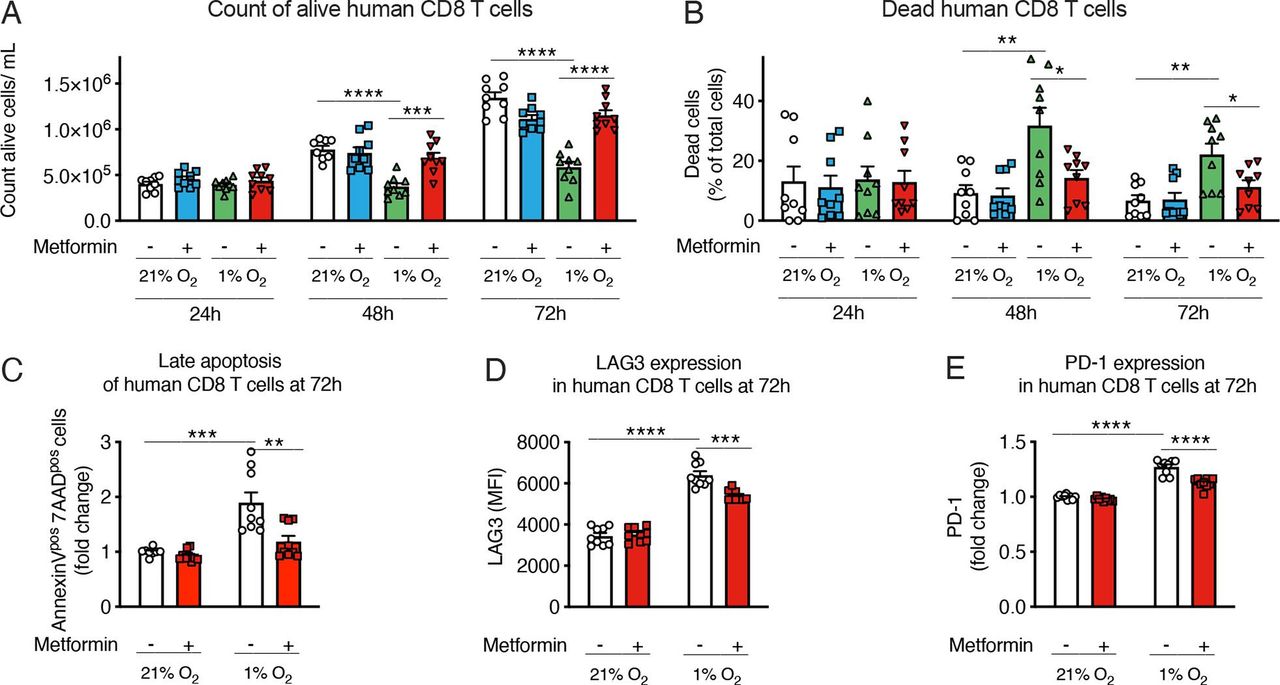
Finally, to assess the translational impact of our findings, we checked the effects of hypoxia and metformin on human CD8 T cells. As shown in figure 7A–C, hypoxia reduced the growth of polyclonal CD8 T cells isolated from peripheral blood lymphocytes, and induced their death; interestingly, metformin rescued cell expansion and blunted hypoxia-induced apoptosis in human CD8 T cells cultured in hypoxic conditions (figure 7A–C and online supplemental figure 9A); a small reduction of hypoxia-induced ROS was also observed (online supplemental figure 9B). Furthermore, hypoxia increased the expression of immune checkpoint markers PD-1 and LAG-3, and this induction was reduced by metformin (figure 7D,E). Consistently with the effect of metformin on the effector functions of murine CD8 T cells exposed to hypoxia, metformin tended to increase expression of IFN-γ and TNF-α in human CD8 T cells from two out of three donors (online supplemental figure 9C,D). Altogether, this suggests that our observations in preclinical models might hold true in patients with cancer.
Metformin reduces hypoxia-dependent apoptosis in human CD8 T cells. (A, B) Viable cell count (A) and percentage of dead cells (B) of human CD8 T cells activated with anti-CD3/CD28 beads and feeder cells and incubated in normoxia (21% O2) or hypoxia (1% O2) and treated or not with metformin (2 mM). (C) Quantification of late apoptosis measured by fluorescence-activated cell sorting (FACS) staining for Annexin V and 7-aminoactinomycin D (7-AAD) in human CD8 T cells treated as in (A, B). (D, E) Lymphocyte-activation gene 3 (LAG3) (D) and programmed cell death protein 1 (PD-1) (E) expression measured by FACS in cells treated as in (A, B). Results are expressed as fold change compared with control. (A–E) is a pool of three independent experiments. All conditions are assessed in triplicate in each individual experiment. All data are mean±SEM. *p<0.05; **p<0.01; ***p<0.001; ****p<0.0001, calculated by two-tailed unpaired t-test. MFI, median fluorescence intensity.
Discussion
Our results indicate that metformin has a direct impact on CD8 T cells, increasing their fitness in hypoxic conditions, rescuing them from hypoxia-induced apoptosis, restoring their proliferation and functionality and blunting their expression of inhibitory receptors. These effects are maintained also in vivo, leading to higher CD8 T-cell infiltration and survival in hypoxic tumor areas and better response to immunotherapy. Mechanistically, these effects seem to stem from the inhibition of mitochondrial complex I, resulting in reduced ROS production. This represents a novel immune-mediated antitumoral mechanism of metformin and supports its use in combination with immunotherapy.
By creating an immunosuppressive microenvironment, hypoxia limits the efficacy of immunotherapies,43 which can be improved with strategies that increase tumor oxygenation and induce vessel normalization.11 16 43 Unfortunately, mitigation of tumor hypoxia in the clinic is still challenging in terms of efficacy, specificity and toxicity, and the results achieved so far are limited to certain time windows or tumor types.2 3 43 Therefore, improving CD8 T-cell fitness in hypoxia represents a promising strategy to achieve a good response to immunotherapy also in tumors that are highly hypoxic or in which oxygenation cannot be increased.
Metformin has been shown to improve different types of immunotherapies through direct or indirect effects on CD8 T cells.16–21 Our data are partially in line with the CD8-dependent antitumor effects of metformin described by Eikawa et al.18 By using highly immunogenic models, the authors found that metformin administration in vivo reduced tumor growth, decreased TIL apoptosis and increased their multifunctionality in an AMPK-dependent way.18 Here, we found that metformin increased CD8 T-cell survival, proliferation and polyfunctionality in hypoxia, but these effects appeared independent from AMPK. The combination of metformin with ACT or anti-PD-1 therapy (and with CTX pretreatment in some models) reduced tumor growth in highly hypoxic and immunosuppressive models, which are otherwise resistant to immunotherapies, including the autochthonous TiRP melanoma model. Autochthonous tumors differ from transplanted tumors in terms of cancer initiation, growth, architecture, tumor stroma and immunogenicity, and their slower development enables host-tumor interactions that better recapitulate those of human cancers.32 In particular, TiRP tumors share anti-PD-1 resistance mechanisms and poor tumor-antigen immunogenicity with human cancers,30 44 making them suitable and clinically relevant to study immunological responses.
Metformin has been reported to modulate CD8 T-cell memory/effector differentiation in several studies.18–20 28 Eikawa et al showed that metformin induces an expansion of CD44pos CD62Lneg KLRG1neg effector memory cells and CD44pos CD62Lneg KLRG1pos effector cells accompanied by a reduction of CD44pos CD62Lpos KLRG1neg central memory cells in highly immunogenic tumors, by differentially regulating apoptosis in these populations.18 In other studies, metformin was reported to induce the formation of memory-like antigen-inexperienced CD44pos CD62Lpos CXCR3pos cells, in association with metabolic changes, conferring protection against Mycobacterium tuberculosis in BCG-vaccinated mice and guinea pigs28; similarly, the AMPK-dependent metabolism reprogramming induced by metformin promoted CD8 T-cell memory formation after immunization, conferring protective immunity after infection and tumor challenge.19 Also, the combination of metformin with vaccine immunotherapy increased the frequency of CD44pos CD62Lpos central memory cells among tumor infiltrating CD8 T cells and decreased that of CD44pos CD62Lneg cells compared with vaccine alone.20 In our model, we saw no differences in the proportion of CD44pos CD62Lpos KLRG1neg central memory cells or CD44pos CD62Lneg KLRG1pos effector cells, in normoxic or in hypoxic tumor areas in TiRP mice treated with metformin and/or CTX. An increase of CD44pos CD62Lneg KLRG1neg effector memory cells on metformin or CTX treatment alone was observed in hypoxic tumor areas, but not when comparing the combination of metformin and CTX versus CTX alone. Thus, our data are only partially in line with the work of Eikawa et al as we could not observe modulations of central memory cells (CD62Lpos KLRG1neg) or effector population (CD62LnegKLRG1pos cells) by metformin treatment.
Several publications have shown that metformin reduces the expression of PD-L1 on cancer cells, through AMPK, thus improving cancer cell killing and increasing CD8 T-cell functionality and tumor response to CTLA-4 or cancer vaccine.20 21 25 When PD-L1 downregulation or AMPK activation in tumor cells was abolished, the antitumoral effect of metformin was strongly reduced but not completely blunted, indicating that other mechanisms contribute to the increased functionality of CD8 T cells by metformin.21 Our findings are in line with those publications in supporting the combination of metformin with immunotherapies, but what we described here is a direct effect of metformin on CD8 T cells that leads to the improvement of their fitness in hypoxia.
Metformin was shown to reduce oxygen consumption rate (OCR) in certain cancer cell lines and tumor xenografts,16 17 27 45 and this can increase oxygen availability and reduce hypoxia. Mitigation of tumor hypoxia achieved by mitochondrial complex I targeting through metformin or genetic silencing/deletion in mouse cancer cells, has been associated with improved response to PD-1.16 46 The metformin effect we describe here is different, as we did not observe a reduction of tumor hypoxia by metformin in TiRP or LLC tumors. Rather, metformin acts directly on CD8 T cells to increase their fitness in hypoxia. This is supported by our in vitro data, and by our preconditioning experiments, in which pretreatment of CD8 T cells with metformin before ACT was sufficient to improve CD8 T-cell infiltration and survival in hypoxic tumor regions and tumor response to immunotherapy. The lack of reduction of tumor hypoxia in our models could be due to several factors, including tumor size at the start of the treatment, different dosages or administration routes of metformin and tumor-intrinsic properties. Cell response to metformin can be affected by microenvironmental cues, basal metabolism or the expression of receptors responsible for metformin cellular uptake and extrusion, such as the organic cation transporter 1–3 and the multidrug and toxin extrusion MATE 1–2 proteins.45 47 This results in different sensitivity and kinetics of OCR reduction on metformin treatment among different cell lines and tumor xenografts.27
We showed that CD8 T cells incubated in hypoxia have increased levels of ROS, which can be responsible for apoptosis induction. Complex I inhibition, through metformin or IACS-010759, protects CD8 T cells from ROS production and oxidative DNA damage. ROS can affect nuclear DNA and mitochondrial DNA, which is more susceptible to oxidative damage than nuclear DNA,48 therefore compromising mitochondria and cell viability. Interestingly, ROS accumulation, together with deregulation of mitochondrial homeostasis and structure, has been observed in exhausted CD8 T cells from chronic viral infections or tumors.36–39 Thus metformin, by reducing ROS, could prevent oxidative damage and the induction of exhaustion in hypoxia.
In accordance with that and with our data, Scharping et al showed that ROS, induced either by continuous stimulation of T cells in hypoxia or by the complex III inhibitor antimycin A, are associated with an exhaustion-like phenotype.39 Low, non-toxic doses of the mitochondrial complex I inhibitor rotenone could prevent ROS accumulation, reduce co-inhibitor molecule expression and increase cytokine production in antimycin A-treated cells; however, rotenone alone reduced T-cell proliferation and could not restore cell expansion.39 It is important to note that, even if they both inhibit mitochondrial complex I, rotenone and metformin differ in their properties, binding sites and downstream effects.45 Rotenone has a stronger and irreversible inhibitory effect on mitochondrial complex I and can increase ROS45; moreover, rotenone easily crosses the cell membrane and the blood-brain barrier and accumulates inside cells and thus is highly toxic.45 On the contrary, metformin is widely used in the clinic.
Metformin could have a more broad and potent effect than a ROS scavenger. Oxidative phosphorylation can be active at very low oxygen tension49 and consumes about 70%–90% of the intracellular O2.50 Therefore, a small inhibition of mitochondrial complex I could increase the amount of intracellular O2, which is required for oxygen-dependent non-mitochondrial processes, such as the oxidative protein folding or the activity of oxidases, histone demethylases and hydroxylases,50 and could be limiting in hypoxic conditions. Moreover, metformin has a complex mechanism of action that affects several pathways involved in cell metabolism, protein synthesis, cell growth and autophagy, such as mammalian target of rapamycin (mTOR), nuclear factor (NF)-κB, HIF, Akt and AMPK.14 It was shown that metformin activates the NF-E2-related factor 2 (Nrf2) pathway, thereby activating mTOR complex 1 (mTORC1), which in turn activates Nrf2 in a feedback loop that synergizes with anti-PD-1 treatment in inducing TIL proliferation, IFN-γ production and tumor growth inhibition in mice.51 These effects were dependent on tumor cell metabolism and were lost when IFN-γR signaling was defective in cancer cells.51 AMPK is a key energy cell sensor and can regulate mitochondrial biogenesis, homeostasis and mitophagy.52 We and others have reported AMPK phosphorylation and activation in CD8 T cells on metformin treatment,18 although the effects of metformin on CD8 T-cell apoptosis in hypoxia are only partially lost in absence of the AMPK alpha 1 catalytic subunit, while the effects on proliferation are maintained.
Metformin improved tumor response to ACT of OT-1 CD8 T cells in lung carcinoma LLC-OVA and in lymphoma EG7 models, and to anti-PD-1 therapy in MC38 colon carcinoma. The TiRP and the B16F1 melanomas are very immunosuppressive and immunotherapy-resistant models, with high infiltration of MDSCs and Treg.30 53–55 In these two models, CTX was required to unleash tumor response to ACT of TCRP1A cells or to anti-PD-1, and it synergized with metformin. CTX is an alkylating agent approved by the FDA in 1959 as an anticancer drug still widely used for hematological and solid malignancies.33 Nowadays, CTX is also used alone or in combination with fluradabine as preconditioning regimen before ACT to improve the engraftment of the infused T cells and patient response to immunotherapy.56 57 Several preclinical and early phases clinical studies have shown that CTX eliminates Treg, induces cytokine and chemokine production, reduces competition for homeostatic and activating cytokines by removing cytokine-consuming cells, reshapes the TME inducing a M2-like to M1-like macrophage shift and can also induce immunogenic cell death.33 56 In this work, we confirmed the importance of CTX preconditioning to favor tumor response to immunotherapy in highly immunosuppressive models. In particular, next to a direct effect on tumor cells, we showed induction of cytokines and reduction of Treg and, importantly, of PMN-MDSC (CD11b+LyGhiLy6Clow). This myeloid cell population was shown to strongly contribute to the immunosuppressive TME of TiRP tumors, leading to Fas-ligand-mediated apoptosis of tumor antigen-specific CD8 T cells and their disappearance from the tumors at early time points after ACT.30 This effect of CTX on MDSC is consistent with the works of Malvicini et al and Medina-Echeverz et al, although higher doses of CTX have been shown to induce, at later time points, a myeloid population with suppressor activity.58–60
To conclude, on one hand CTX would favor the engraftment of adoptively transferred CD8 T cells and alleviate immunosuppressive cues; on the other hand, metformin would specifically increase CD8 T-cell survival and functionality in hypoxia. Therefore, the combination of CTX and metformin represents a rational add-on treatment for immune-targeted strategies to counter solid malignancies, which are often hypoxic. Importantly, as mentioned above, both metformin and CTX are registered drugs already involved in numerous clinical trials and applications for several diseases, with a safe profile. Moreover, we found that metformin prevents hypoxia-induced apoptosis and growth inhibition, and reduced ROS accumulation and PD-1 and LAG3 levels also in human CD8 T cells. All these reasons depict the high translational relevance of our findings, suggesting a feasible and promising strategy to achieve a good immunotherapy outcome in highly immunosuppressive and hypoxic tumors.
Data availability statement
Data are available on reasonable request. All data relevant to the study are included in the article or uploaded as supplementary information.
Ethics statements
Patient consent for publication
Ethics approval
Animal experimental procedures were approved by the Animal Ethical Committee of the UCLouvain (2015/UCL/MD/015; 2019/UCL/MD/018) and mice were euthanized if a humane end point was reached; the isolation of human blood cells was approved by the Comité d’Ethique Hospitalo-Facultaire Saint-Luc–UCLouvain.
Acknowledgments
We thank Pedro Gomez and the Platform Laboratory Animal Facility for mouse colony production, Nicolas Dauguet for FACS sorting and scientific advices on FACS analysis, Luc Pilotte for technical support, the group of Pierre van der Bruggen for scientific advices on experiments with human CD8 T cells, Nicolas van Baren for scientific advices on immunofluorescent staining and analysis, Guido Bommer for scientific discussion, Isabelle Grisse for editorial assistance.
References
Footnotes
VF and TD contributed equally.
Contributors VF conception, design and supervision, development of methodology, data acquisition, data analysis and interpretation, funding acquisition, writing. TD development of methodology, data acquisition, data analysis and interpretation. MF development of methodology and data acquisition. PVM development of methodology, data acquisition, data analysis for CD8-CD31 distances. LM and BG development of methodology, data acquisition, data analysis for EPR measurements. BJVdE conception, supervision, funding acquisition, writing. Guarantors: VF and BJVdE.
Funding This work was supported by Foundation against cancer (FCC, 2014-137), Walloon Excellence in Life Sciences (WELBIO CR-2015A-07), WALinnov grant from the Walloon region (IMMUCAN, 1610119), Fonds National de la Recherche Scientifique (FRS-FNRS, EOS O000518F). VF was supported by FNRS-Télévie (7. 4501.15F), FRS-FNRS- chargé de recherches (FC-7929), Foundation against cancer Fundamental Mandate (FFC, 2019-092). TD was supported by FNRS-Télévie (7.4597.18).
Competing interests None declared.
Provenance and peer review Not commissioned; externally peer reviewed.
Supplemental material This content has been supplied by the author(s). It has not been vetted by BMJ Publishing Group Limited (BMJ) and may not have been peer-reviewed. Any opinions or recommendations discussed are solely those of the author(s) and are not endorsed by BMJ. BMJ disclaims all liability and responsibility arising from any reliance placed on the content. Where the content includes any translated material, BMJ does not warrant the accuracy and reliability of the translations (including but not limited to local regulations, clinical guidelines, terminology, drug names and drug dosages), and is not responsible for any error and/or omissions arising from translation and adaptation or otherwise.