Article Text

Abstract
Background Because of the shortage of ideal cell surface antigens, the development of T-cell receptor (TCR)-engineered T cells (TCR-T) that target intracellular antigens such as NY-ESO-1 is a promising approach for treating patients with solid tumors. However, endogenous TCRs in vector-transduced T cells have been suggested to impair cell-surface expression of transduced TCR while generating mispaired TCRs that can become self-reactive.
Methods We conducted a first-in-human phase I clinical trial with the TCR-transduced T-cell product (TBI-1301) in patients with NY-ESO-1-expressing solid tumors. In manufacturing TCR-T cells, we used a novel affinity-enhanced NY-ESO-1-specific TCR that was transduced by a retroviral vector that enables siRNA (small interfering RNA)-mediated silencing of endogenous TCR. The patients were divided into two cohorts. Cohort 1 was given a dose of 5×10⁸ cells (whole cells including TCR-T cells) preconditioned with 1500 mg/m2 cyclophosphamide. Cohort 2 was given 5× 10⁹ cells preconditioned with 1500 mg/m2 cyclophosphamide.
Results In vitro study showed that both the CD8+ and CD4+ T fractions of TCR-T cells exhibited cytotoxic effects against NY-ESO-1-expressing tumor cells. Three patients and six patients were allocated to cohort 1 and cohort 2, respectively. Three of the six patients who received 5×10⁹ cells showed tumor response, while three patients developed early-onset cytokine release syndrome (CRS). One of the patients developed a grade 3 lung injury associated with the infiltration of the TCR-T cells. No siRNA-related adverse events other than CRS were observed. Cytokines including interleukin 6 I and monocyte chemotactic protein-1/chemokine (C-C motif) ligand (CCL2)
increased in the sera of patients with CRS. In vitro analysis showed these cytokines were not secreted from the T cells infused. A significant fraction of the manufactured T cells in patients with CRS was found to express either CD244, CD39, or both at high levels.
Conclusions The trial showed that endogenous TCR-silenced and affinity-enhanced NY-ESO-1 TCR-T cells were safely administered except for grade 3 lung injury. The TCR-T cell infusion exhibited significant tumor response and early-onset CRS in patients with tumors that express NY-ESO-1 at high levels. The differentiation properties of the manufactured T cells may be prognostic for TCR-T-related CRS.
Trial registration number NCT02366546.
- cell engineering
- clinical trials as topic
- cytokines
- immunotherapy, adoptive
Data availability statement
Data are available on reasonable request.
This is an open access article distributed in accordance with the Creative Commons Attribution Non Commercial (CC BY-NC 4.0) license, which permits others to distribute, remix, adapt, build upon this work non-commercially, and license their derivative works on different terms, provided the original work is properly cited, appropriate credit is given, any changes made indicated, and the use is non-commercial. See http://creativecommons.org/licenses/by-nc/4.0/.
Statistics from Altmetric.com
WHAT IS ALREADY KNOWN ON THIS TOPIC
Endogenous T-cell receptors (TCRs) in TCR-engineered T (TCR-T) cells are known to impair expression of the transferred TCRs and generate self-reactive mispaired TCRs.
WHAT THIS STUDY ADDS
NY-ESO-1-specific T cells were transduced by a retroviral vector that silences endogenous TCRs. The NY-ESO-1-specific TCR-T cell infusion exhibited tumor response and early-onset cytokine release syndrome (CRS), and interleukin 6 and monocyte chemotactic protein-1/CCL2 increased in patients with CRS. The manufactured T cells in patients with CRS expressed CD244 and CD39.
HOW THIS STUDY MIGHT AFFECT RESEARCH, PRACTICE, OR POLICY
The differentiation properties of the T cells may influence the development of CRS.
Background
Adoptive cell therapy (ACT) with genetically engineered T cells directed against tumor antigens, such as chimeric antigen receptor–engineered T cells (CAR-T) that target the B cell surface antigen CD19 (CD19-CAR-T), is an approach that has demonstrated clinical benefits.1 2 Although CD19-CAR-T has been developed successfully for treating B cell malignancy, the development of CAR-T for solid tumors is challenging because of the small number of cell surface cancer antigens that can be targeted safely. Many tumor antigens, including neoantigens and shared antigens, are derived from intracellular proteins. Thus, the development of T-cell receptor (TCR)-engineered T cells (TCR-T) that target intracellular antigens may be more suitable for patients with solid tumors.
Cancer-testis antigens are shared antigens that are normally expressed intracellularly. NY-ESO-1 is one such cancer-testis antigen that is not expressed in normal tissues.3 4
We have been developing a novel type of affinity-enhanced TCR to target the NY-ESO-1 antigen efficiently. Our TCR recognizes the NY-ESO-1157-165 peptide with the restriction of in HLA-A*02:01 and HLA-A*0206.5 Our NY-ESO-1-specific TCR, mutated TCR of G50A+A51E, is different from the one reported by Robbins et al.6–8 The G50A+A51E TCR amino acid sequence was subjected to G50→A and A51→E substitutions within the complementarity determining region (CDR) 2 to increase its affinity for NY-ESO-1.5
There are potential drawbacks to TCR-T cell therapy, such as limited expression of transduced tumor-reactive TCR because of competition by CD3 molecules between endogenous and transduced TCRs9 10 and potential self-reactivity derived from mispairing of the introduced TCR α/β chains with endogenous TCR chains.11 To address these issues, technologies to suppress the expression of endogenous TCR have been investigated.12–14 We established a retroviral vector system that expresses small interfering RNAs (siRNAs) specific for endogenous TCR genes to enhance the expression of transduced tumor-specific TCR while minimizing potential TCR mispairing.14–16
We have conducted a first-in-human trial of ACT using TCR-T transduced with a retroviral vector that specifically silences endogenous TCR and enforces the expression of affinity-enhanced NY-ESO-1-specific TCR (TBI-1301) in patients with various refractory solid tumors. The aim of the trial was to address both treatment efficacy and the incidence of adverse events. We found that tumor regression and early-onset cytokine release syndrome (CRS) frequently occurred after TBI-1301 infusion. We analyzed serum cytokine profiles and the differentiation status of manufactured T cells to determine potential correlations with CRS.
Methods
Retroviral vector and TCR-T cell preparation
Peripheral blood mononuclear cells (PBMCs) were isolated from healthy volunteers. Proliferating lymphocytes were infected with the siTCR retroviral vector (MS3-NY-ESO-1-siTCR). After 10–12 days in culture, the T cells were harvested (online supplemental method). The vector includes DNA encoding TCR-α and TCR-β chains specific for NY-ESO-1157-165 and HLA-A*02:01 (MS3-NY-ESO-1-siTCR) (figure 1A); Gly 50 and Ala 51 in the CDR2 region of the TCR-β chain were replaced with Ala and Glu, respectively, resulting in a reduction in Kd from 21.4 µM for the wild type to 1.9 µM.5 The retroviral vector also contains interfering RNA constructs that specifically downregulate endogenous TCR (figure 1A).14 The coding sequences of the TCR-α and TCR-β transgenes are codon optimized and also resistant to siRNA against endogenous TCR.14
Supplemental material
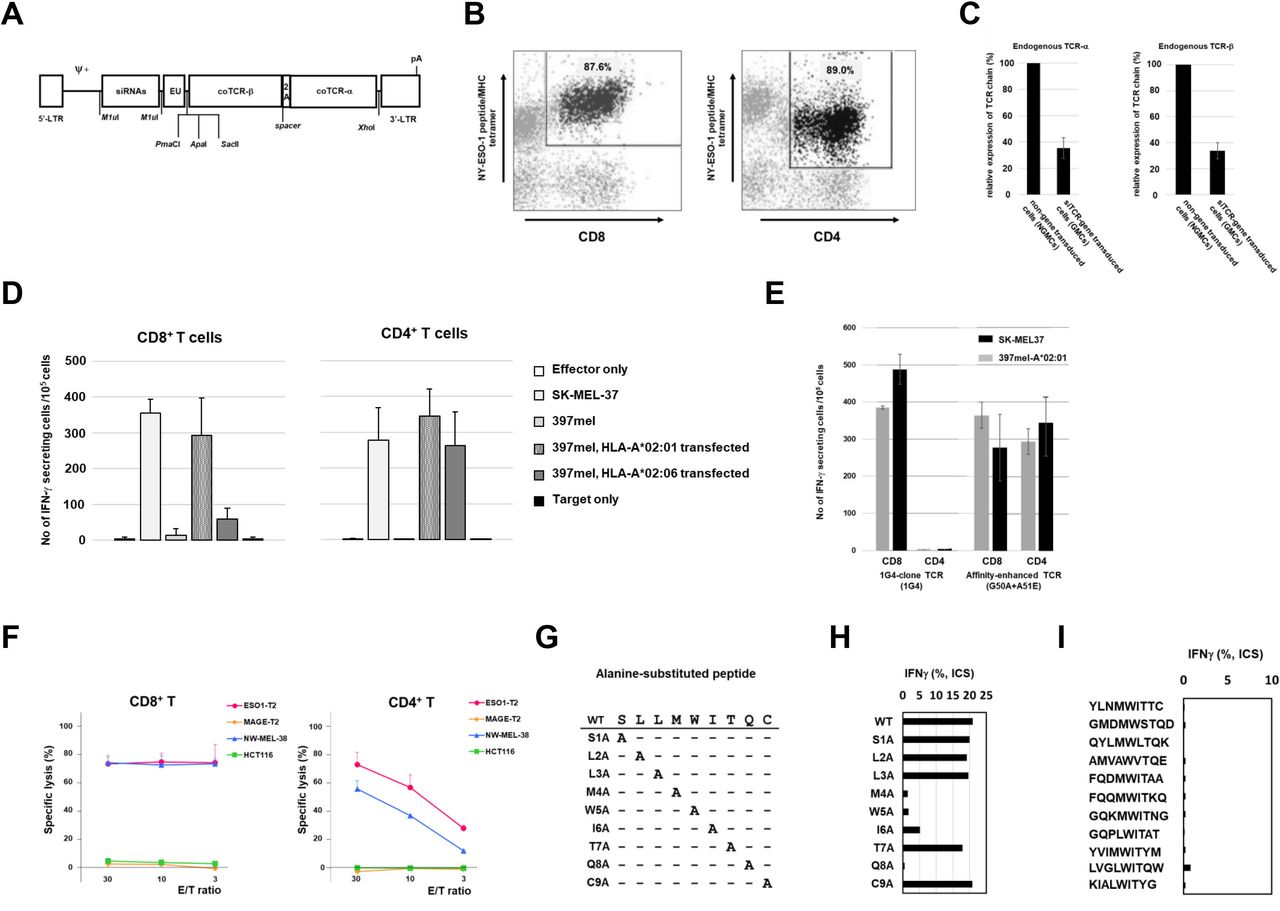
Preclinical study of G50A+A51E T cell receptor (TCR)-transduced T cells. (A) Construct of retroviral vector, pMS3-NY-ESO-1-siTCR. siRNAs, siRNA sequences for endogenous TCR-α and TCR-β; EU, untranslated region 5 of human EF1a; coTCRβ, codon-optimized TCR-β gene sequences for NY-ESO-1; 2A, 2A peptide; coTCRα, codon-optimized TCR-α gene sequences for NY-ESO-1; pA, polyA signal addition; Ψ+, packaging signal; 5'-LTR and R region of 3'-LTR are Moloney murine sarcoma virus-derived, U3 region of 3’-LTR is PCC4-cell-passaged myeloproliferative sarcoma virus-derived. The coTCRα and coTCRβ are formed by codon optimization and are not affected by small interfering RNAs (siRNAs). (B) Transduction of TCR gene to CD8+ T cells and CD4+ T cells. Using the vector of pMS3-NY-ESO-1-siTCR, the TCR gene was transduced to peripheral blood of a healthy volunteer and cultured for 10 days. CD8+ or CD4+ T cells were stained with the NY-ESO-1 peptidemajor histocompatibity complex (MHC) tetramer. 87.6% of CD8+ T cells and 89.0% of CD4+ T cells were positive for the tetramer. (C) Suppression of endogenous TCR-α and TCR-β chain expression by siTCR. RNAs were extracted from 5×10⁶ cells of TCR-gene modified T cells (GMCs) and the T cells that were not gene-transduced (NGMCs). Reverse transcription PCR for endogenous TCR-α and TCR-β chains was performed. 35.3% (±7.9%) and 33.8% (±6.2%) reductions in TCR-α and TCR-β chain expression, respectively. Three experiments using T cells from healthy volunteers were performed in each TCR chain. (D) Interferon gamma (IFN-γ) ELISPOT assay of the NY-ESO-1-TCR-gene transduced CD8+ and CD4+ T cells from healthy volunteers. After TCR-gene transduction and 10-day culture, CD8+ T cells and CD4+ T cells were separated using microbeads. SK-MEL37 is a NY-ESO-1(+) and HLA-A*02:01(+) melanoma cell line. 397mel is a NY-ESO-1(+) and HLA-A*02:01(−) melanoma cell line. HLA-A*02:01-gene or HLA-A*02:06-gene transduced 397mel cells were used as target cells. (E) IFN-γ ELISPOT assay of NY-ESO-1-TCR (G50A+A51E)-gene transduced T cells targeting tumor cells. 1G4-clone is a wild-type (WT) TCR whose affinity is not modified, and G50A+A51E is the affinity-enhanced TCR that was used in the clinical trial. SK-MEL37 cells, 397mel cells, and HLA-A*02:01-transfected 397mel cells were used as target cells. (F) Cytotoxicity assay of G50A+A51E TCR-gene transduced CD8+ and CD4+ T cells. Cytotoxicity was determined by 51Cr-release assay. T cells were transduced with the NY-ESO-1-TCR(G50A+A51E) transgene, and CD8+ and CD4+ T cells were enriched after sorting with NY-ESO-1/HLA-A*02:01-tetramer. As target cells, T2 cells pulsed with NY-ESO-1 peptide (ESO1-T2), T2 cells pulsed with MAGE-A4 peptide (MAGE-T2), melanoma cell line (NW-MEL-38, NY-ESO-1+/HLA-A*02:01+) and colon tumor cell line (HCT116, NY-ESO-1−/HLA-A*02:01+) were used. 51Cr-labeled target cells were cocultured with CD8+ and CD4+ T cells for 12 hours. (G) Cross-reactivity of the NY-ESO-1-TCR with other peptides with amino acid sequences similar to that of the NY-ESO-1 peptide. WT and nine similar amino acid sequences. The WT NY-ESO-1/HLA*02:01-restricted peptide, SLLMWITQC, is listed at the top. Nine peptides are prepared by replacing each amino acid with alanine. (H) Nine peptides were synthesized, S1A, L2A, L3A, M4A, W5A, I6A, T7A, Q8A, C9A, by replacing each amino acid with alanine. TCR-T cells that responded to WT peptide and the synthesized nine peptides were analyzed by intracellular IFN-γ staining. The response to WT peptide was a positive control. Four amino acids (M, W, I, Q) were evaluated to be essential to TCR recognition. (I) Intracellular IFN-γ staining of TCR-T cells responding to the 11 analogous peptide-pulsed target cells. The 11 peptides are derived from known human proteins. YLNMWITTC, taste receptor type 2 member 8; GMDMWSTQD, claudin-18 isoform 1 precursor; QYLMWLTQK, phosphatidylinositol 3-kinase regulatory subunit alpha; AMVAWVTQE, serine/threonine-protein phosphatase 6 regulatory subunit 1; FQDMWITAA, actin-related protein T3; FQQMWITKQ, actin, alpha skeletal muscle; GQKMWITNG, medium-chain specific acyl-CoA dehydrogenase, mitochondrial; GQPLWITAT, ectonucleotide pyrophosphatase/phosphodiesterase family; YVIMWITYM, Niemann-Pick C1 protein precursor; LVGLWITQW, phosphatidylcholine:ceramide cholinephosphotransferase 2; KIALWITYG, gasdermin-C. The response to WT peptide was a positive control (figure 1H).
RNA analysis for endogenous TCR expression
We evaluated effects of endogenous TCR knockdown in the T cells that were transduced with the retroviral vector. Suppression effects of endogenous TCR were calculated as TCR-α RNA in siTCR gene-transduced cells/TCR-α RNA in non-gene modified cells (NGMCs), or TCR-β RNA in siTCR gene-transduced cells/TCR-β RNA in NGMCs (online supplemental method).
ELISPOT and cytotoxicity assays
We evaluated the effect of retroviral vector-transfected T cells on immune function. Transfected T cells were separated into CD8+ T cells and CD4+ T cells using anti-CD8-coated and anti-CD4-coated magnetic beads (Miltenyi Biotec, Bergisch Gladbach, Germany), respectively. Interferon gamma (IFN-γ) ELISPOT assay was performed as previously described.17 Target cells were SK-MEL37 (NY-ESO-1+/HLA-A*02:01+ melanoma cell line) and 397mel (NY-ESO-1+/HLA-A*02:01− melanoma cell line). 397mel cells were transfected with the HLA-A*02:01 and HLA-A*02:06 genes. We also evaluated the cytotoxic effects by targeting T2 cells pulsed with NY-ESO-1 peptide (ESO1-T2), T2 cells pulsed with MAGE-A4 peptide (MAGE-T2), melanoma cell line (NW-MEL-38, NY-ESO-1+/HLA-A*02:01+), and colon tumor cell line (HCT116, NY-ESO-1-/HLA-A*02:01+). In the cytotoxic assay, CD8+ and CD4+ T cells were enriched by sorting with the NY-ESO-1/HLA-A*02:01-tetramer. We manufactured the NY-ESO-1 peptide/HLA-A*02:01 tetramer for the assay.18 Chromium-51 (51Cr) labeled target cells were cocultured with the CD8+ and CD4+ T cells for 12 hours.17
Alanine scanning for cross-reaction
To determine whether the affinity-enhanced NY-ESO-1-targeting TCR can cross-react with other peptides that have amino acid sequences similar to that of the NY-ESO-1 peptide, we replaced nine amino acids with alanine one by one and found four essential amino acids (M, W, I, Q) that reacted with the TCR molecule. Then, we searched for sequences homologous to NY-ESO-1 peptide sequences, 157–165 amino acids. Eleven analogous peptides were selected. The response to the 11 peptides was evaluated by intracellular IFN-γ staining of TCR-T cells.17
DNA microarray in the TCR-T cells
To analyze the off-target effect of gene modification by the siTCR vector, we measured gene expression by DNA microarray in TCR-gene transduced T cells compared with those non-transduced T cells in four healthy individuals (online supplemental method). To determine the difference in gene expression between untransduced and TCR-transduced cells, a gene-expression change of more than twofold or less than half was defined as a significant change.
TCR-T cell preparation for clinical use
Lymphocytes were isolated using density gradient centrifugation from 200 mL of peripheral blood drawn from each patient. The lymphocytes were cultured in a cell-processing facility with interleukin 2 (IL-2), anti-CD3 antibody, and RetroNectin (Takara Bio, Shiga, Japan). Proliferating lymphocytes were infected with the retroviral vector, MS3-NY-ESO-1-siTCR (siTCR). The cells were tested for qualification prior to transfer.
Study design
This study was a phase I, 3+3 design, cell dose-escalating clinical trial of TBI-1301 transfer for treating patients with recurrent solid tumors expressing the NY-ESO-1 antigen. The study was a multiinstitutional trial in Japan that involved seven participating institutes. The primary objectives were to determine safety, including the incidence and grades of adverse events, to detect replication-competent retrovirus by PCR, and to detect the appearance of clonality by linear-amplification-mediated PCR. The secondary objective was to assess clinical responses.
Major inclusion criteria for trial entry were as follows: patients had histologically or cytologically confirmed solid tumors, had a solid tumor which is unresectable and refractory to standard therapy (chemotherapy, radiotherapy, etc.), were HLA-A*02:01 or HLA-A*02:06 positive, had NY-ESO-1 expression verified by PCR or immunohistochemistry (IHC), an Eastern Cooperative Oncology Group Performance Status of either 0 or 1, and were aged 20 years or more at the time of consent. The other inclusion criteria and major exclusion criteria are described elsewhere (online supplemental method).
Trial participants were divided into three cohorts of three patients each. Cohort 1 was given a dose of 5 × 10⁸ cells (whole cells including TCR-transduced lymphocytes) preconditioned with 1500 mg/m2 cyclophosphamide divided into 2 days. Cohort 2 was given 5× 10⁹ cells preconditioned with 1500 mg/m2 cyclophosphamide divided into 2 days. Cohort 3 was given 5 × 10⁹ cells preconditioned with 1500 mg/m2 cyclophosphamide divided into 2 days and fludarabine 100 mg/m2 divided into 5 days.
The study was conducted in accordance with the current version of the Declaration of Helsinki. Written informed consent for enrollment and publication was obtained from all patients who participated in this study. The protocol was approved by the institutional review board at each site. This clinical trial was registered in ClinicalTrials.gov under ID: NCT02366546.
Expression of NY-ESO-1 antigen
NY-ESO-1 expression was determined by IHC using the monoclonal antibody E978 (Sigma-Aldrich, Saint Louis, Missouri, USA).4 Tissue samples with at least 5% positively stained area were considered antigen-positive. Focally stained samples were also positive.
Treatment protocol
After preparing TCR-gene transduced lymphocytes, patients were given TBI-1301 intravenously following the preconditioning treatment. On days 28 and 56, safety and clinical responses were assessed (online supplemental figure 1).
Supplemental material
Clinical safety was evaluated according to the National Cancer Institute Common Terminology Criteria for Adverse Events ver.4.0 (NCI-CTCAE ver.4.0). The diagnostic criteria for CRS in this trial were fever (≥38°C) and at least one CRS-related symptom. CRS-related symptoms included: (1) fatigue, nausea, vomiting, appetite loss; (2) hypotension; (3) hypoxia; and (4) tachycardia. CRS grade reported by Lee et al was used in this study.19 Tumor responses were assessed based on the Response Evaluation Criteria in Solid Tumors ver.1.1 (RECIST ver1.1).20 All safety information was collected and evaluated, and dose escalation was judged by the Independent Data and Safety Committee. Patients and/or the public were not involved in the design, conduct, reporting, or dissemination plans of this research.
Cytokine analysis
Sera were collected from patients at baseline and on days 1, 2, 3, and 7. IL-6, IL-2, IFN-γ, and tumor necrosis factor alpha (TNF-α) concentrations were measured with ELISA commercial kits (DRG Diagnostics, Marburg, Germany), using an automated immunoassay analyzer (Stat Fax, Los Angeles, California, USA). Levels of 48 different human cytokines and chemokines in culture supernatants were determined using Bio-Plex kits (BioRad, Hercules, California, USA), as previously described.21
Determining T cell phenotype and peptide-specific IFN-γ responses by flow cytometry
T cell phenotypes of the TBI-1301 products were analyzed using the following antibodies: anti-CD3 (Becton Dickinson Biosciences, Franklin Lakes, New Jersey, USA), anti-CD4 (Becton Dickinson Biosciences), anti-CD8 (Becton Dickinson Biosciences), anti-CD45RA (Beckman Coulter, Brea, California, USA), and anti-CCR7 (BioLegend, San Diego, California, USA). T cell differentiation status of the infusion products was determined by measuring the proportion of stem cell-like memory (CD45RA+/CCR7+), central memory (CD45RA−/CCR7+), effector memory (CD45RA−/CCR7−), and terminally differentiated (CD45RA+/CCR7−) T cells.22 Data analysis was performed using FlowJo (Tree Star, San Carlos, California, USA).
High-dimensional T cell profiling by mass cytometry
A panel to track and profile antigen-specific T cells was designed and validated using healthy donor PBMCs. The panel includes a total of 36 antibodies to measure lineage/phenotypic markers together with a tetramer multiplexing scheme to test for 10 different peptide specificities using a previously described triple coding approach.23 Manufactured infusion products were thawed and longitudinal PBMCs derived from patient samples were thawed and sorted for live lymphocytes before staining with a heavy metal–labeled peptide MHC tetramer cocktail24 containing the NY-ESO-1 target epitope as well as up to nine control viral antigens and 36 different metal-labeled antibodies for immune cell subset discrimination and phenotypic profiling. All samples were individually barcoded and acquired using a HELIOS mass cytometer (Fluidigm, South San Francisco, California, USA). After data preprocessing,25 each PBMC sample was manually debarcoded followed by gating on live CD8+ T cells (CD45+, DNA+, cisplatin−, CD3+) (Fluidigm) (BioLegend) after gating out monocytes and B cells (CD14+, CD19+) (BioRAD) (BioLegend), TCR-γδ cells (CD3+, TCR-γδ+) (BioLegend) and mucosal associated invariant T (MAIT) cells (CD161+ Va7.2+) (BioLegend) using FlowJo (Tree Star). Manufactured infusion products were gated on live NY-ESO-1-specific CD8+ T cells after gating out TCR-γδ cells (CD3+, TCR-γδ+) and NY-ESO-1 unspecific tetramer signals. Phenotypic profiles of T cells were analyzed and displayed using uniform manifold approximation and projection (UMAP) for high-dimensionality reduction,25 histograms, and heat maps (per cent of positive cells for each phenotypic marker). Data analysis was performed using Cytographer, ImmunoScape’s cloud-based analytical software and FlowJo.
Statistical analysis
To compare the T-cell phenotype of CRS and non-CRS groups, we used Levene’s test to determine equality of variance and Student’s t-test (Welch’s test) to determine statistical differences. Calculations were performed with SPSS Statistics V.25 (IBM Japan, Tokyo, Japan).
Results
Preclinical study of G50A+A51E TCR-transduced T cells
We used a retroviral vector encoding NY-ESO-1157-165/HLA-A*02:01-specific affinity-enhanced TCR-α and TCR-β chains (G50A+A51E TCR) with interfering RNA constructs that specifically downregulate endogenous TCR (figure 1A).
First, we evaluated the transduction efficiency of the TCR by the retroviral vector on CD8+ T cells and CD4+ T cells in healthy volunteers. Figure 1B shows that CD8+ and CD4+ T cells were stained with the NY-ESO-1 peptide/MHC tetramer. 87.6% of CD8+ T cells and 89.0% of CD4+ T cells were positive for the tetramer.
Next, we evaluated the knockdown effects of endogenous TCR expression in gene-modified T cells. The amount of TCR-α RNA in the three samples was 0.285, 0.311, and 0.464 in NGMCs, and the TCR-β was 0.260, 0.340, and 0.412, respectively. The mean and SD of these were 0.354±0.78 and 0.337±0.062, respectively (figure 1C). These results were consistent with our previous results on the suppression effect of endogenous TCR using siTCR vectors.15 16
Then, to analyze the immune functions of NY-ESO-1 TCR-gene transduced T cells, we performed an IFN-γ ELISPOT assay. The G50A+A51E TCR-CD8+ and G50A+A51E TCR-CD4+ T cells exhibited IFN-γ secretion against both HLA-A*02:06+ and HLA-A*02:01+ NY-ESO-1-expressing tumor cells (figure 1D). Both CD8+ T cells and CD4+ T cells with the G50A+A51E TCR responded to SK-MEL37 (NY-ESO-1+, HLA-A*02:01+) and 397mel (NY-ESO-1+, HLA-A*02:01−) transfected with HLA-A*02:01, whereas another NY-ESO-1-specific 1G4-clone TCR functioned only in CD8+ T cells (figure 1E). By diluting the concentration of NY-ESO-1 peptide in the IFN-γ ELISPOT assay, the titration of the peptide was done for the wild-type (WT) TCR (1G4-clone TCR) and the affinity-enhanced (AE) TCR (G50A+A51E TCR). We found that both CD8+ and CD4+ T cells transduced with AE-TCR reacted to the target cells at similar peptide concentrations. On the other hand, in the wild-type TCR (1G4-clone TCR), the response of CD4+ T cells was reduced compared with that of CD8+ T cells at lower concentrations (online supplemental figure 2). Next, we evaluated the killing effect of G50A+A51E TCR-CD8+ and G50A+A51E TCR-CD4+ T cells against HLA-A*02:01+ NY-ESO-1 expressing tumor cells. We found that both CD8+ and CD4+ T cells exhibited cytotoxic effects against the melanoma cell line (figure 1F).
To determine whether the NY-ESO-1-targeted TCR can cross-react with other peptides analogous to the NY-ESO-1 peptide, we performed an IFN-γ ELISPOT assay with T cells transduced with G50A+A51E TCR (TBI-1301). Since an alanine-scanning assay suggested that positions 4, 5, 6, and 8 represent the core motif of the NY-ESO-1 peptide in terms of recognition by the TCR (figure 1G,H), a database search suggested 11 analogous peptides derived from known human proteins that potentially harbors the TCR-stimulating sequences. However, we observed no cross-reactivity between TBI-1301 and any of the 11 peptides tested (figure 1I).
Lastly, to assess any potential off-target effect of gene modification by the siTCR vector, we measured gene expression using a DNA microarray in TCR-gene transduced T cells relative to untransduced T cells in four healthy individuals. We found that 7,791,5212 genes were changed by the transduction of the TCR gene. Then, we searched for genes with more than twofold or less than half RNA signal difference. We did not detect significantly overlapped genes that were either upregulated or downregulated in all tested healthy individuals (online supplemental figure 2). This finding suggests that no potential off-target effects would develop with the siTCR vector, which we used in the trial.
T cell preparation for the clinical trial
From February 2015 to October 2018, 17 patients participated in the clinical trial, and TCR-gene transfused T cells were manufactured. Among them, nine patients received TBI-1301. The nine patients were divided into two cohorts: cohort 1 (three patients) was infused with 5×10⁸ TBI-1301/dose, while cohort 2 (six patients) received 5×10⁹ cells/dose (table 1). After preparing TBI-1301, we analyzed the infusion product composition. Among the TBI-1301 products from nine patients, more than 98% were CD3+ T cells, with CD8+ cells being the main T cell component. The median proportion CD4+ T cells was 22.5% (ranging from 11.3% to 42.9%), and median CD8+ T cell proportion was 75.3% (ranging 54.7%–84.3%). The median proportion of NY-ESO-1 tetramer–positive CD8+ T cells was 65.9% (ranging from 53.2% to 71.9%), while the median proportion of NY-ESO-1157-165 peptide–specific IFN-γ releasing CD8+ T cells was 48.7% (ranging from 25.9% to 57.6%) (online supplemental table 2).
Patients’ characteristics who received NY-ESO-1-TCR-gene transduced lymphocyte transfer
Infusion of NY-ESO-1 TCR-T cells (TBI-1301) in patients with solid tumor
Three patients were enrolled in cohort 1 and six in cohort 2 (table 1). After discussing the results from cohorts 1 and 2, we decided not to proceed to cohort 3 (TBI-1301 5×10⁹ cells/dose, cyclophosphamide 1500 mg/m2, and fludarabine 100 mg/m2, as a preconditioning regimen) and terminated this trial earlier than planned. As shown in table 1, all the patients had solid tumors that were either recurrent or metastatic. Moreover, they all had a history of either chemotherapy, radiotherapy, surgery, or a combination thereof. The expression of NY-ESO-1 was determined by IHC in all cases. Among the nine patients, four had synovial sarcoma while the remaining five all had breast cancer, malignant salivary tumor, melanoma, ovarian cancer, and myxoid liposarcoma. All four patients with synovial sarcoma had ≥75% NY-ESO-1-expressing tumors.
Safety assessment
Among the nine patients enrolled, seven had TBI-1301-related adverse events (table 2). Grade 2 CRS and fever occurred in three patients (patient no 8, no 9, and no 16) and were the most common events. Onset occurred between 13.5 and 28.5 hours after TBI-1301 infusion. The other patients (patient no 1, no 2, no 3, no 7, no 14, and no 15) did not develop CRS.
Adverse events that were related to NY-ESO-1 TCR-gene transduced T cell infusion (n=9)
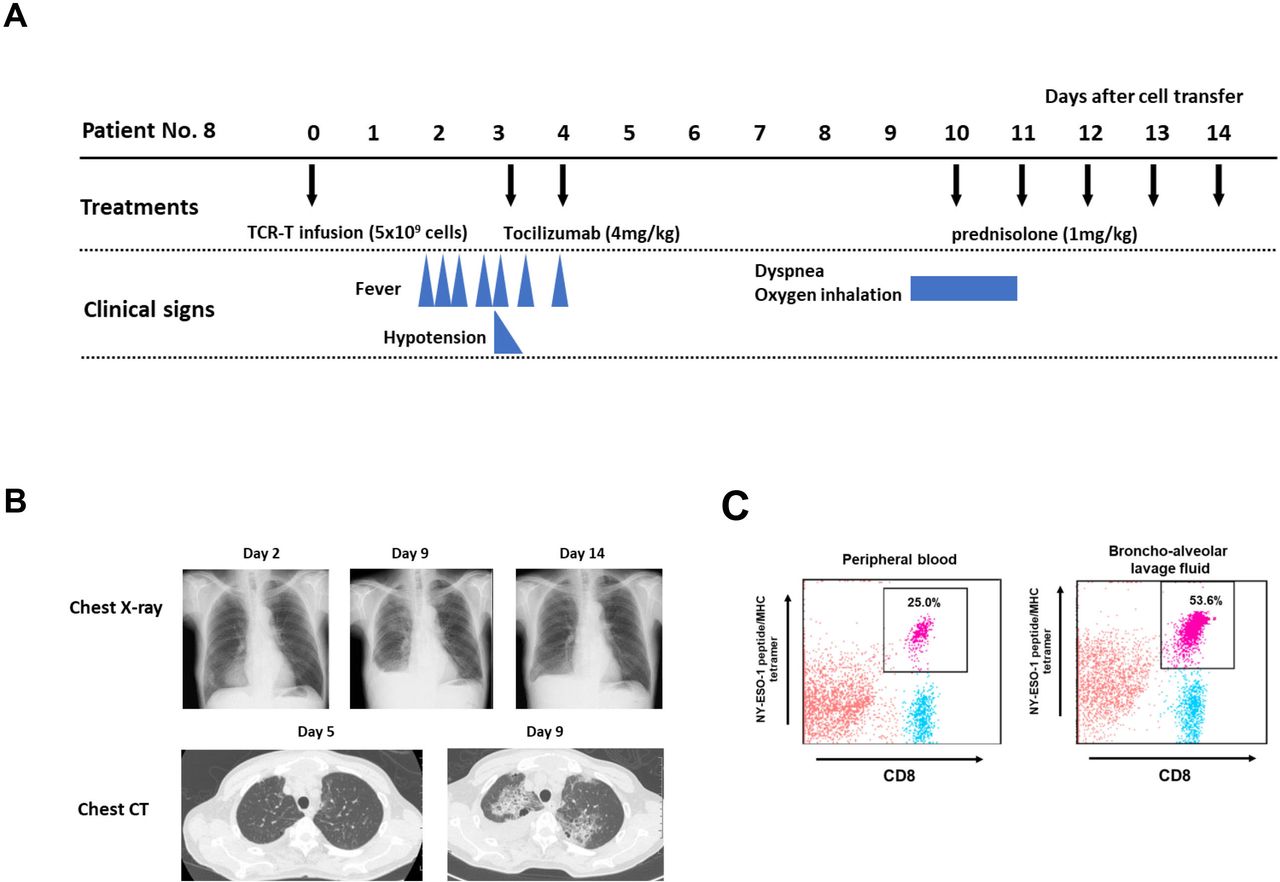
There was one TBI-1301-related lung injury in this trial. Patient no 8 developed lung injury after resolution of CRS. He had refractory synovial sarcoma and received 5×10⁹ cell-dose TCR-T cells (table 1). He developed grade 2 CRS on day 2 post day 0 TBI-1301 infusion and received tocilizumab treatment, which resolved the symptoms (figure 2A). On day 9, he complained of dyspnea, and the chest X-ray and CT image revealed bilateral central pulmonary infiltrations and right pleural effusion (figure 2B). The bronchoalveolar lavage fluid contained 53.6% NY-ESO-1/HLA-A*02:01-tetramer staining CD8+ T cells, and 25.0% of CD8+ T cells in peripheral blood were tetramer-positive (figure 2C). Soon after 1 mg/kg prednisolone started, his symptoms resolved and the pulmonary infiltrates and pleural effusion decreased (figure 2B). Three more patients were enrolled in cohort 2, but no additional lung injury was observed.

Clinical course of patient no 8. (A) Clinical course of patient no 8, who developed grade 3 lung injury after grade 2 cytokine release syndrome. (B) Chest X-ray (days 2, 9, and 14) and chest CT scan (days 5 and 9) of patient no 8. (C) Flow cytometry analysis of NY-ESO-1 tetramer–positive T cells in peripheral blood (PB) and bronchoalveolar lavage fluid (BALF) on day 10. Mononuclear cells were separated and were ex vivo stained with anti-CD8 antibody and NY-ESO-1 peptide/MHC tetramer. 25.0% of CD8+ T cells in PB were tetramer positive, and 53.6% of CD8+ T cells in BALF were also positive. TCR-T, T-cell receptor-engineered T cells.
TBI-1301 cell kinetics after infusion
By analyzing the TCR transgene copy number (online supplemental method), infused cells were detected in peripheral blood in all nine patients, appearing soon after cell infusion (online supplemental figure 3). The number of cells was dependent on the initial dose during the first 14 days, reaching peak and plateau levels between days 3 and 7, before decreasing over the next 14 days. In cohort 2, the median peak level was 20.9%, ranging from 8.8% to 29.5% in PBMCs. In cohort 1, the peak levels were from 0.7% to 2.0%.
Tumor response and clinical course after TBI-1301 infusion
Seven patients subjected to TBI-1301 infusion had measurable tumors. Among them, three showed greater than 30% tumor regression from baseline tumor sizes (patient nos 7, 8, and 16) (figure 3A, online supplemental figure 4). All three had synovial sarcoma and were 75% or more positive for NY-ESO-1 by IHC. As shown in figure 3B, patient no 7 had persistent tumor responses over the course of 8 months. Patient no 8 had transient tumor growth for the first 9 days prior to regression. As shown in figure 2A, he received steroid therapy for the lung injury from day 10. The chest wall metastasis of synovial sarcoma regressed in size on day 28 and day 56 (online supplemental figure 4). It is assumed that the antitumor effect of the TCR-T cells remained despite steroids. Patient no 16 had large pulmonary tumors that regressed for the first 28 days but resumed growing afterwards. CRS was observed in patients with high NY-ESO-1 expressing tumors. There seemed to be no correlation between observed tumor size changes and CRS development. Patient no 2 had two gradually growing lung nodules. The lung nodule was 4 mm at the time of TBI-1301 transfer but shrank to 2 mm following TBI-1301 infusion. The patient has remained progression-free for more than 4 years (figure 3B).

Tumor responses after TBI-1301 infusion. (A) Waterfall plot of seven patients. Seven of the nine patients had measurable lesions that could be evaluated for tumor response. Patient nos 2 and 14 had no measurable tumor lesions. Patient nos 7, 8, and 16 had synovial sarcoma. Patient nos 8, 9, and 16 developed CRS. (B) Swimmer plot for the nine patients treated with TBI-1301. Patient no 2 had no measurable lesion. CRS, cytokine release syndrome; TBI-1301, TCR-transduced T cell product; TCR-T, T-cell receptor-engineered T cells.
Inflammatory cytokine levels in serum of patients with cytokine release syndrome
Among the six patients in cohort 2, three (nos 8, 9, and 16) developed grade 2 CRS. No 15 had a grade 2 fever but was not diagnosed with CRS. We determined chronological serum cytokine levels in these three patients and compared them with the three patients who did not develop CRS. As shown in figure 4A,B, serum IL-6 levels were higher in all three patients with CRS, compared with patients without CRS. The patients with CRS were all treated with anti-IL-6 receptor antibody, tocilizumab, but their serum IL-6 levels continued to increase despite tocilizumab treatment.

Chronological serum cytokine level in six patients who received 5×10⁹ TBI-1301 cells. (A) Serum IL-6, IFN-γ, TNF-α, and IL-2 levels in three patients with CRS. (B) Cytokine levels in three patients without CRS. (C) Multiple cytokines levels measured by Bio-Plex Pro human cytokine screening 48-Plex panel in three patients with CRS. (D) Cytokine levels in two patients without CRS. The serum sample from patient no 7 was unavailable. (E) Cytokine levels in the supernatants of TBI-1301 products from six patients after culturing with NY-ESO-1 peptide–pulsed target cells. Data from patients with CRS are shown on the left and those from patients without CRS are on the right. (F) Cytokine profiles responding to NY-ESO-1-peptide stimulation of TBI-1301 manufactured products in patients with and without CRS. CRS, cytokine release syndrome; IFN-γ, interferon gamma; IL, interleukin; TBI-1301, TCR-transduced T cell product; TNF-α, tumor necrosis factor alpha.
Next, we determined multiple cytokine levels using Bio-Plex Pro human cytokine screening 48-Plex panel in serum collected from five patients, among whom three developed CRS and two did not. Among the 48 cytokines, IL-6 and monocyte chemotactic protein-1 (MCP-1)/CCL2 were higher in the three patients with CRS (figure 4C) compared with the two patients without CRS (figure 4D). IL-3 was increased in the three patients with CRS and one patient without CRS.
To investigate the cause of increased cytokine levels, we collected the supernatants of TBI-1301 products from six patients that were cultured with NY-ESO-1 peptide–pulsed target cells. All TBI-1301 products showed high levels of secreted IFN-γ. We found that the cytokine profiles of patients with CRS were similar to those of patients without CRS (figure 4E,F).
T cell phenotypes of TBI-1301 products
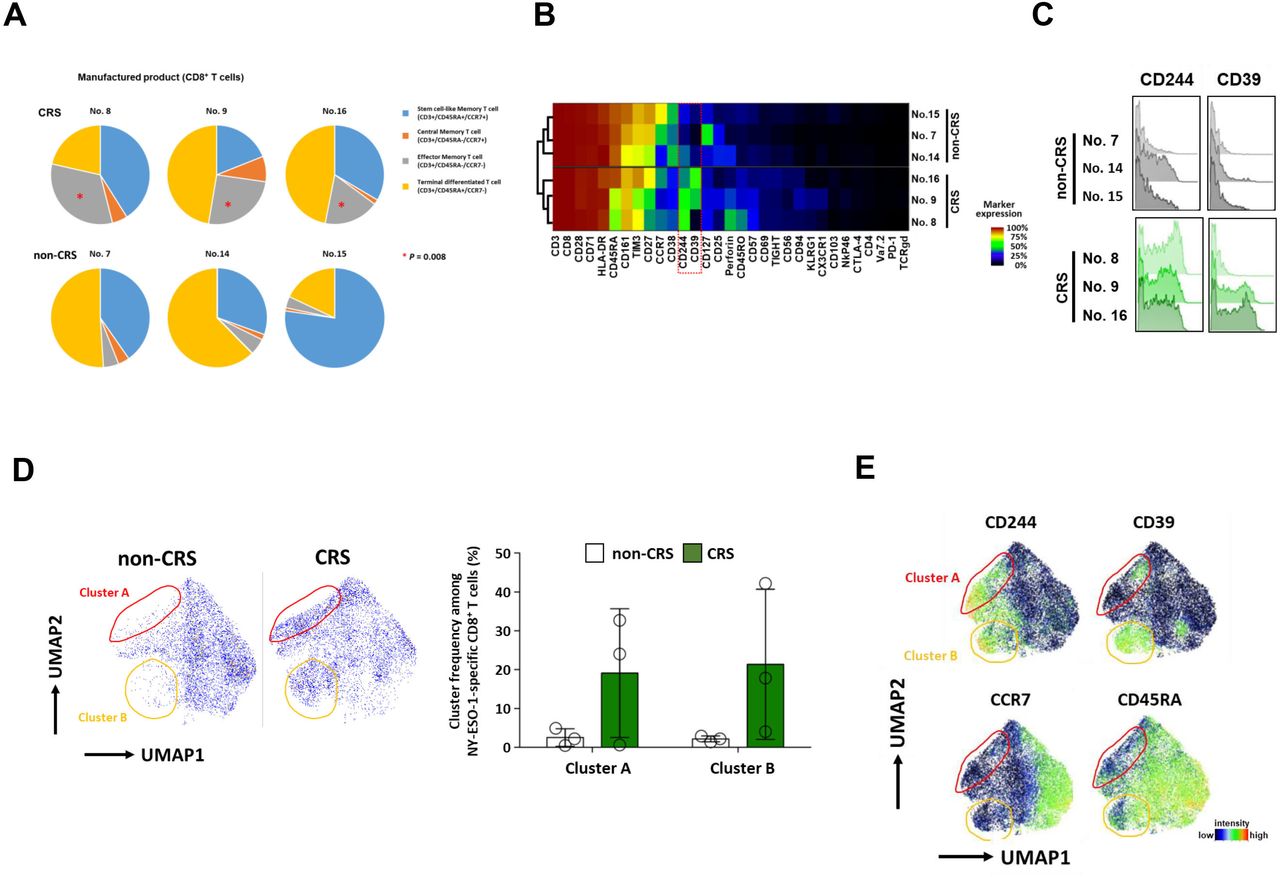
T cell differentiation status of the infusion products was determined by measuring the proportion of stem cell-like, central memory, effector memory, and terminally differentiated T cells. Among six patients in cohort 2, three patients with CRS (nos 8, 9, and 16) were found to be infused with a product with a significantly greater proportion of CD8+ T cells with an effector memory-like phenotype compared with the remaining three patients without CRS (p=0.008) (figure 5A, online supplemental table 3).
T cell phenotypes and high-dimensional immune profiles of TBI-1301 manufactured products. (A) T cell phenotypes of TBI-1301 manufactured products. Three patients, nos 8, 9, and 16, with CRS had significantly more frequent CD8+ T cells with effector memory phenotypes (p=0.008). Stem cell-like memory T cells, CD45RA+/CCR7+; central memory T cells, CD45RA−/CCR7+; effector memory T cells, CD45RA−/CCR7−; terminally differentiated T cells, CD45RA+/CCR7−. (B and C) High-dimensional immune profiles of NY-ESO-1 tetramer+ CD8+ T cells in the manufactured T cell product. CD244 and CD39 levels in NY-ESO-1-specific CD8+ T cells among the manufactured T cell products. Nos 8, 9, and 16 developed CRS, whereas nos 7, 14, and 15 did not. (D) Cells located in either cluster A (area enclosed with red line), cluster B (area enclosed with orange line), or both in infusion products of patients with CRS are not seen in infusion products of patients without CRS. No statistical difference was found between the two groups. (E) Clusters A and B are characterized by high levels of CD244 and CD39 and a lack of CCR7. CRS, cytokine release syndrome; TBI-1301, TCR-transduced T cell product; UMAP, uniform manifold approximation and projection.
High-dimensional T cell profiling
We used mass cytometry and a panel of 36 metal-tagged antibodies to perform an in-depth phenotypic characterization of TCR-transgenic T cell infusion products and their peripheral counterparts in patient PBMC samples after infusion. We observed heterogeneous marker expression across all NY-ESO-1-specific T cell infusion products. Notably, we detected differential expression of CD244 and CD39 on T cells derived from products that were associated with CRS in the respective patients (figure 5B,C). In contrast, the expression of both markers was remarkably lower on T cells derived from patients without CRS. This was further confirmed by using UMAP high-dimensional reduction technique for high-dimensional data visualization. The phenotypes of NY-ESO-1-specific T cells used as infusion products in patients with CRS differed in the presence of two cell clusters that were characterized primarily by elevated levels of CD244, CD39, and CD45RA and a lack of CCR7 (figure 5D,E). Neither cluster was detected in the infusion products from patients without CRS. The unique profiles of NY-ESO-1-specific T cells were also maintained after infusion into the respective patients. Similar phenotypes were observed when the cells were tracked in the periphery of the recipients who developed CRS, up to 4 weeks post infusion (online supplemental figure 5).
Discussion
T cells used in this study were transduced with a transgene encoding NY-ESO-1-specific TCR harbored in a retroviral vector different from the vectors used in previous clinical trials.7 8 26 Transducing an exogenous TCR gene can lead to the risk of acquiring reactivity to unexpected antigenic peptides. Fatal adverse events have been observed with MAGE-A3 TCR-T cell therapy due to cross-reactivity of TCR with MAGE-A12 expressed in the central nervous system27 and titin expressed in the myocardium.28 29 Additionally, lethal GVHD has been reported in mouse experiments.11 To reduce these risks, we designed a retroviral vector that expresses siRNA to specifically suppress endogenous TCR.14 We verified that endogenous TCR expression was suppressed by this construct following gene transfer. Previous studies have shown enhanced expression of transduced TCR.14–16
We found that an increased TCR affinity was associated with cytotoxic effects in NY-ESO-1-positive CD8+ as well as CD4+ T cells. This indicates that an increased TCR affinity leads to higher clinical efficacy, which is consistent with the tumor response observed in this trial. The combined use of CD4+ and CD8+ T cells at a specific ratio during CAR-T therapy targeting CD19 or CD22 was reportedly advantageous for inducing memory T cells and suppressing CRS expression.30 31 This suggests that our TCR-T products are advantageous (figure 1E,F). This finding is consistent with the previously reported role of CD4+ T cells in T-cell therapy in preclinical models.32–34
We conducted a first in-human phase I trial of ACT using novel endogenous TCR-silenced and affinity-enhanced NY-ESO-1 TCR-T cells (TBI-1301). Early-onset CRS occurred frequently in patients with tumors expressing high levels of NY-ESO-1. Three out of nine patients developed CRS 13.5–28.5 hours after TBI-1301 transfer, which is earlier than the previously reported onset.26 By measuring the serum levels of various cytokines, we found that IL-6 and MCP-1/CCL2 levels were higher in patients with CRS than in non-CRS cases. IL-3 levels were elevated in patients with CRS and in one patient without CRS (patient no 15). Patient no 15 was not diagnosed with CRS but developed a grade 2 fever following TBI-1301 infusion. In this patient, the IL-3 levels observed may also be related to fever. These cytokines with elevated expression were not secreted by the TBI-1301 cells stimulated with NY-ESO-1 peptide (figure 4E,F), indicating that CRS-related cytokines may have been produced by host monocytes/macrophages. It was assumed that this mechanism of TCR-T-related CRS resembled that of CD19-CAR-T.35 36
In this trial, we encountered a patient with a grade 3 lung injury. It was assumed that the most likely cause was infiltration of TCR-T cells into the alveoli due to capillary leak syndrome caused by hypercytokinemia. Patient no 8 exhibited higher levels of multiple cytokines than the other five patients (figure 4A,C). This indicated that the expression of these cytokines may have remained high after CRS. Subsequently, high cytokine levels caused capillary leak syndrome, and TCR-T cells may have eventually infiltrated the alveoli. This lung injury was successfully treated with steroid therapy. Another possibility is that TCR-T cells may have infiltrated the lungs by targeting NY-ESO-1-expressing synovial sarcoma micrometastases. Synovial sarcomas frequently metastasize to the lungs. However, we have no evidence for this hypothesis, as there are no validated methods for detecting micrometastases. Other possible mechanisms include TCR recognition of normal lung tissue-derived peptides presented on HLA-A*02:01 or non-HLA-A*02:01 MHC molecules. The former mechanism resembles the cases of fatal myocardial injury caused by melanoma-associated gene antigen 3 (MAGE-A3)-TCR recognition of titin.28 29 It was assumed that cross-reactivity with normal tissue was less likely, because it took 10 days to develop lung injury in patient no 8. This is in contrast to the adverse events reported in titin recognition by MAGE-A3-TCR.28 29 Additionally, the antitumor effect continued in patient no 8 even after lung injury recovery by steroid administration. Moreover, similar adverse events did not occur in the other 17 cases in this trial and in another TBI-1301 trial using the same NY-ESO-1 TCR.37
In the preclinical study, we did not expect a TCR-mediated immune response toward antigens with sequences similar to the NY-ESO-1 peptide. However, the possibility of TCR recognition by peptides derived from other antigens normally expressed in the lung cannot be completely excluded. In future studies, TCR reactivity must be determined in advance using more comprehensive methods such as X-scan.38 39 In addition, it is important to determine off-target effects on non-target antigens following gene transfer. Prior to the clinical trial, we performed comprehensive measurements of gene expression in transgenic T cells using microarrays and observed no further changes in expression compared with those in the untransfected cells. These are important preclinical data that will help reduce the risk of off-target effects.
Regarding T-cell kinetics after ACT, we observed that T cells expanded in vivo with a 4–15 fold increase between days 3 and 7. However, TCR-T cells disappeared in most patients within 28 days. Prolonged in vivo persistence may lead to a higher therapeutic efficacy.
We found that despite identical preparation procedures, the ex vivo gene-engineered T cells displayed interpatient variations in their functional phenotypes. Notably, the levels of CD244, CD39, or both were elevated in the infusion products of patients with CRS. This elevation was maintained in NY-ESO-1 TCR-T cells, which were tracked in these patients after infusion. CD244 signaling is associated with dual functionality and has been reported to result in either T-cell activation or exhaustion.40 41 CD39 is associated with T-cell exhaustion in tumor-infiltrating CD8+ T cells42 43 but can also serve as a marker of tumor specificity.44–46 In this study, CD39 and CD244 were detected among the CD8+ T-cell products (figure 5B, C and E). However, T cell products from all patients showed similar IFN-γ secretion (figure 4E) and low programmed cell death protein 1 expression (figure 5B), regardless of whether CD39, CD244, or both were expressed. Therefore, we speculate that expression of CD244, CD39, or both may be a sign of cell activation rather than exhaustion, which triggers CRS onset in patients. The potential association between CD244 and CD39 expression in gene-engineered T cell products and CRS is unclear and should be addressed in future studies. As we did not observe any correlation between CRS and T cell product–derived cytokines, the interaction between these T cells and other immune cells, such as monocytes/macrophages, during CRS pathogenesis remains to be investigated. Nevertheless, our data suggest that CD244 and CD39 expression in engineered TCR-T or CAR-T cells is a potential predictive biomarker for CRS risk in treated patients.
Conclusions
Our trial data indicated that endogenous TCR-silenced and affinity-enhanced NY-ESO-1 TCR-T cells were safely administered, except for a single instance of grade 3 lung injury due to TCR-T-cell infiltration. Lung injury was managed with steroids. TCR-T-cell infusion resulted in a significant tumor response and early-onset CRS in patients with tumors that expressed NY-ESO-1 at high levels. The differentiation properties of the prepared T cells may be prognostic for TCR-T-related CRS. CD244 and CD39 expression in engineered TCR T-cells is a potential predictive biomarker for CRS development. We concluded that affinity-enhanced TCR-T therapy targeting NY-ESO-1 is clinically applicable and can be further developed for practical use.
Data availability statement
Data are available on reasonable request.
Ethics statements
Patient consent for publication
Ethics approval
The study (NCT02366546) was performed in accordance with the current version of the Declaration of Helsinki and Good Clinical Practice guidelines. Written informed consent was obtained from all patients. The protocol was approved by the institutional review board at each site participating in the study.
Acknowledgments
We are grateful to all the patients who took part in this study, their caregivers, and the co-medical staff, data managers, and clinical coordinators. Junko Nakamura and Kazuko Shirakura (Mie University) provided technical assistance with the tetramer and ELISA assay. We thank all coworkers from FIVERINGS and Takara Bio for operating and analyzing this study. We express deep gratitude thanks to Dr Kaoru Hirai, Hiroshi Miyamoto (FIVERINGS), Dr Shinya Tanaka, Shuichi Takahashi, Dr Ichiro Kawashima, Masanobu Kimura, and Dr Kazutoh Takesako (Takara Bio) for their special contributions to operating this clinical trial. This research was supported by the Medical Research and Development Programs Focused on Technology Transfer, Adaptable and Seamless Technology Transfer Program Through Target-driven R&D (A-STEP) from Japan Agency for Medical Research and Development, AMED. Takara Bio supported the clinical trial and the exploratory research.
References
Supplementary materials
Supplementary Data
This web only file has been produced by the BMJ Publishing Group from an electronic file supplied by the author(s) and has not been edited for content.
Footnotes
Contributors MI, SKi, NY, HK, HM, HH, TF, TK, and TS contributed to patient enrollment and conducting the clinical trial in each institution. MI, SKa, AN, and HI wrote the manuscript. EN, TW, and HS reviewed the manuscript. ES worked on the NY-ESO-1 expression. SO, DT, IN, HC, and JM produced the retroviral vector and the TCR-T cells, and they worked on their safety assessment. MFK, PDHN, YS, AN, EN, and MF contributed to the analysis of mass cytometry. YM worked on the analysis of phenotype of TCR-T cells and serum cytokines. SKa and HS act as the guarantors of the overall content.
Funding This research was supported by the Medical Research and Development Programs Focused on Technology Transfer, Adaptable and Seamless Technology Transfer Program Through Target-driven R&D (A-STEP) from Japan Agency for Medical Research and Development, AMED (grant no 16im0110704s0104). Takara Bio supported the clinical trial and the exploratory research.
Competing interests SO, DT, IN, HC, and JM are employees of Takara Bio. The Department of Immuno-Gene Therapy, Mie University Graduate School of Medicine, to which SKa, YM, TW, and HS belonged, was funded by Takara Bio. MFK, PDHN, YS, AN, EN, and MF are employees or consultants of ImmunoScape. MI received honoraria from Chugai, Eisai, MSD, Ono Pharmaceutical, Daiichi Sankyo, and Eli Lilly. As a potential conflict of interest, SKi and NY received research grants from Takara Bio.
Provenance and peer review Not commissioned; externally peer reviewed.
Supplemental material This content has been supplied by the author(s). It has not been vetted by BMJ Publishing Group Limited (BMJ) and may not have been peer-reviewed. Any opinions or recommendations discussed are solely those of the author(s) and are not endorsed by BMJ. BMJ disclaims all liability and responsibility arising from any reliance placed on the content. Where the content includes any translated material, BMJ does not warrant the accuracy and reliability of the translations (including but not limited to local regulations, clinical guidelines, terminology, drug names and drug dosages), and is not responsible for any error and/or omissions arising from translation and adaptation or otherwise.