Article Text

Abstract
Background The inflammatory tumor microenvironment (TME) is formed by various immune cells, being closely associated with tumorigenesis. Especially, the interaction between tumor-infiltrating T-cells and macrophages has a crucial impact on tumor progression and metastatic spread. The purpose of this study was to investigate whether oscillating-gradient diffusion-weighted MRI (OGSE-DWI) enables a cell size-based discrimination between different cell populations of the TME.
Methods Sine-shaped OGSE-DWI was combined with the Imaging Microstructural Parameters Using Limited Spectrally Edited Diffusion (IMPULSED) approach to measure microscale diffusion distances, here relating to cell sizes. The accuracy of IMPULSED-derived cell radii was evaluated using in vitro spheroid models, consisting of either pure cancer cells, macrophages, or T-cells. Subsequently, in vivo experiments aimed to assess changes within the TME and its specific immune cell composition in syngeneic murine breast cancer models with divergent degrees of malignancy (4T1, 67NR) during tumor progression, clodronate liposome-mediated depletion of macrophages, and immune checkpoint inhibitor (ICI) treatment. Ex vivo analysis of IMPULSED-derived cell radii was conducted by immunohistochemical wheat germ agglutinin staining of cell membranes, while intratumoral immune cell composition was analyzed by CD3 and F4/80 co-staining.
Results OGSE-DWI detected mean cell radii of 8.8±1.3 µm for 4T1, 8.2±1.4 µm for 67NR, 13.0±1.7 for macrophage, and 3.8±1.8 µm for T-cell spheroids. While T-cell infiltration during progression of 4T1 tumors was observed by decreasing mean cell radii from 9.7±1.0 to 5.0±1.5 µm, increasing amount of intratumoral macrophages during progression of 67NR tumors resulted in increasing mean cell radii from 8.9±1.2 to 12.5±1.1 µm. After macrophage depletion, mean cell radii decreased from 6.3±1.7 to 4.4±0.5 µm. T-cell infiltration after ICI treatment was captured by decreasing mean cell radii in both tumor models, with more pronounced effects in the 67NR tumor model.
Conclusions OGSE-DWI provides a versatile tool for non-invasive profiling of the inflammatory TME by assessing the dominating cell type T-cells or macrophages.
- tumor microenvironment
- immunotherapy
- T-lymphocytes
- macrophages
- translational medical research
Data availability statement
Data are available upon reasonable request. The datasets generated during and/or analyzed during the current study are available from the corresponding author on reasonable request.
This is an open access article distributed in accordance with the Creative Commons Attribution Non Commercial (CC BY-NC 4.0) license, which permits others to distribute, remix, adapt, build upon this work non-commercially, and license their derivative works on different terms, provided the original work is properly cited, appropriate credit is given, any changes made indicated, and the use is non-commercial. See http://creativecommons.org/licenses/by-nc/4.0/.
Statistics from Altmetric.com
WHAT IS ALREADY KNOWN ON THIS TOPIC
The interaction of T-cells and tumor-associated macrophages is crucial for tumor progression, metastatic spread, and therapy response.
Current imaging approaches to monitor the infiltration of T-cells and macrophages into tumor lesions are based on cell labeling techniques, thus relying on previous tracer injection.
WHAT THIS STUDY ADDS
In this study, we present a tracer-free and non-invasive diffusion-weighted MR imaging approach that allows for in vivo characterization of the inflammatory TME, by using a cell size-based discrimination between cancer cells, T-cells, and macrophages.
Assessment of both either primarily T-cell or primarily macrophage infiltration into tumor lesions enables monitoring of disease progression and early detection of successful response to immunotherapies, even when established tumor volumetry fails to indicate treatment response.
HOW THIS STUDY MIGHT AFFECT RESEARCH, PRACTICE OR POLICY
The presented diffusion-weighted MR imaging approach may serve as a valuable tool for tumor characterization and repeated assessment of response to immunotherapies.
Its robustness provides the preconditions for translation to clinical settings, which may offer substantial improvements in prediction of therapy outcome and patients’ prognosis.
Introduction
Immune cells are main players in building, shaping, and reprogramming the tumor microenvironment (TME).1 2 While the inflammatory TME is characterized by complex and dynamic interconnections between various immune cell subtypes, especially T-cells are major effectors of tumor-promoting inflammation, enhancing tumor progression and metastatic spread.3 4 T-cell activation and priming is critically dependent on their interaction with tumor-associated macrophages, leading to a functional crosstalk between both cell populations.5 Because of their complex interplay with significant impact on therapy outcome and patients’ prognosis,4 6 imaging of both T-cell and macrophage infiltration into tumor lesions is highly desired.
There are several preclinical and clinical studies aiming for in vivo imaging of the intratumoral immune cell infiltrate, mainly applying direct or indirect cell labeling, inter alia using positron emission tomography with different radiotracers or MRI with various nanoparticles.7 Compared with the analysis of immune cells in conventional tissue biopsies, these imaging approaches are less invasive, avoid tissue sampling bias, and can be performed repetitively over time. Imaging mostly targets specific surface or intracellular markers of the immune cells and crucially relies on previous tracer injection.8 Tracer injection may not always be clinically suitable. Therefore, endogenous markers of tissue composition are being investigated as alternatives.
Diffusion-weighted imaging (DWI) samples the diffusivity of water molecules in different compartments. The MR signal of highly diffusive water molecules is attenuated, depending on their distance traveled, whereas slowly diffusing molecules retain most of their signal contribution. Water inside small or between densely packed cells is hindered in diffusing over long distances and thus generates high signal in DWI.9–11 Compared with conventional pulsed gradient DWI, temporally varying gradients provide sensitivity to shorter diffusion distances and thus can resolve smaller structures.12–16 In particular for the investigation of cancer cells, a number of geometric models have been developed that enable extraction of cell sizes from series of DWI measurements.17 18 Based on a limited number of low-frequency oscillating diffusion-encoding gradient spin echo (OGSE) acquisitions, the Imaging Microstructural Parameters Using Limited Spectrally Edited Diffusion (IMPULSED) method selects a specific spectral diffusion window for an accurate quantification of cell sizes, assuming impermeable densely packed spherical cells.17
Cancer cells of various tumor entities, both in humans and in mice, have radii of 6 to 10 µm,17 19 20 whereas T-cells, with radii ranging from 2 to 4 µm,21 are considerably smaller, and macrophages, having radii of up to 15 µm,22 are substantially larger. Accordingly, the mean cell size of a tumor lesion, averaged over all intratumoral cell populations, increases with infiltration of macrophages, while infiltration of T-cells leads to a decrease in mean cell size. Combining the differences in cell size between cancer cells and different immune cells and their subsequent impact on the mean cell radius of a tumor lesion with OGSE-DWI’s capacity to measure mean cell sizes in vivo, OGSE-DWI has the potential to detect changes between predominant cell populations in the tumor and peritumoral tissue.12 17 18 This suggests OGSE-DWI to be a promising approach for non-invasive imaging and cell size-based differentiation of the intratumoral immune cell infiltrate.
Recent preclinical studies have used the IMPULSED approach to detect cell sizes of different breast cancer lines in vitro using centrifuged cell pellets.23 First in vivo studies on a mouse model of colorectal cancer have already shown that the IMPULSED approach using OGSE-DWI is capable of measuring mean cell sizes within tumor lesions, detecting decreasing mean cell sizes after immunotherapy-induced T-cell infiltration.17 24
The purpose of this study was to investigate whether OGSE-DWI allows for dynamic in vivo characterization of different cell populations within the inflammatory TME, assessing TME changes of both myeloid and lymphoid cells during disease progression as well as under immunotherapy. Our particular focus was to provide a tool for monitoring different immune cell populations within the TME.
To this end, we applied the IMPULSED model to sine-shaped OGSE-DWI to differentiate between cell populations with a wide range of radii including those larger than 10 µm. To closely reproduce the in vivo situation and at the same time meet the assumptions of the IMPULSED model, we used in vitro cell spheroids consisting of either pure cancer cells, T-cells, or macrophages. Subsequently, we applied our approach to murine breast cancer models to monitor intratumoral immune cell infiltrates in vivo depending on changes in mean cell sizes due to infiltration of either T-cells (reduction in mean cell size) or macrophages (increase in mean cell size). The specific contribution of infiltrating T-cells and macrophages within the TME was evaluated for two tumor models with divergent degrees of malignancy for a set of different conditions. The TME was investigated during tumor progression, clodronate liposome-mediated depletion of macrophages, and immune checkpoint inhibitor (ICI) treatment which addresses primarily lymphocytes.
Methods
Experimental outline
To assess the accuracy of OGSE-DWI and its ability to distinguish between different cell types, OGSE-DWI was performed on in vitro spheroids, consisting exclusively of either cancer cells, macrophages, or T-cells (online supplemental figure 1a). In vivo scanning of highly malignant 4T1 and low malignant 67NR murine breast tumors over 9 days after tumor implantation was performed to reveal longitudinal changes of the inflammatory TME and its differences between tumors with divergent degrees of malignancy. Dedicated manipulation of the intratumoral immune cell infiltrate was conducted by treating 4T1 tumors with clodronate-loaded liposomes, causing a specific depletion of macrophages. Finally, the ability of OGSE-DWI to monitor treatment response to immunotherapy was studied on 4T1 or 67NR tumor-bearing mice treated with ICIs (online supplemental figure 1b). IMPULSED-derived cell radii were compared with manually measured cell radii after immunohistochemical wheat germ agglutinin (WGA) staining of cell membranes (online supplemental figure 2), and immune cell composition was analyzed by CD3 and F4/80 co-staining.
Supplemental material
Cell lines
Four different cell lines have been used, including the murine breast cancer cell lines 4T1 (high malignancy) and 67NR (low malignancy),25 as well as ER-HoxB8 macrophages, and C57BL/6 pan T-cells. Cell culture conditions and details on T-cell isolation are provided in online supplemental method 1.
In vitro MR imaging
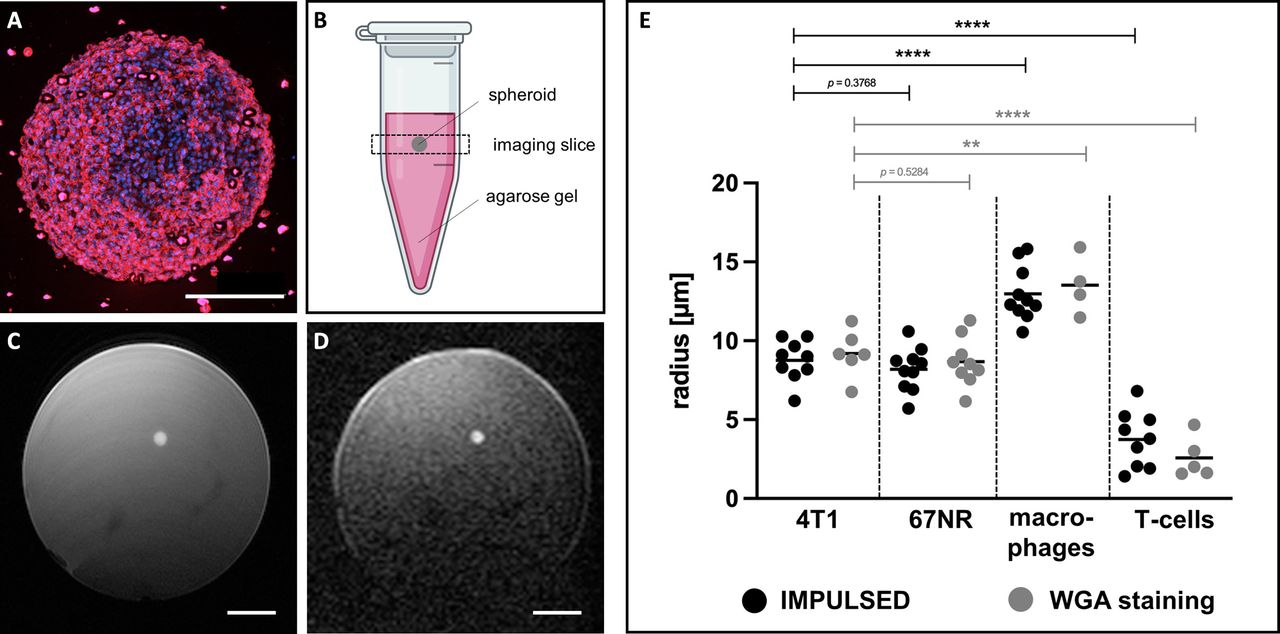
Spheroid formation was performed as previously described26 (online supplemental method 2) and spheroids were embedded in agarose gel-solidified cell culture medium (figure 1A,B). Imaging of the spheroids was performed on a 9.4 T small animal MRI Biospec system (Bruker BioSpin GmbH, Ettlingen, Germany), equipped with an actively shielded gradient system (maximum gradient amplitude of 700 mT/m, slew rate=4500 T/m/s), and a two-element transceiver cryogenic probe, using ParaVision V.6.0.1. For localization of the spheroids, a T2-weighted RARE (rapid acquisition with relaxation enhancement) sequence with TR=2500 ms, TE=11 ms, effective TE=33 ms, 2 averages, 0.6 mm slice thickness, 10.2×10.2 mm2 FOV (field of view), 128×128 matrix, RARE factor=8 was acquired. For the IMPULSED analysis sine-shaped diffusion gradients, oscillating at different frequencies and b-values, were applied. The frequency of 0 Hz simply resulted in a conventional pulsed gradient spin echo sequence (PGSE). One PGSE and two OGSE diffusion-weighted imaging experiments were performed as multi-shot EPI (echo-planar imaging) sequences with four segments (TR=3000 ms, TE=69 ms, 4 averages, 0.6 mm slice thickness, 10.2×10.2 mm2 FOV, 128×128 matrix, three orthogonal diffusion gradient directions, diffusion gradient duration δ=20 ms, diffusion gradient separation Δ=25 ms, and nine b-values including 0, 0.125, 0.25, 0.375, 0.5, 0.75, 1, 1.5, 2 ms/µm2). The sine-OGSE sequence was conducted with gradient frequencies of 50 and 100 Hz, leading to an overall acquisition time of 1 hour:07 min:12 s.

OGSE-DWI is able to differentiate between cancer cells, macrophages, and T-cells using in vitro spheroids. (A) 67NR tumor spheroid after WGA staining of cell membranes (red) and nuclei (blue); scale bar indicates 200 µm. (B) For MR imaging, the spheroid was embedded in agarose gel-solidified cell culture medium. (C) Localization of the spheroid was performed using T2-weighted imaging. Scale bar indicates 1.5 mm. (D) Corresponding diffusion-weighted image of the spheroid (b=0.25 ms/µm2, fOGSE=50 Hz). Scale bar indicates 1.5 mm. (E) IMPULSED-derived cell radii (black) differed significantly between cancer cells (4T1, 67NR) and immune cells, with larger cell radii for macrophages and smaller radii for T-cells, validated by immunohistochemical WGA staining (gray). Statistical significance was determined by two-sided t-tests (**p<0.01, ****p<0.0001). Each dot indicates mean cell radius of one spheroid. Horizontal lines represent group means. Figure partially created using Biorender.com. IMPULSED, Imaging Microstructural Parameters Using Limited Spectrally Edited Diffusion; OGSE-DWI, oscillating-gradient diffusion-weighted MRI; WGA, wheat germ agglutinin.
In vivo experiments
Animal husbandry and experiments were carried out in accordance with local animal welfare guidelines, approved by local authorities (Landesamt für Natur, Umwelt und Verbraucherschutz NRW, Protocol No. 81-02.04.2018.A010). Female BALB/c mice (Charles River Laboratories, Sulzfeld, Germany) were used at the age of 8 to 12 weeks.
Two murine breast cancer models with different degrees of malignancy were used: While highly malignant 4T1 tumors metastasize in regional lymph nodes as well as distant organs, primarily the lung, liver, and bones, 67NR tumors grow non-invasively and do not develop metastases.25 For tumor implantation, 106 4T1 or 67NR cells were resuspended in 25 µL cell culture medium and implanted orthotopically via injection into the lower left mammary fat pad. Tumor sizes were measured daily using a digital caliper. Longitudinal MR imaging during tumor progression was conducted on either day three, six, or nine. On a separate set of animals, decimation of macrophages was induced by treatment with clodronate-loaded liposomes (Liposoma BV, Amsterdam, Netherlands) with a daily tail vein injection (50 mg/kg) starting immediately after tumor implantation, until MR imaging on day six. To evaluate OGSE-DWI’s capability to monitor response to immunotherapies, mice were treated with ICIs (combination of anti-CTLA4 and anti-PD1; Bio X Cell, Lebanon, New Hampshire, USA). Starting on day three after tumor injection, ICI treatment was administered by intraperitoneal injection (10 mg/kg) every other day and MR imaging was conducted on day six or day nine. After MRI scans, the mice were sacrificed and tumors were prepared for immunohistochemical analysis.
In vivo MR imaging
In vivo MR imaging was performed on the same 9.4 T Biospec system, but using a 1H quadrature volume resonator for signal excitation and a 10 mm surface coil for signal reception (Bruker BioSpin GmbH). Mice were anesthetized with 1.5% isoflurane in 1.5 L/min of oxygen and compressed air (1:4) under continuous monitoring of respiration and body temperature. Temperature control was ensured via a warming bed supplied with warm water (Haake SC150, Thermo Scientific). Animals were placed in supine position and the tumor was covered in alginate (Johannes Weithas, Lütjenburg, Germany) to reduce susceptibility artifacts. For anatomical information, a T2-weighted RARE sequence with TR=2500 ms, TE=11 ms, effective TE=55 ms, 2 averages, 1 mm slice thickness, 9 slices, 20×20 mm2 FOV, 256×256 matrix, RARE factor=12 was acquired. Multislice T2-weighted images were used to perform tumor volumetry, using 3D Slicer (https://www.slicer.org/, V.4.11.2021). The slice with the greatest mean tumor diameter was chosen for the subsequent DWI sequences. PGSE and OGSE sequences were performed as multi-shot EPI sequences with four segments (TR=1000 ms, TE=88 ms, 8 averages, 1.0 mm slice thickness, 18×15 mm2 FOV, 96×64 matrix, regional saturation of the surrounding tissue, three orthogonal diffusion gradient directions, diffusion gradient duration δ=25 ms, diffusion gradient separation Δ=30 ms, and nine b-values including 0, 0.125, 0.25, 0.375, 0.5, 0.75, 1, 1.5, 2 ms/µm2). The in vivo OGSE sequence was conducted with gradient frequencies of 40, 80, 120, and 160 Hz, leading to an overall acquisition time of 26 min:00 s.
IMPULSED-derived cell size analysis
Cell radii were calculated from sine-OGSE and PGSE diffusion-weighted images using the IMPULSED approach17 (online supplemental method 3). In brief, we applied IMPULSED to sine-shaped oscillating diffusion gradients to be sensitive for quantification of a wider range of cell radii compared with cosine-shaped oscillating gradient modulations, used in previous studies (online supplemental figure 4): While cosine-shaped OGSE-DWI is particularly sensitive to cell radii smaller than 10 µm, sine-shaped OGSE-DWI is sensitive to larger cell radii of up to 15 µm, without losing discrimination of the small cell radii. Cell sizes were calculated as averages for manually selected regions of interest (ROIs), placed in diffusion-weighted images. For in vitro analysis, an entire spheroid was selected as ROI (n=9 4T1 spheroids, n=10 67 NR spheroids, n=10 macrophages spheroids, n=9 T-cell spheroids). For in vivo analysis, two representative ROIs were placed in the viable tumor border, and their mean yielded the average cell radius per animal. ROIs were placed to avoid central necrosis and hemorrhage, observed during tumor progression and after immunotherapy. Viable tumor parts were identified from multislice T2-weighted RARE images. To reduce the interobserver variability, the ROIs were placed by two different investigators and their localizations within the viable tumor border were confirmed by a board-certified radiologist. Exemplary locations of the ROIs are marked in all figures. In vivo group sizes were as followed: n=8, n=6, n=5 for 4T1 tumors on days three, six, and nine, respectively; n=6, n=6, n=5 for 67NR tumors on days three, six, and nine, respectively; n=6 clodronate-treated 4T1 tumors; n=8, n=7 for ICI-treated 4T1 tumors on days six and nine, respectively; n=7, n=8 for ICI-treated 67NR tumors on days six and nine, respectively.
Ex vivo analysis of spheroids
For ex vivo measurements of cell sizes, the plasma membrane of the spheroid-forming cells was labeled with wheat germ agglutinin (WGA; online supplemental figure 2, online supplemental method 4). Subsequently, confocal images were acquired with an LSM 800 (Carl Zeiss Microscopy, Oberkochen, Germany), and cell radii were determined with the software ZEN V.2.6 (blue edition; Carl Zeiss Microscopy). For quantification of cell radii in 4T1, 67NR, and macrophage spheroids, at least 500 cells of 5 different spheroids were measured. Because T-cells are mostly cadherin-deficient and therefore aggregate poorly,27 their spheroids were overall smaller, and only 100 cells were measured.
Ex vivo analysis of tumor sections
For ex vivo analysis of cancer cells and their microenvironment, tumors were paraffin-embedded and sectioned in 5 µm tissue slices using a microtome (Leica Microsystems, Nussloch, Germany). To validate the cell radii determined by our modified IMPULSED approach, immunohistochemical WGA staining was performed. The radii of at least 1000 cells of the viable tumor border of three different tissue samples were analyzed (online supplemental figure 2). To exclude that changes in cancer cell size, inter alia due to a potentially higher mechanical pressure exerted in larger tumors, dominate the changes observed in mean IMPULSED-derived cell radii, exclusive measurements of cancer cell radii were conducted (online supplemental figure 9). For dedicated analysis of the immune cell infiltrate, immunohistochemical staining of CD3, a pan-T-cell marker,28 and F4/80, a marker of murine macrophages,29 was performed (online supplemental method 5). To further exclude that changes in mean IMPULSED-derived cell radii are dominated by other immune cell populations besides T-cells and macrophages, further immunohistochemical analysis of either granulocytes (Ly6G), natural killer cells (CD49b) or B-cells (CD45R) was conducted (online supplemental figure 10, online supplemental method 5). For reproducible quantitation of mean fluorescence intensities (MFIs), analyses of confocal fluorescence images were conducted following Shihan et al’s protocol,30 using ZEN V.2.6 and ImageJ (Rasband, W.S., US National Institutes of Health, Bethesda, Maryland, USA). Three different, non-overlapping ROIs of the viable tumor border were randomly selected and their MFI yielded the mean MFI for each tumor. Complete cross sections of the tumors are provided in online supplemental figure 11. For each group, three different tumors were analyzed.
Statistical analysis
All values are given as mean±SD. Shapiro-Wilk test was performed to check for normal distribution of data (α=0.05). Two-sided t-tests were performed to compare in vitro radii of the different cell populations. To assess whether the measurements of spheroid cell radii after immunohistochemical WGA staining validate the MRI results, we conducted two-sided t-tests between the IMPULSED-derived radii and the radii measured after WGA staining for each cell line. Cell radii of longitudinal in vivo data were evaluated by one-way analyses of variance (ANOVAs) with Tukey’s post hoc tests or Kruskal-Wallis tests (depending on p values of previous Shapiro-Wilk test). Additionally, Spearman rank correlation coefficients between cell radii and day of tumor growth were calculated to compare longitudinal changes in cell radii obtained in vivo by OGSE-DWI with radii obtained ex vivo after WGA staining. Cell radii of therapy groups (ICI, clodronate-loaded liposomes) were compared with control groups using two-sided t-tests or Mann-Whitney U tests (depending on p values of previous Shapiro-Wilk test). Statistics were calculated using GraphPad Prism (V.9.2.0, GraphPad Software, San Diego, California, USA) and SAS (V.9.4, Copyright SAS Institute). Descriptive statistics, p values, t values, and df for t-tests, Z-scores for Mann-Whitney U tests and F values and df for ANOVAs are provided in online supplemental tables 2–7.
Results
In vitro spheroid experiments
The capability of sine-OGSE-DWI and IMPULSED analysis for a cell size-dependent discrimination between cancer cells and immune cells in vitro was assessed using spheroids, consisting exclusively of either 4T1 or 67NR breast cancer cells, macrophages, or T-cells (online supplemental figure 1a).
Successful spheroid formation was confirmed by light microscopy (figure 1A). While 4T1, 67NR, and macrophage spheroids showed diameters of approximately 400 µm, T-cell spheroids were overall smaller with a maximum diameter of 200 µm. All spheroids showed similar cell packing and density. Embedded in agarose gel, spheroids were identified as hyperintense spots in T2-weighted and diffusion-weighted MR images (figure 1B–D). Average cell radii of spheroids were calculated from sine-OGSE-DWI using the IMPULSED method. Cell radii from 4T1 and 67NR spheroids showed no significant difference (p=0.38) with a mean cell radius of 8.8±1.3 µm for 4T1 cancer cells and 8.2±1.4 µm for 67NR cancer cells. Cell radii between cancer cell and immune cell spheroids differed significantly, with 13.0±1.7 µm for macrophages (p<0.0001) and 3.8±1.8 µm for T-cells (p<0.0001). Ex vivo measurements of cell radii were performed after immunohistochemical WGA staining of cell membranes, resulting in mean cell radii of 9.2±1.5 µm for 4T1 cancer cells, 8.7±1.6 µm for 67NR cancer cells (p=0.53), 13.5±1.9 µm for macrophages (p=0.004), and 2.6±1.3 µm for T-cells (p<0.0001) (figure 1E). These ex vivo results matched the in vivo IMPULSED-derived cell radii, without any significant differences between MRI and WGA for each cell line.
In vivo longitudinal studies
Since our approach was able to differentiate between cancer cells, T-cells, and macrophages in the in vitro spheroid experiments, we investigated whether OGSE-DWI was capable of in vivo imaging of the intratumoral immune cell infiltrate and its dynamic changes during tumor progression, comparing the results of two murine breast cancer models with different degrees of malignancy (4T1: highly malignant, metastatic, 67NR: low malignant, non-metastatic) (online supplemental figure 1b).
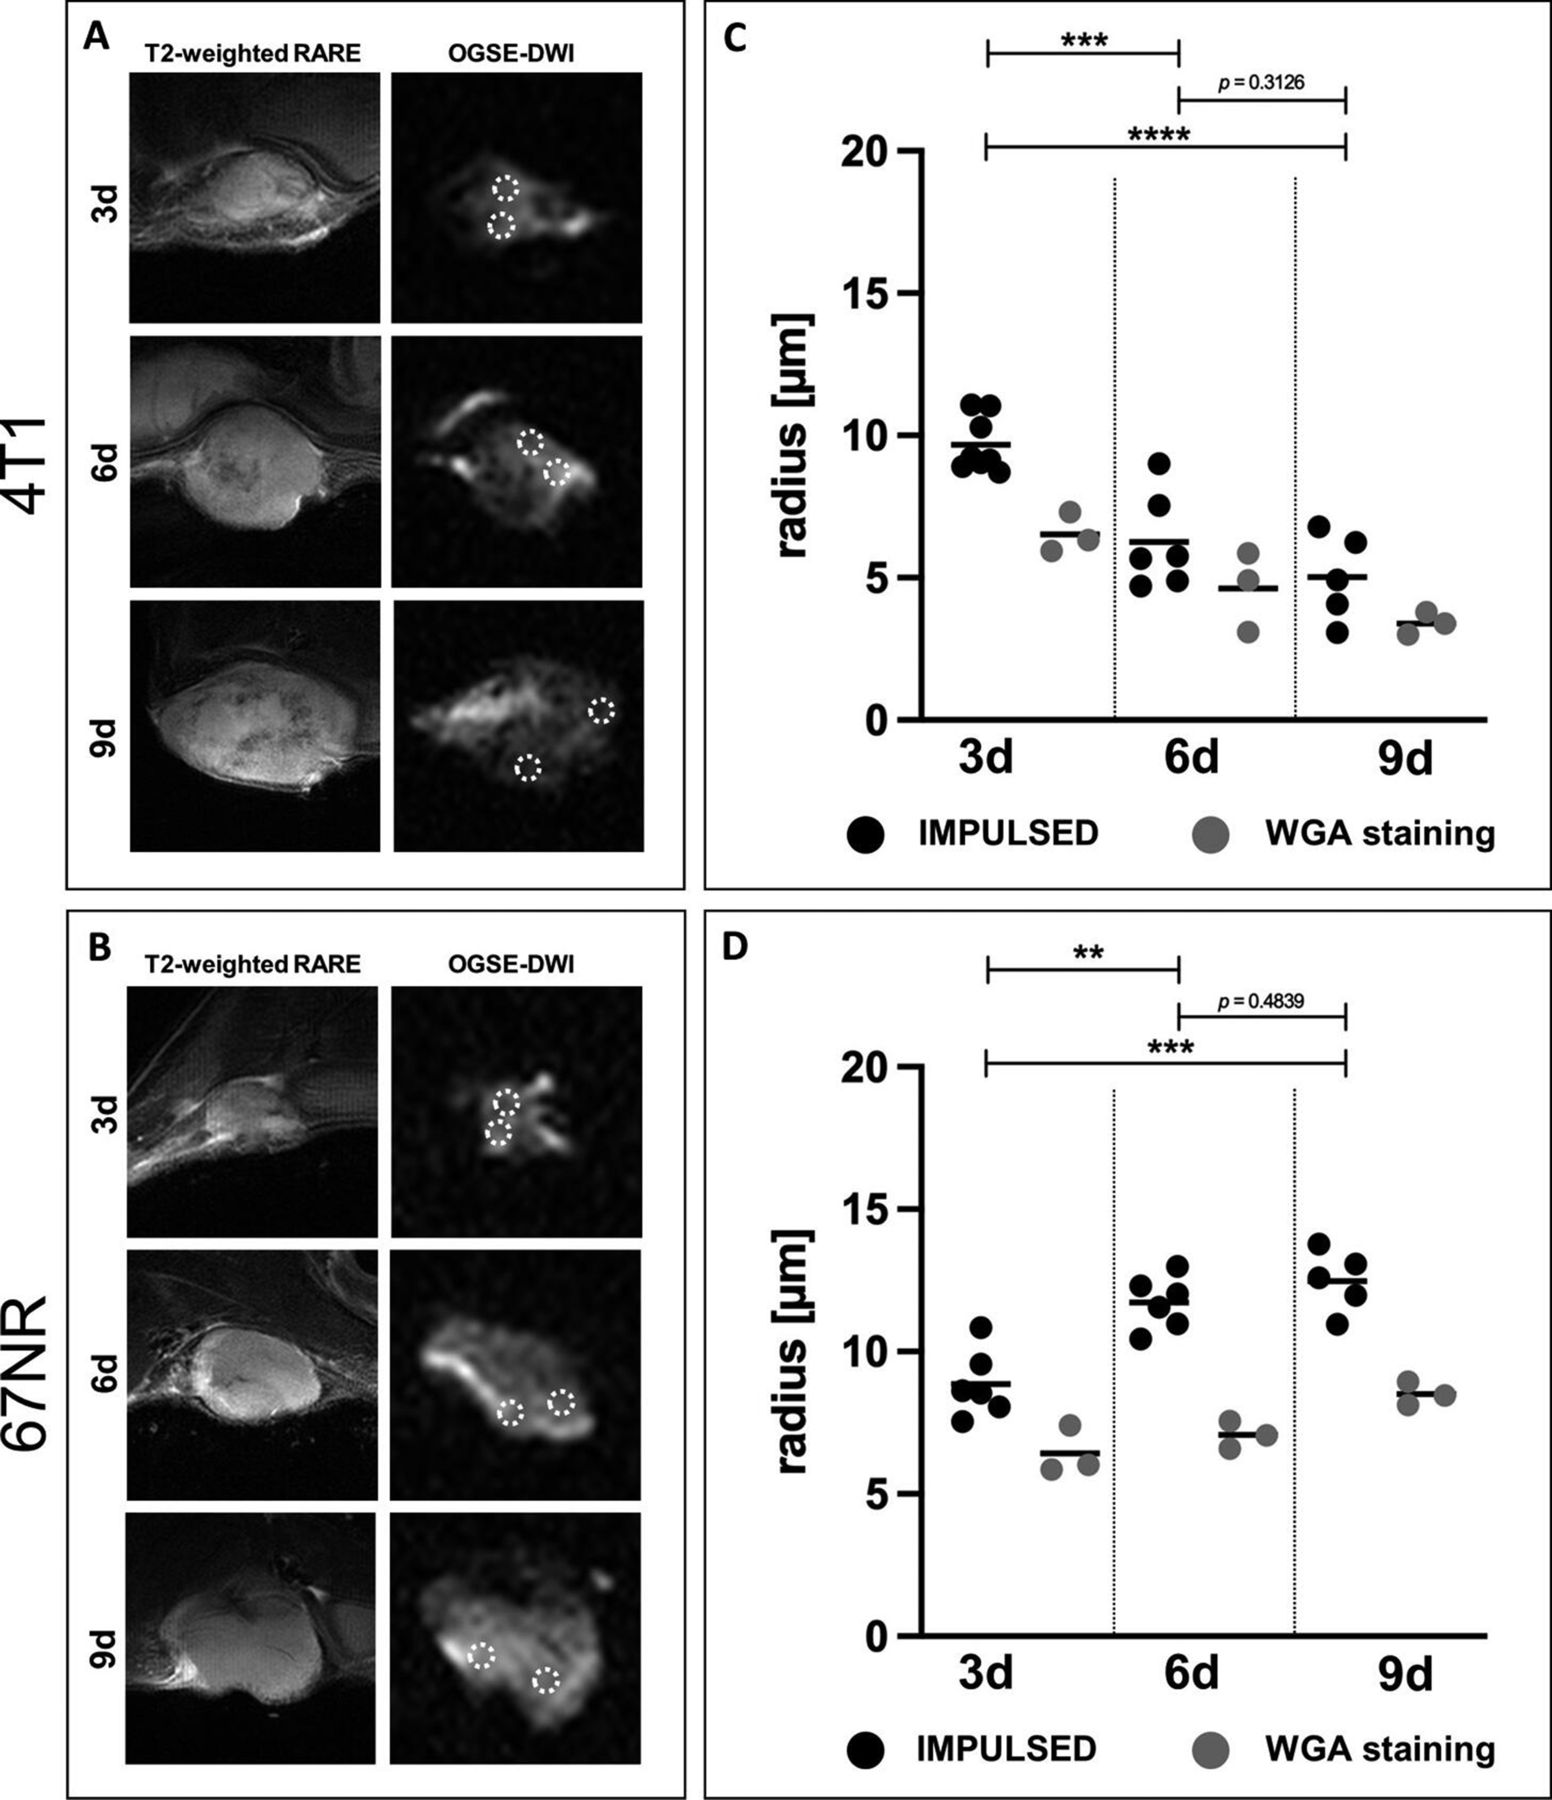
Multislice T2-weighted imaging confirmed increasing tumor volumes in both tumor models, with 4T1 tumors growing faster than 67NR tumors.31 During progression, especially 4T1 tumors developed central areas of necrosis and hemorrhage, surrounded by a viable tumor border. Such necrotic cores were much less pronounced in 67NR tumors (figure 2A,B). Subsequent in vivo assessment of cell sizes was therefore performed in the viable tumor border.

Capability of OGSE-DWI to monitor immune cell infiltrate during tumor progression. (A) T2-weighted and diffusion-weighted MR images (b=0.125 ms/µm2, fOGSE=80 Hz) of 4T1 tumors on day three, six, and nine. During progression, tumor volume increased and tumors exhibited central necrotic and hemorrhagic areas, identified as hypointense areas in the tumor center. ROIs for IMPULSED-based cell size analysis are indicated with dashed white circles. (B) T2-weighted and diffusion-weighted MR images (b=0.125 ms/µm2, fOGSE=80 Hz) of 67NR tumors on day three, six, and nine. During progression, tumor volume increased with only minor signs of necrosis, but generally homogeneous appearance. ROIs for IMPULSED-based cell size analysis are indicated with dashed white circles. (C) Mean IMPULSED-derived cell radii (black) decreased during progression of 4T1 tumors. WGA staining of cell membranes (gray) displayed similar trends. (D) Mean IMPULSED-derived cell radii (black) increased during progression of 67NR tumors. WGA staining of cell membranes (gray) displayed similar trends. Statistical significance was determined by one-way ANOVAs with Tukey’s post hoc analysis or Kruskal-Wallis test, depending on normal distribution of data (**p<0.01, ***p<0.001, ****p<0.0001). Each dot indicates mean cell radius of one tumor. Horizontal lines represent group means. ANOVAs, one-way analyses of variance; IMPULSED, Imaging Microstructural Parameters Using Limited Spectrally Edited Diffusion; OGSE-DWI, oscillating-gradient diffusion-weighted MRI; ROI, region of interest; WGA, wheat germ agglutinin.
Longitudinal analysis of OGSE-DWI data during tumor progression revealed a 50% decrease in mean cell radii of 4T1 tumors over time, declining from 9.7±1.0 µm on day three, to 6.3±1.7 µm on day six (p=0.0008), and 5.0±1.5 µm on day nine (p<0.0001). 67NR tumors instead showed a 55% increase in mean cell radii with 8.9±1.2 µm on day three, 11.7±0.9 µm on day six (p=0.001), and 12.5±1.1 µm on day nine (p=0.0002). In line with this, ex vivo measurements of mean cell radii after unspecific WGA staining revealed decreasing cell radii of 6.5±0.7, 4.6±1.4, and 3.4±0.4 µm on days three, six, and nine in 4T1 tumors (p=0.1 for day six, p=0.02 for day nine), and increasing cell radii of 6.4±0.9, 7.1±0.5, and 8.5±0.4 µm were found during progression of 67NR tumors (p=0.46 for day six, p=0.01 for day nine) (figure 2C,D). Spearman correlation analysis of days of tumor progression (3, 6, 9 days) and cell radii displayed similar trends between in vivo OGSE-DWI and ex vivo WGA staining in 4T1 (OGSE-DWI: ρ=−0.81, p<0.0001, WGA staining: ρ=−0.84, p=0.004) and 67NR tumors (OGSE-DWI: ρ=0.8, p=0.0001, WGA staining: ρ=0.84, p=0.004). Cancer cells showed no substantial differences in size during tumor progression with differences in mean cell radii of no more than 5% (online supplemental figure 9). Thus, changes in cancer cell size can be excluded as a cause for changes in IMPULSED-derived cell radii.
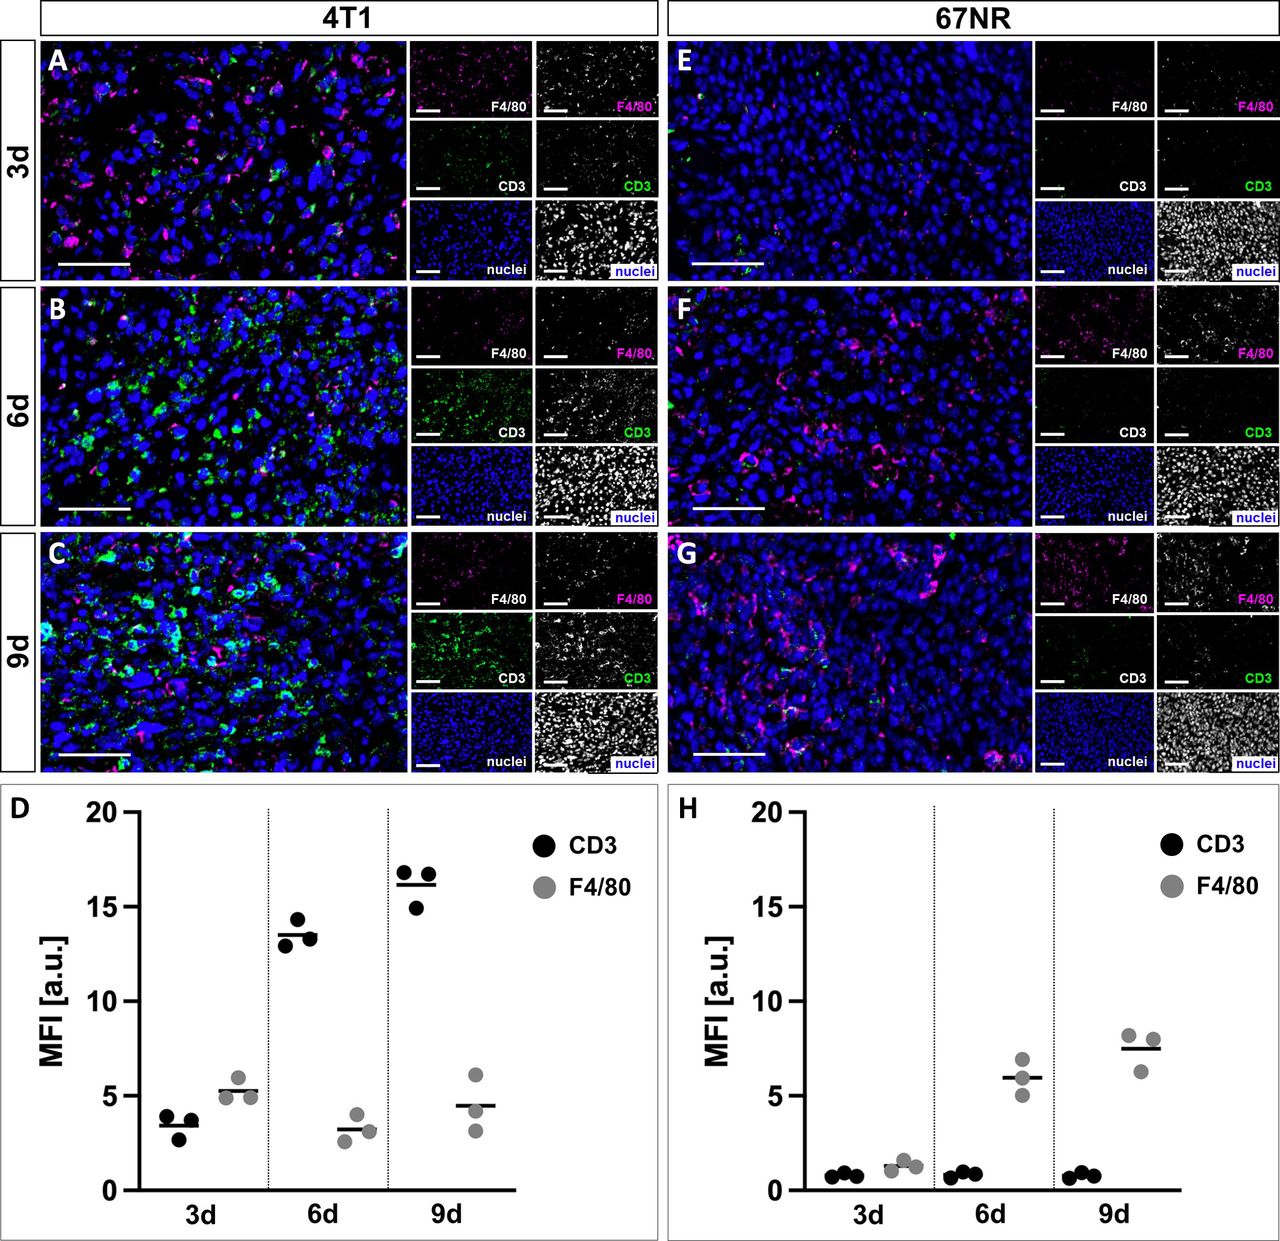
Immunohistochemical analysis and MFI of intratumoral CD3 and F4/80 expression showed higher immune cell content in highly malignant 4T1 tumors compared with low malignant 67NR tumors at each respective time point. 4T1 tumors were characterized by an approximately balanced ratio of CD3+ T-cells and F4/80+ macrophages on day three (MFICD3=3.4 ± 0.7 a.u. and MFIF4/80=5.3 ± 0.6 a.u.). During further disease progression, the share of T-cells increased, as became evident on day six (MFICD3=13.5 ± 0.7 a.u., p=0.05) and day nine (MFICD3=16.2 ± 1.1 a.u., p=0.02), given constant values for MFIF4/80 (figure 3A–D). 67NR tumors showed comparatively lower immune cell infiltration on day three (MFICD3=0.8 ± 0.1 a.u. and MFIF4/80=1.3 ± 0.3 a.u.), with increasing content of macrophages on day six (MFIF4/80=6.0 ± 1.0 a.u., p=0.001) and day nine (MFIF4/80=7.5 ± 1.1 a.u., p=0.0002), while the number of T-cells remained low (6d: MFICD3=0.8 ± 0.2 a.u., 9d: MFICD3=0.8 ± 0.2 a.u.) (figure 3E–H). During progression of both tumor models, no substantial changes in intratumoral granulocytes, natural killer cells or B-cells were observed (online supplemental figure 10).

Immunohistochemical analysis of the immune cell infiltrate during tumor progression. (A–C) Representative 4T1 tumor sections after 3-channel stainings of nuclei (blue), F4/80 (violet, macrophages), and CD3 (green, T-cells) with correlating merged images. (D) Mean fluorescence intensity (MFI) of immunohistochemical CD3 and F4/80 expression in 4T1 tumors showed a balanced ratio of macrophages and T-cells on day three, with increasing share of T-cells on day six and day nine. (E–G) Representative 67NR tumor sections after 3-channel stainings of nuclei (blue), F4/80 (violet, macrophages), and CD3 (green, T-cells) with correlating merged images. (H) MFI of immunohistochemical CD3 and F4/80 expression in 67NR tumors revealed overall lower immune cell content compared with 4T1 tumors. During progression, the content of macrophages increased, while the amount of T-cells remained consistently low. Scale bars represent 50 µm. Each dot indicates mean MFI of one tumor. Horizontal lines represent group means.
In vivo assessment of clodronate liposome-mediated macrophage depletion
To confirm that the observed increasing mean cell radii were due to infiltrating macrophages, the immune cell infiltrate was modulated by clodronate liposome-mediated depletion of macrophages. OGSE-DWI and IMPULSED-derived cell size analysis were expected to yield lower mean cell sizes after specific depletion of macrophages in 4T1 tumors treated with clodronate-loaded liposomes for 6 days.
Treatment with clodronate-loaded liposomes had no signicifacnt influence on the volume of 4T1 tumors (54.4±18.1 mm3 vs 46.9±12,7 mm3 of the control group, p=0.22). IMPULSED-derived cell radii decreased significantly (p=0.02) after clodronate liposome treatment to a mean cell radius of 4.4±0.5 µm compared with 6.3±1.7 µm of the control group (figure 4). Ex vivo immunohistochemical analysis of F4/80 expression confirmed successful depletion of macrophages (MFIF4/80=0.6 ± 0.2 a.u. vs 3.2±0.7 a.u. of untreated controls, p=0.004) along with a constant number of T-cells (MFICD3=13.2 ± 1.3 a.u. vs 13.5±0.7 a.u. of untreated controls) (figure 5), and also WGA staining of cell membranes showed decreasing averaged cell radii after treatment (3.1±0.1 µm vs 4.6±1.4 µm of the control group, p=0.05) (figure 4).
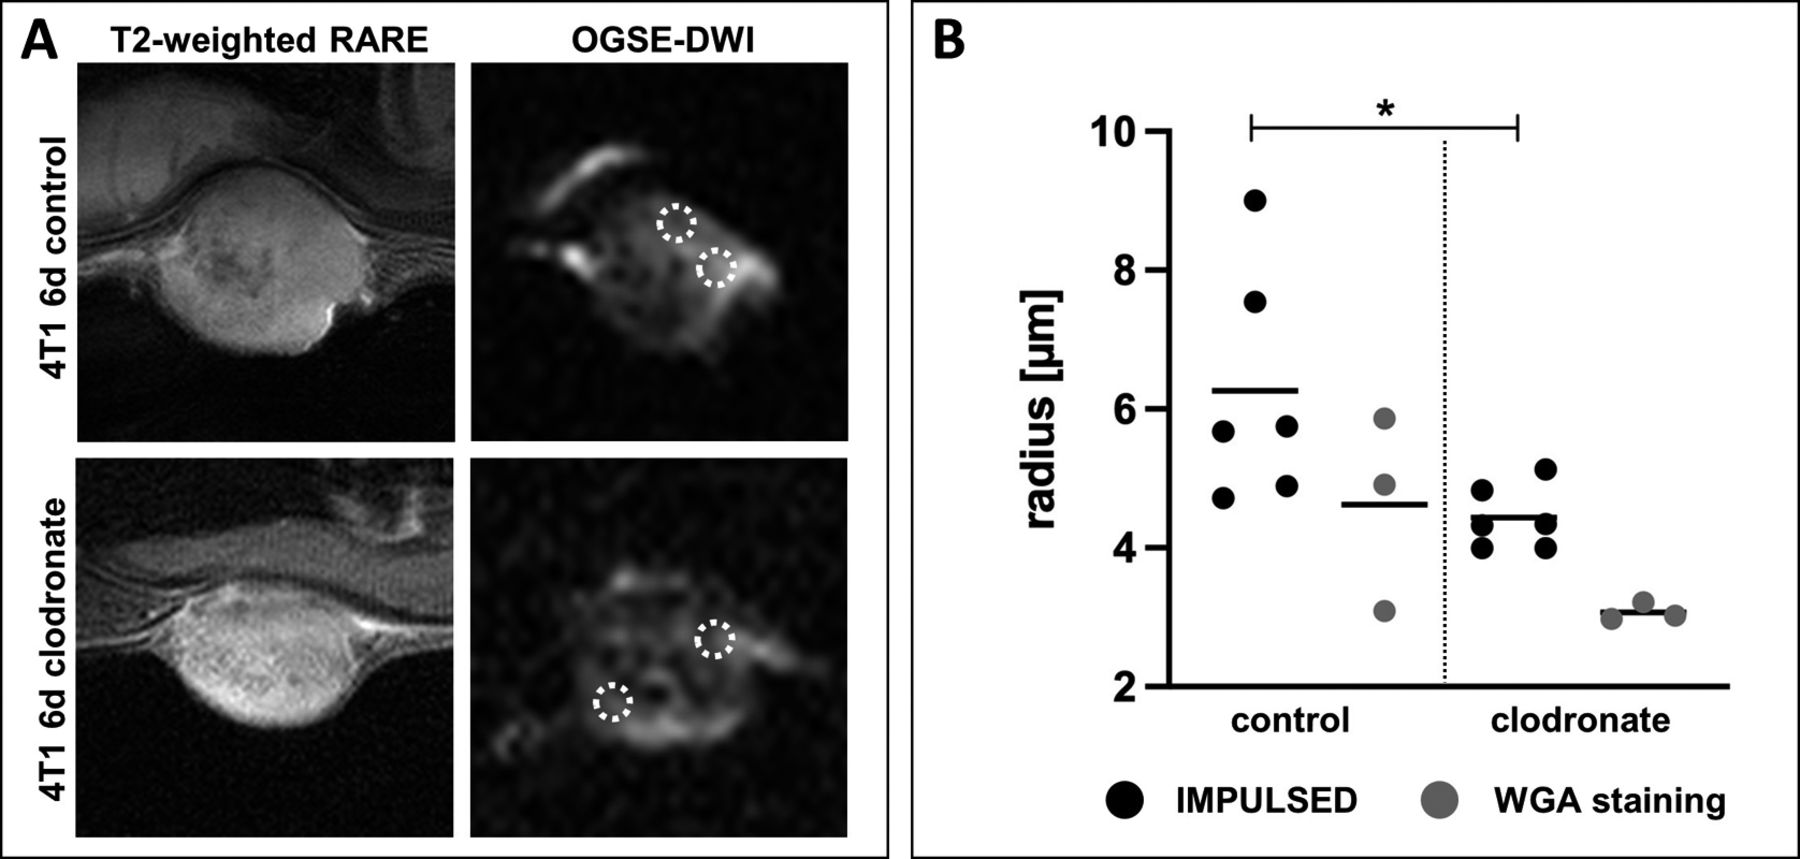
OGSE-DWI is capable of detecting clodronate liposome-mediated depletion of macrophages. (A) T2-weighted and diffusion-weighted MR images (b=0.125 ms/µm2, fOGSE=80 Hz) of 4T1 tumors after 6 days of clodronate liposome treatment compared with untreated controls. ROIs for IMPULSED-based cell size analysis are indicated with dashed white circles. (B) IMPULSED-derived cell radii (black) were significantly lower after treatment. Immunohistochemical WGA staining of cell membranes (gray) displayed a similar trend. Statistical significance was determined by Mann-Whitney U test (*p<0.05). Each dot indicates mean cell radius of one tumor. Horizontal lines represent group means. IMPULSED, Imaging Microstructural Parameters Using Limited Spectrally Edited Diffusion; OGSE-DWI, oscillating-gradient diffusion-weighted MRI; ROI, region of interest; WGA, wheat germ agglutinin.
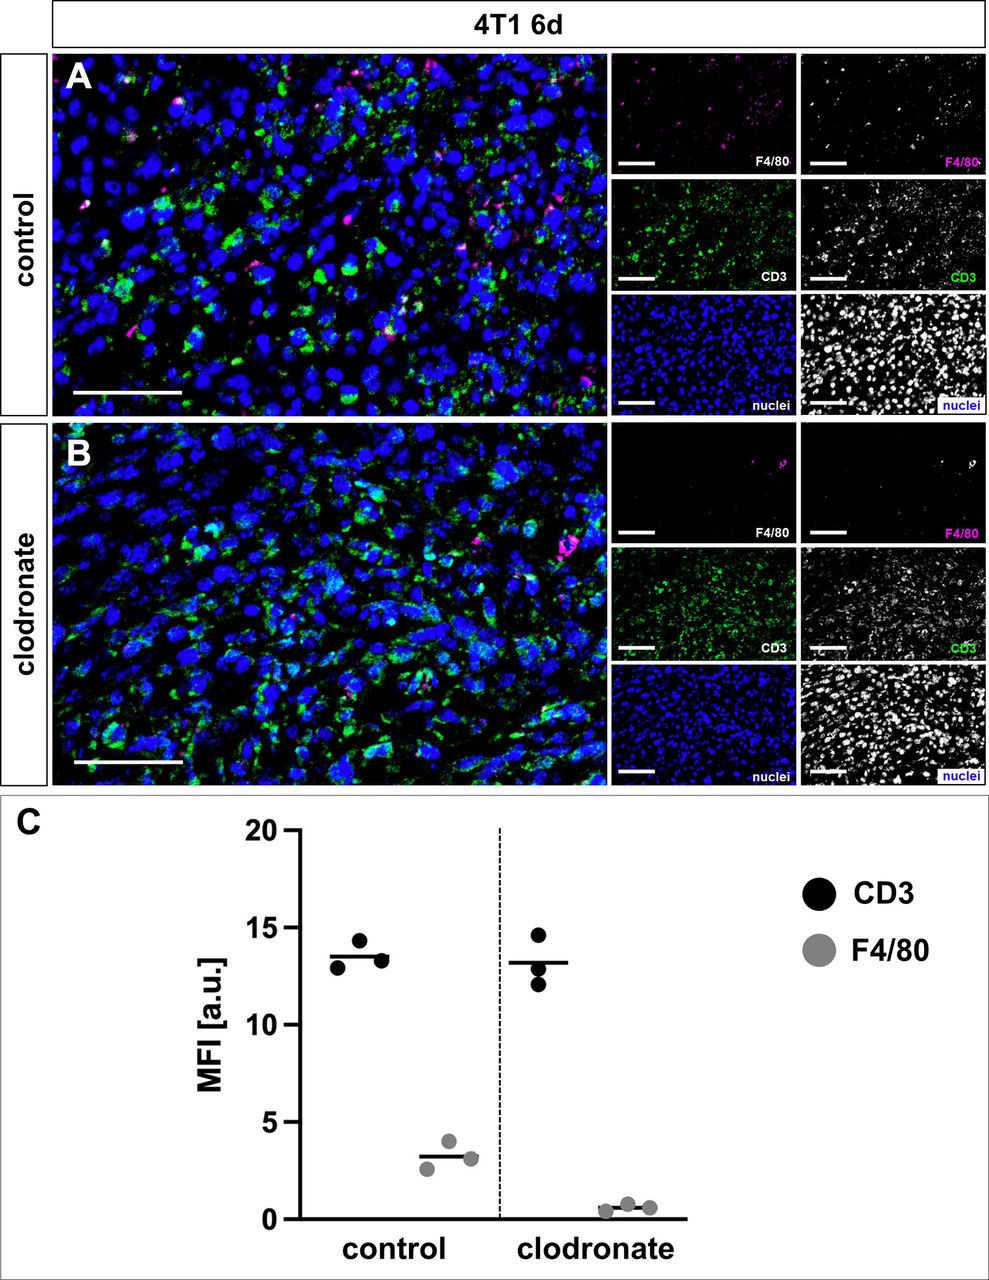
Immunohistochemical analysis of clodronate liposome-mediated depletion of macrophages. (A, B) Representative clodronate liposome-treated 4T1 tumor sections compared with untreated controls after 3-channel stainings of nuclei (blue), F4/80 (violet, macrophages), and CD3 (green, T-cells) with correlating merged images. (C) Mean fluorescence intensity (MFI) of immunohistochemical CD3 and F4/80 expression revealed successful depletion of macrophages, along with an approximately constant content of T-cells after clodronate liposome treatment. Scale bars represent 50 µm. Each dot indicates mean MFI of one tumor. Horizontal lines represent group means.
In vivo treatment with ICIs
With the perspective of future clinical applications, we investigated whether OGSE-DWI enables response assessment to immunotherapies. For this purpose, 4T1 or 67NR tumor-bearing mice were treated with a combination therapy of anti-PD1 and anti-CTLA4 ICIs, comparing the changes within the TME between tumors with divergent degrees of malignancy.
Therapy response was investigated by T2-weighted MRI and OGSE-DWI (figure 6A–D). Tumor volumes of ICI-treated 4T1 tumors slightly increased with 67.35±26.61 mm3 (control group: 46.94±12.73 mm3, p=0.02) on day six and 161.42±44.82 mm3 (control group: 113.65±33.96 mm3, p=0.03) on day nine, in line with excessive necrosis and hemorrhage in the tumor center. ICI-treated 67NR tumors showed reduced tumor volumes with 12.82±1.83 mm3 compared with 18.41±4.75 mm3 of the control group (p=0.01) on day six and 19.40±10.42 mm3 compared with 50.18±13.23 mm3 of the control group (p=0.0001) on day nine, with only small areas of intratumoral necrosis.

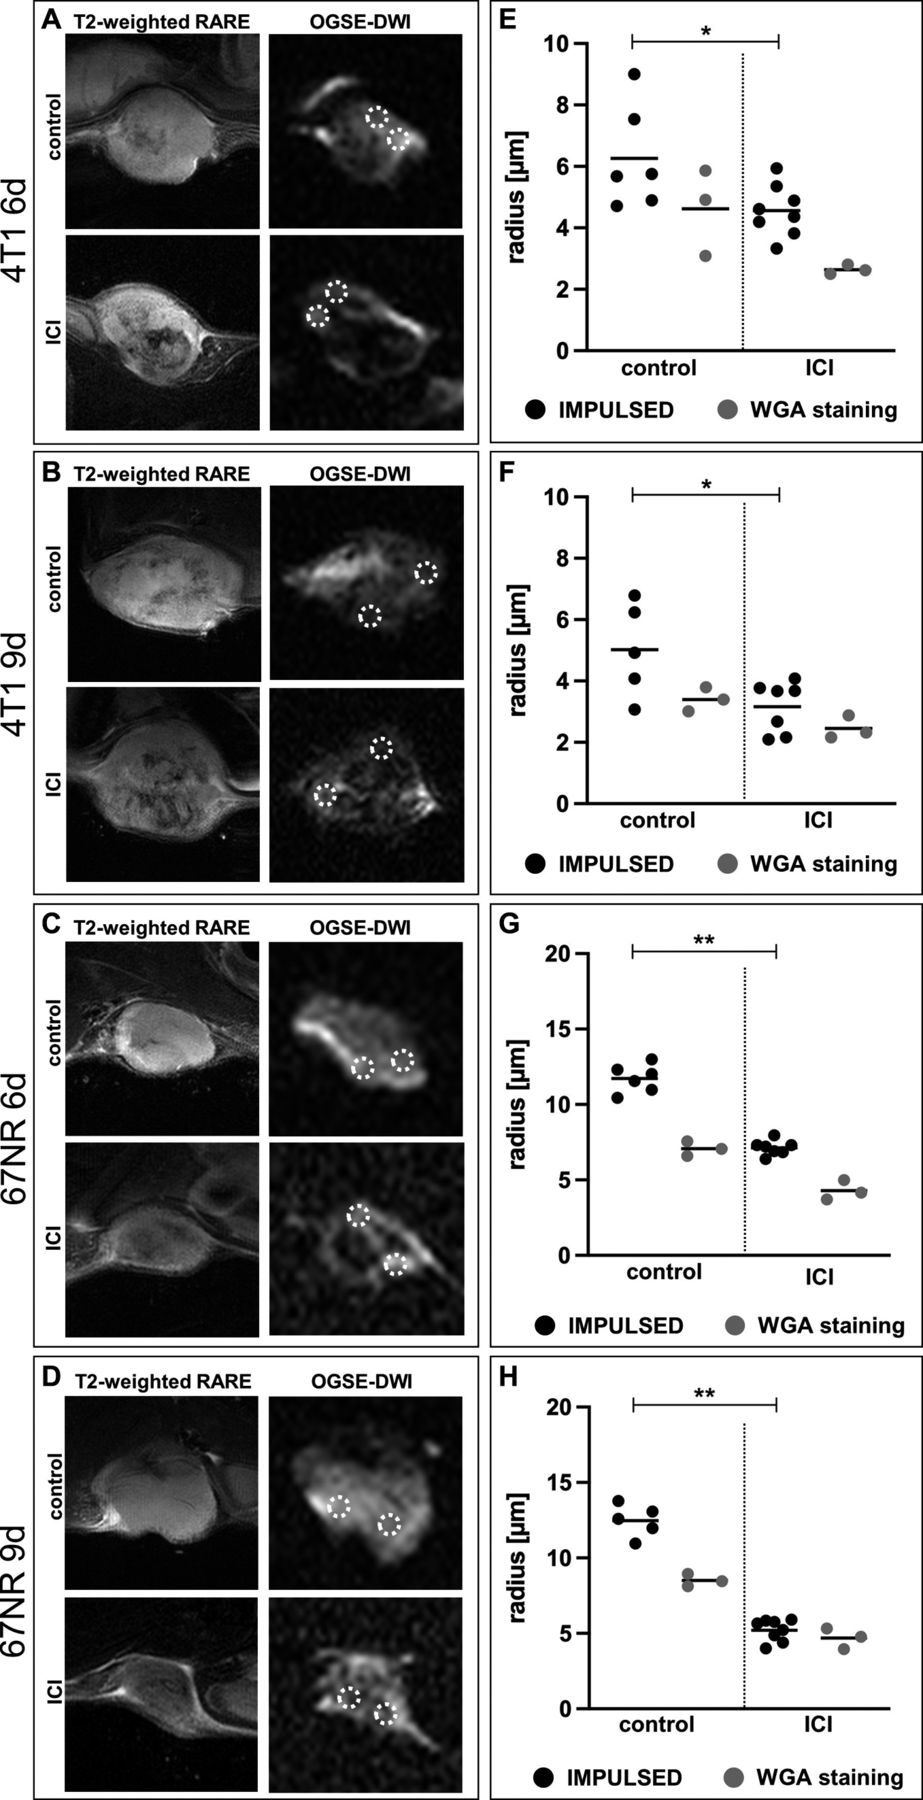
OGSE-DWI enables early response assessment to ICI treatment. (A–D) T2-weighted and diffusion-weighted MR images (b=0.125 ms/µm2, fOGSE=80 Hz) of 4T1 and 67NR tumors after ICI treatment compared with untreated controls. ICI-treated tumors exhibited increasing necrosis, especially in the 4T1 model. ROIs for IMPULSED-based cell size analysis are indicated with dashed white circles. (E–H) IMPULSED-derived cell radii (black) were significantly lower after ICI treatment in both tumor models and at all time points. Stronger reductions in mean cell size after treatment were found in 67NR tumors. Ex vivo immunohistochemical WGA staining of cell membranes (gray) validated decreasing radii after treatment, showing more pronounced effects in 67NR tumors. Statistical significance was determined by two-sided t-tests or Mann-Whitney U tests, depending on normal distribution of data (*p<0.05, **p<0.01). Each dot indicates mean cell radius of one tumor. Horizontal lines represent group means. ICI, immune checkpoint inhibitor; IMPULSED, Imaging Microstructural Parameters Using Limited Spectrally Edited Diffusion; OGSE-DWI, oscillating-gradient diffusion-weighted MRI; WGA, wheat germ agglutinin.
After treatment, both tumor models showed significantly lower IMPULSED-derived cell radii on day six (4T1: 4.6±0.8 µm vs 6.3±1.7 µm for controls, p=0.03, 67NR: 7.1±0.5 µm vs 11.7±0.9 µm for controls, p=0.003) and day nine (4T1: 3.2±0.8 µm vs 5.0±1.5 µm for controls, p=0.02, 67NR: 5.2±0.7 µm vs 12.5±1.1 µm for controls, p=0.004). The decrease was stronger for 67NR tumors (figure 6E–H). In line with this, ex vivo analysis of WGA stainings showed decreasing mean cell radii on day six (4T1: 2.6±0.2 µm vs 4.6±1.4 µm, p=0.07, 67NR: 4.3±0.6 µm vs 7.1±0.5 µm, p=0.004) and day nine (4T1: 2.5±0.4 µm vs 3.4±0.4 µm, p=0.04, 67NR: 4.7±0.7 µm vs 8.5±0.4 µm, p=0.001) for both tumor models (figure 6E–H).
Cancer cells showed no substantial differences in size after ICI treatment (online supplemental figure 9); thus, changes in cancer cell size can be excluded as a cause for changes in IMPULSED-derived cell radii.
Immunohistochemical analysis revealed an increasing content of T-cells after ICI treatment in both tumor models on day six (4T1: MFICD3=22.7 ± 2.2 a.u. vs 13.5±0.7 a.u. of untreated controls, p=0.003; 67NR: MFICD3=15.3 ± 1.6 a.u. vs 0.8±0.2 a.u. of untreated controls, p=0.08) and day nine (4T1: MFICD3=31.1 ± 4.7 a.u. vs 16.2±1.1 a.u. of untreated controls, p=0.006; 67NR: MFICD3=24.7 ± 2.8 a.u. vs 0.8±0.2 a.u. of untreated controls, p=0.08), again with more pronounced effects in 67NR tumors (figure 7). Beyond T-cells and macrophages, no substantial changes in intratumoral granulocytes, natural killer cells or B-cells were observed after ICI treatment in both tumor models (online supplemental figure 10).

Immunohistochemical analysis of the intratumoral immune cell infiltrate after ICI treatment. (A–D) Representative ICI-treated 4T1 tumor sections compared with untreated controls after 3-channel stainings of nuclei (blue), F4/80 (violet, macrophages), and CD3 (green, T-cells) with correlating merged images. (E) Mean fluorescence intensity (MFI) of immunohistochemical CD3 and F4/80 expression in ICI-treated 4T1 tumors showed increasing intratumoral content of T-cells with slightly increasing content of macrophages on day six and day nine. (F–I) Representative ICI-treated 67NR tumor sections compared with untreated controls after 3-channel stainings of nuclei (blue), F4/80 (violet, macrophages), and CD3 (green, T-cells) with correlating merged images. (J) Mean fluorescence intensity (MFI) of immunohistochemical CD3 and F4/80 expression in ICI-treated 67NR tumors showed excessive increase of intratumoral content of T-cells with slightly increasing content of macrophages on day six and day nine. Scale bars represent 50 µm. Each dot indicates mean MFI of one tumor. Horizontal lines represent group means. ICI, immune checkpoint inhibitor.
Discussion
This study highlights the capability of non-invasive diffusion-weighted MRI to allow for distinct insights into the intratumoral immune cell infiltrate, by attributing changes and differences in mean cell sizes to the intratumoral T-cell and macrophage content. We have successfully applied sine-shaped OGSE-DWI to distinguish different cellular compositions of the TME, evaluating the effects of tumor progression, macrophage depletion, and ICI treatment on averaged cell sizes in murine breast cancer models with different degrees of malignancy.
The presented OGSE-DWI analysis was able to distinguish between cancer cells, T-cells, and macrophages using in vitro spheroid models of pure cells, detecting significantly smaller cell radii of T-cells and significantly larger cell radii of macrophages, compared with both cancer cell lines. The in vitro IMPULSED-derived radii were confirmed by WGA staining of cell membranes and are in line with those obtained previously by light microscopy.21 22 This wide range of detectable cells was enabled by implementation of sine-shaped diffusion gradient modulations. Without losing sensitivity for small cells, for example, T-cells, sine-shaped OGSE-DWI additionally allows detection of larger cells, including macrophages. Compared with other studies that used cosine-shaped gradient modulations and focused on the in vivo detection of small T-cells,24 our approach expands the analysis to macrophages, which enables a more comprehensive picture of the inflammatory TME. Despite not being able to make fully quantitative statements about the immune cell proportions, changes in mean IMPULSED-derived in vivo cell radii are attributable to either T-cell or macrophage infiltration into the TME. As OGSE-DWI can detect these changes in the immune cell infiltrate non-invasively, it provides a versatile tool for longitudinal in vivo assessment of disease progression and response to immunotherapies.
4T1 tumors showed decreasing IMPULSED-derived cell radii, which reflected the increasing proportion of T-cells during tumor progression. In contrast, 67NR tumors were characterized by an increasing number of macrophages during tumor progression with only minor influx of T-cells, which led to an increase in mean cell radii as assessed via the IMPULSED model. Thus, the presented imaging approach allowed for in vivo detection and discrimination of different inflammatory environments between tumors with divergent degrees of malignancy.
Clodronate-loaded liposomes cause a depletion of macrophages,32 here validated by strongly reduced MFI of F4/80 along with unaffected MFI of CD3. This modulation of intratumoral myeloid cells was captured by decreasing IMPULSED-derived cell radii, also detectable by WGA staining. Thus, we demonstrated that OGSE-DWI is capable of detecting specific modulation of the intratumoral immune cell infiltrate, a prerequisite for assessing possible intratumoral changes under therapy.
ICI treatment, clinically established for the therapy of various solid tumors,33 was monitored 3 and 6 days after treatment initiation. In line with a previous study,24 OGSE-DWI was able to detect decreasing mean cell radii, also displayed by WGA staining, and attributable to the therapy-induced infiltration of T-cells, captured in immunohistochemical analysis. The effect of infiltrating T-cells on mean cell radii was more pronounced in 67NR tumors with an inherently low number of T-cells, compared with highly malignant 4T1 tumors. Thus, the presented imaging approach could not only show T-cell infiltration per se, but was also able to highlight differences between both tumor models.
The increased proportion of infiltrating T-cells into 67NR tumors after ICI treatment may be a result of higher PD-1 expression of 67NR tumors compared with 4T1 tumors.34
Using the IMPULSED model, Jiang et al24 were able to detect T-cell infiltration after ICI therapy for the first time as proof-of-principle in a colorectal carcinoma model. In that study, decreasing IMPULSED-derived cell radii were detected only when the entire tumor volume was already slightly reduced compared with control groups. However, especially response assessment of tumors that do not initially decrease in size is urgently needed.35 36 In our study, ICI-treated 4T1 tumors exhibited excessive tumor necrosis and hemorrhage in their center with initially increasing tumor volumes, similar to the immunotherapy-induced findings frequently observed in the clinics. By assessing therapy-induced T-cell infiltration already 3 days after treatment initiation, OGSE-DWI allowed for early detection of response to immune checkpoint blockade, while tumor volumetry failed to indicate early treatment response. Thus, as response assessment of immunotherapies is becoming increasingly challenging and is not adequately assessable with conventional morphological and volumetric analyses of tumor lesions,35 IMPULSED-derived changes in mean cell radii may serve as a future surrogate marker for treatment response. Potentially, OGSE-DWI could be used to distinguish pseudoprogression from true progression in the future.
While other imaging techniques need specific cell labeling to distinguish the infiltrating immune cell subtypes, OGSE-DWI is able to distinguish between different immune cell infiltrates—here, macrophages or T-cells—due to their sufficiently large size differences using only one single setup without the need of specific cell labeling. Cell labeling efficacy shows significant interindividual differences with heterogeneous uptake of labeling agents and spatially different label concentrations, often precluding precise cell tracking.37 As cell labeling might furthermore influence metabolism, proliferation, and migration of cells,38 39 OGSE-DWI’s non-invasive characteristics allow for a more consistent analysis of specific cell populations with different cell sizes, increasing its potential to be translated to clinical studies.
Despite the presented accuracy for detecting changes in the intratumoral immune cell infiltrate, OGSE-DWI is currently limited in some aspects by specificity, sensitivity, and hardware. In contrast to cell labeling techniques, OGSE-DWI is not able to distinguish between different subsets of macrophages or T-cells, for example, CD4+ or CD8+ T-cells, and therefore lacks cell specificity. Furthermore, a balanced increase of T-cells and macrophages is currently not detectable with OGSE-DWI, since it would not significantly affect the mean cell radius. Therefore, simultaneous monitoring of both individual immune cell populations is not possible. Even though recent studies of the intratumoral immune cell composition underline the roles of T-cells and macrophages as main players of the TME,1 2 in line with the immunohistochemical analysis obtained in this study, natural killer cells or granulocytes take up a smaller but still relevant part of the immune cell infiltrate.40 41 The cell sizes of natural killer cells and granulocytes do not sufficiently differ from cancer cells,39 42 so infiltration of similarly sized immune cell types can currently not be investigated using OGSE-DWI. Because of relevant interindividual tumor heterogeneity, OGSE-DWI applied as one measurement at a single time point does not allow for meaningful conclusions about the TME, but changes between two time points (eg, before and after therapy initiation) can be observed. IMPULSED-derived cell radii were compared with ex vivo cell radii measured after immunohistochemical WGA staining. Cell radii were generally lower in ex vivo measurements compared with in vivo imaging. This is most likely caused by cell shrinkage after paraffin-embedding of the tumors and the fact that the tissue slices for histological staining do not always pass through the center of the cells, leading to an underestimation of cell size.17 43 Consequently, the cell sizes measured in vivo can not be directly assessed by ex vivo analysis, still, ex vivo cell radii displayed similar trends as IMPULSED-derived cell radii. Changes in IMPULSED-derived cell radii were attributed to changes in the immune cell infiltrate, however, without being able to make quantitative statements. Next to these uncertainties in the ex vivo analysis, also the in vivo method might face some inaccuracies. Using a single-slice approach for OGSE-DWI may have caused a possible loss of information on slice-adjacent tumor areas. However, slices were placed across the largest tumor diameter determined from multislice T2-weighted imaging, suggesting representative tumor areas. Since pixel-wise analysis is often accompanied by low signal-to-noise ratios (SNR); here, OGSE-DWI data were analyzed using an ROI-based approach to improve SNR and stabilize the fitting procedure. ROIs were placed in the viable tumor border to exclude central necrotic and hemorrhagic areas. As these central areas are characterized by dissolving cell structures and thus a weakly defined diffusion regime,44 the assumptions of the IMPULSED model are no longer fulfilled,13 17 45 precluding precise determination of cell sizes in these areas. However, also within the viable tumor border the assumptions of the IMPULSED model are not perfectly fulfilled: In vivo cells, especially macrophages with their branches and pseudopod extensions, deviate from spherical shape and exchange between intracellular and extracellular space cannot be excluded. The latter aspect has been considered in recent modeling, but had only minor impact on cell radius calculation.46 We therefore consider water exchange negligible in agreement with other previous studies.17 24 Recently, also deep learning-based methods have been applied for DWI-based biophysical modeling,47 which may further improve accuracy of IMPULSED-derived microstructural parameters, combined with highly reduced computation time.48
Difficulties of translation to human studies have already been discussed by Jiang et al,24 mainly revolving around hardware limitations with lower gradient strengths of clinical MR scanners compared with small animal MRI setups. However, Xu et al introduced a clinically feasible IMPULSED approach with modified gradient waveforms.23 In combination with the availability of advanced gradient systems, the presented ROI-based approach for analyzing OGSE-DWI data may improve translation to clinical studies, because higher SNR and exclusion of necrotic tumor areas improve the precision of cell size measurements.
In conclusion, we demonstrate that OGSE-DWI enables non-invasive monitoring of disease progression and response to immunotherapies. Beyond previously published techniques, this approach allows for detection of various immune cell populations of different size, allowing to discriminate lymphocytes from myeloid cells. Alteration of cellular compositions manifest in changes in IMPULSED-derived mean cell radii, which are attributable to the infiltration of T-cells or macrophages into the TME.
Supplemental material
Data availability statement
Data are available upon reasonable request. The datasets generated during and/or analyzed during the current study are available from the corresponding author on reasonable request.
Ethics statements
Patient consent for publication
Ethics approval
Not applicable.
Acknowledgments
We thank Claudia Terwesten-Solé, Alletta Schmidt-Hederich, Florian Breuer, Klaudia Niepagenkemper, and Richard Holtmeier for excellent technical support.
References
Supplementary materials
Supplementary Data
This web only file has been produced by the BMJ Publishing Group from an electronic file supplied by the author(s) and has not been edited for content.
Footnotes
Twitter @CorneliusFaber
EH and MG contributed equally.
Contributors MW and CF conceived the original idea of the study. EH, MG, MW,
and CF contributed to the conception and design of the study. EH, MG, RN, and BM conducted MRI experiments. SN, JAE, PB, and TV carried out spheroid formation. CG optimized animal handling. SN performed immunohistochemical stainings and microscopy. RN, LW, EW, VH, BM, and CF developed software for IMPULSED analysis. EH and RN performed data analysis. EH, MG, MM, CH, BM, AH, and MW contributed to data interpretation. EH and RS performed statistical analysis. WLH, AH, MW, and CF supervised the study. EH, BM, MW, and CF wrote the initial manuscript. EH is acting as guarantor. All authors contributed to reviewing and editing the manuscript. EH and MG are joint first authors.
Funding This study was supported by the German Research Foundation (DFG, GE 3336/1-1, grant no. 446302350; SFB1009-A09, -B08, and -Z02, grant no. 194468054), the Interdisciplinary Center for Clinical Research Münster (PIX), and the Medical Faculty of the University of Münster (MedK fellowship to EH).
Competing interests None declared.
Provenance and peer review Not commissioned; externally peer reviewed.
Supplemental material This content has been supplied by the author(s). It has not been vetted by BMJ Publishing Group Limited (BMJ) and may not have been peer-reviewed. Any opinions or recommendations discussed are solely those of the author(s) and are not endorsed by BMJ. BMJ disclaims all liability and responsibility arising from any reliance placed on the content. Where the content includes any translated material, BMJ does not warrant the accuracy and reliability of the translations (including but not limited to local regulations, clinical guidelines, terminology, drug names and drug dosages), and is not responsible for any error and/or omissions arising from translation and adaptation or otherwise.