Article Text

Abstract
The majority of patients with recurrent/metastatic squamous cell carcinoma of the head and neck (HNSCC) (R/M) do not benefit from anti-PD-1 therapy. Hypoxia induced immunosuppression may be a barrier to immunotherapy. Therefore, we examined the metabolic effect of anti-PD-1 therapy in a murine MEER HNSCC model as well as intratumoral hypoxia in R/M patients. In order to characterize the tumor microenvironment in PD-1 resistance, a MEER cell line was created from the parental line that are completely resistant to anti-PD-1. These cell lines were then metabolically profiled using seahorse technology and injected into C57/BL6 mice. After tumor growth, mice were pulsed with pimonidazole and immunofluorescent imaging was performed to analyze hypoxia and T cell infiltration. To validate the preclinical results, we analyzed tissues from R/M patients (n=36) treated with anti-PD-1 mAb, via immunofluorescent imaging for number of CD8+ T cells (CD8), Tregs and the percent area (CAIX) and mean intensity (I) of carbonic anhydrase IX in tumor. We analyzed disease control rate (DCR), progression free survival (PFS), and overall survival (OS) using proportional odds and proportional hazards (Cox) regression. We found that anti-PD-1 resistant MEER has significantly higher oxidative metabolism, while there was no difference in glycolytic metabolism. Intratumoral hypoxia was significantly increased and CD8+ T cells decreased in anti-PD-1 resistant tumors compared with parental tumors in the same mouse. In R/M patients, lower tumor hypoxia by CAIX/I was significantly associated with DCR (p=0.007), PFS, and OS, and independently associated with response (p=0.028) and PFS (p=0.04) in a multivariate model including other significant immune factors. During PD-1 resistance, tumor cells developed increased oxidative metabolism leading to increased intratumoral hypoxia and a decrease in CD8+ T cells. Lower tumor hypoxia was independently associated with increased efficacy of anti-PD-1 therapy in patients with R/M HNSCC. To our knowledge this is the first analysis of the effect of hypoxia in this patient population and highlights its importance not only as a predictive biomarker but also as a potential target for therapeutic intervention.
- head and neck neoplasms
- immunotherapy
- lymphocytes
- tumor-infiltrating
- metabolic networks and pathways
- tumor microenvironment
Data availability statement
All data relevant to the study are included in the article, uploaded as supplementary information, and are available upon request.
This is an open access article distributed in accordance with the Creative Commons Attribution Non Commercial (CC BY-NC 4.0) license, which permits others to distribute, remix, adapt, build upon this work non-commercially, and license their derivative works on different terms, provided the original work is properly cited, appropriate credit is given, any changes made indicated, and the use is non-commercial. See http://creativecommons.org/licenses/by-nc/4.0/.
Statistics from Altmetric.com
- head and neck neoplasms
- immunotherapy
- lymphocytes
- tumor-infiltrating
- metabolic networks and pathways
- tumor microenvironment
Introduction
Recurrent/metastatic (R/M) squamous cell carcinoma of the head and neck (HNSCC) remains a devastating disease with high morbidity and mortality. Strides have been made with monoclonal antibodies (mAb) targeting the Programmed cell death protein 1 (PD-1)/Programmed death-ligand 1 (PD-L1) pathway, leading to the approval of anti-PD-1 in the frontline and platinum failure setting. However, only a minority of patients derive benefit from these drugs.1 2
Much study has been focused on finding pathways of resistance to checkpoint blockade therapy and barriers related to the tumor microenvironment.3 4 This environment is made potently immunosuppressive by recruiting tolerogenic cell types, such as regulatory T cells, and by creating physical barriers to immune infiltration.5
Additionally, it is now clear there exists a distinct metabolic landscape produced through metabolic deregulation of tumor cells, leading to the loss of essential metabolites like glucose, amino acids, and oxygen.6 We and others have described that these metabolic changes can have profound effects on T cell differentiation and function, and in patients with melanoma, the metabolic status of the tumor microenvironment is a predictor of response to anti-PD-1 therapy, whereby oxidative metabolism and the consequent generation of severe tumor hypoxia is associated with poor response.7–10 While hypoxia has been associated with prognosis, resistance to radiation, and decreased immune infiltration in HNSCC, the role of hypoxia and metabolic dysregulation in patients with R/M HNSCC treated with immunotherapy has not been evaluated.11 12
Here, we examine the metabolic effects of anti-PD-1 blockade in an immunocompetent mouse model of HNSCC, as well as in tumor specimens from patients with R/M HNSCC treated with anti-PD-1 mAb . Our findings show that oxidative metabolism is upregulated as tumors become resistant to anti-PD-1 blockade with a subsequent increase in intratumoral hypoxia. We also show that lower intratumoral hypoxia is strongly predictive of increased efficacy of treatment with anti-PD-1 mAb, independent of other features, suggesting a new, targetable therapeutic pathway to enhance efficacy.
Materials and methods
MEER HNSCC model
A murine tonsillar epithelial cell stably expressing E6, E7, and H-Ras, MEER, was used for a murine head and neck cancer model.13 In order to generate an anti-PD-1 resistant MEER cell line, C57/BL6 mice were injected intradermally with 250,000 parental MEER cells and treated with 200 µg anti-PD1 (clone J43, Bio X-Cell, catalog# BE0033-2). A tumor from a non-responding mouse (a tumor that did not have a decrease in size) was harvested, processed into a single cell suspension by mechanical disruption between frosted glass slides, filtered, and then injected intradermally into new C57/BL6 mice. These mice were again treated with anti-PD-1 blockade therapy, and this process was iterated until none of the injected mice responded.
Metabolic assays
Tumor cell metabolic output was measured by Seahorse technology. Tumor cells were seeded in XFe96 plates at 10,000 cells per well in complete Rosewell Park Memorial Institute medium (RPMI). Cells were washed in minimal unbuffered assay media containing glucose, pyruvate, and glutamine 1 hour before the assay. Cells received sequential injections of 2 µM oligomycin, 2 µM FCCP, 10 mM 2-deoxyglucose (2DG), and 0.5 µM rotenone/antimycin A.
Immunotherapy and tumor models
C57/BL6 mice were treated with 200 µg anti-PD1 (clone J43, Bio X-Cell, catalog# BE0033-2) or respective hamster isotype controls intraperitoneally three times a week. For tumor growth experiments, mice were injected intradermally with 250,000 MEER cells. When tumors reached 3 mm in any direction, mice began receiving immunotherapy.
Histology
In some experiments, after tumor growth and pimonidazole pulsing, tumors were dissected and frozen at −80°C. in Optimal Cutting Temperature Compound (Tissue-Tek) and sectioned (Cryostat microtome). Tissue was fixed in histology-grade acetone (Fisher) at −20°C, rehydrated in staining buffer, stained with hypoxyprobe (Hypoxyprobe), CD8 Alexa Fluor 647 (Biolegend), Foxp3 Alexa Fluor 488 (Biolegend) and DAPI (Life Technologies), and mounted with ProLong Diamond Antifade Mountant (Life Technologies).
For formalin-fixed paraffin-embedded (FFPE) sections from patient samples, antigen retrieval was performed, and tissue sections were stained with Pan cytokeratin eFluor 570 (Life Technologies), CAIX Alexa Fluor 750 (Novus Biologicals), CD8 Alexa Fluor 647 (Biolegend), Foxp3 Alexa Fluor 488 (Life Technologies), and DAPI, and mounted with ProLong Diamond Antifade Mountant (Life Technologies).
All sections were imaged with an Olympus IX83 microscope and analyzed with ImageJ software.
Immunohistochemistry
Antigen retrieval was performed on archival FFPE sections from immunotherapy-naïve patients with R/M HNSCC using Diva Decloaker (Biocare Medical) in decloaking chamber (Biocare Medical). Tissues were incubated at room temperature with primary antibody. Visualization and detection of primary antibody was achieved using the HiDef Detection HRP Polymer System (Cell Marque) and DAB Substrate Kit (Cell Marque). Tissues were counterstained using Harris Hematoxylin. PD-L1 analysis was run on a Thermo Scientific Lab Vision 480 Autostainer using the anti-PD-L1 clone SP142, with positive control run on tonsillar tissue. Tissue sections were scanned by Aperio. PD-L1 Immunohistochemistry (IHC) scoring was calculated using the combined positive score (CPS) as previously described.14 CPS is defined as the total number of PD-L1 positive cells (tumor, lymphocytes, and macrophages) at any stain intensity divided by the total number of tumor cells, multiplied by 100. The IHC staining was revealed and evaluated by an experienced pathologist at two different times.
Patient data
We conducted a retrospective analysis of immunotherapy-naïve patients with R/M HNSCC treated with anti-PD-1 mAb with tissue available (archival) that had consented to the UPMC Hillman tissue banking protocol (HCC 99-069). Clinical data were obtained via chart review including baseline demographic and clinical characteristics, treatments received as well as data on response by RECIST 1.1, progression free survival (PFS) and overall survival (OS). Disease control rate (DCR) was defined as complete response (CR), partial response (PR), or stable disease (SD) by RECIST 1.1.
Statistics
All preclinical experiments were performed with at least three replicates. For independent experimental groups, two-sample Student’s t-tests or analysis of variance (ANOVA) was used for analysis; when groups were not independent (eg, when a parental and resistant tumor was implanted in different flanks of the same mouse), a paired t-test was used. The relationships between immune and metabolic factors and clinical response in human samples were analyzed by proportional odds regression. For the biomarkers analyzed (per cent area (CAIX)/mean intensity (I) of carbonic anhydrase IX, intratumoral CD8+ T cells (CD8) and Foxp3+ T cells (Treg), PD-L1, and CD8/Treg), “high” expression and “low” expression was defined as above or below the median, respectively. PFS and OS were compared between discrete groups by applying the log-rank test to product-limit (Kaplan-Meier) estimates. Proportional hazards (Cox) regression was used to relate survival to continuous factors. P<0.05 was considered statistically significant. Data were analyzed with GraphPad Prism and R software.
Results
We first sought to determine the tumor microenvironment characteristics of PD-1 resistance. To do this, we employed MEER, a murine head and neck cancer cell model: a murine tonsillar epithelial cell stably expressing E6, E7, and H-Ras.13 This model, in our hands, is partially sensitive to anti-PD-1. The parental MEER murine cell line was first implanted intradermally into mice and treated with anti-PD-1 mAb. A tumor from a non-responding mouse was harvested, processed into a single cell suspension, and then injected intradermally into new mice. These mice were again treated with anti-PD-1 blockade therapy, and this process was iterated until none of the injected mice responded, generating a cell line completely resistant to anti-PD-1 (figure 1A). The anti-PD-1 resistant MEER cell line has slightly accelerated growth in vivo compared with the parental MEER cell line, but no response to anti-PD-1 blockade therapy (figure 1B).
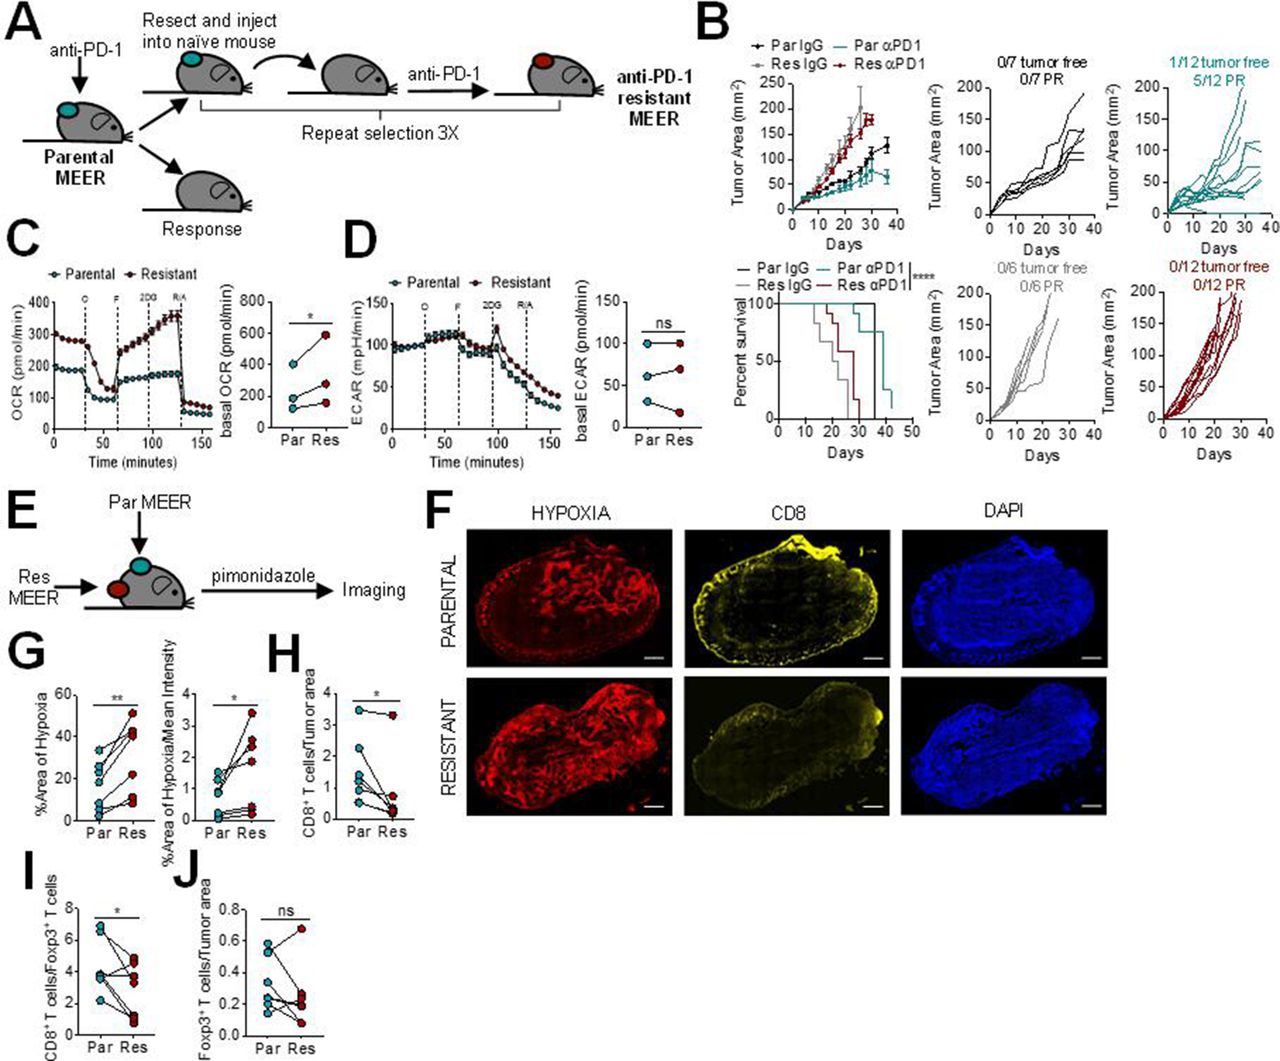
Programmed cell death protein 1 (PD-1) blockade resistance leads to increased tumor cell oxidative metabolism and intratumoral hypoxia. (A) Schematic of PD-1 resistant murine head and neck cancer cell model,MEER cell line generation. (B) Growth curve and survival of C57/BL6 mice inoculated with parental or PD-1 resistant MEER cells intradermally then treated with 200 µg anti-PD-1 or isotype controls three times per week when tumors reached 1–3 mm. Tumor-free indicates a complete regression. Partial response (PR) indicates mice that showed tumor regression for at least two measurements. Each line represents one animal. (C) Oxygen consumption rate (OCR) trace (left) and tabulated basal OCR (right) of parental and PD-1 resistant MEER cells. (D) Extracellular acidification rate (ECAR) trace (left) and tabulated basal ECAR (right) as in (C). (E) Schematic of imaging preformed on parental and PD-1 resistant MEER cells. (F) Pimonidazole, CD8, and DAPI staining of full tumor sections from mice bearing parental and PD-1 resistant MEER tumors. Scale bar, 500 µm. (G) Tabulated results of the internal hypoxyprobe area and intensity from mice as in (F). (H) CD8+ T cell counts normalized to tumor area from mice as in (F). (I) Ratio of CD8+ T cells and Foxp3+ T cells from mice as in (F). (J) Foxp3+ T cell counts normalized to tumor area from mice as in (F). Data represent two to three independent experiments. *p<0.05, **p<0.01, ****p<0.0001, ns not significant by ratio paired t-test (C, D) paired t-test (G–J), or logrank test (B). Error bars indicate SEM.
Since we have previously shown that tumor cell oxidative metabolism is increased in anti-PD-1 resistance,8 we next wanted to determine the metabolic differences between the parental and anti-PD-1 resistant MEER cell lines. Using Seahorse technology, we profiled these cell lines and found that the anti-PD-1 resistant MEER had significantly higher oxidative metabolism than the parental MEER (figure 1C). There was no difference between glycolytic metabolism in these two cell lines (figure 1D). Since heightened oxidative metabolism can lead to increased intratumoral hypoxia, we wanted to evaluate if these cell lines would generate different hypoxic environments in vivo. Pimonidazole, a chemical hypoxia tracer, was injected into mice bearing contralateral parental and anti-PD-1 resistant MEER tumors and immunofluorescent imaging was performed to analyze hypoxia and T cell infiltration (figure 1E,F). We found significantly increased intratumoral hypoxia in anti-PD-1 resistant tumors, compared with parental tumors on the contralateral flank (figure 1G). PD-1 resistant tumors also had significantly fewer intratumoral CD8+ T cells (figure 1H) as well as a lower CD8/Treg ratio (figure 1I). There was no difference in Foxp3+ T cell infiltration (figure 1J). These results suggest that higher oxidative metabolism in HNSCC leads to increased intratumoral hypoxia, decreased CD8+T cell infiltration, and decreased response to anti-PD-1 blockade therapy.
Given our preclinical data, we then asked if intratumoral hypoxia could be a predictive marker of efficacy in patients with R/M HNSCC treated with anti-PD-1 mAb Baseline characteristics of the 36 patients are shown in online supplemental table 1. Sixty-nine per cent of patients were men, and the median age was 59 (range, 40–80). The most common primary sites were oral cavity (42%) and oropharynx (28%). The majority of patients were smokers, and 40% of oropharyngeal cancer patients were HPV-positive. Most patients (61%) received anti-PD-1 mAb therapy in the platinum failure setting, with the remainder receiving it in the first line setting.
Supplemental material
Since hypoxia imaging through pimonidazole requires a pulse with the tracer before biopsies, pretreatment FFPE samples from our biobank were analyzed via immunofluoresecent imaging for hypoxia by the per cent area (CAIX) and mean intensity (I) of carbonic anhydrase IX.8 15 These analyses were restricted to the pan cytokeratin (PanCK+) tumor area within the section. T cell infiltration was also analyzed by quantifying the number of intratumoral CD8+ T cells (CD8) and Foxp3+T cells (Treg).
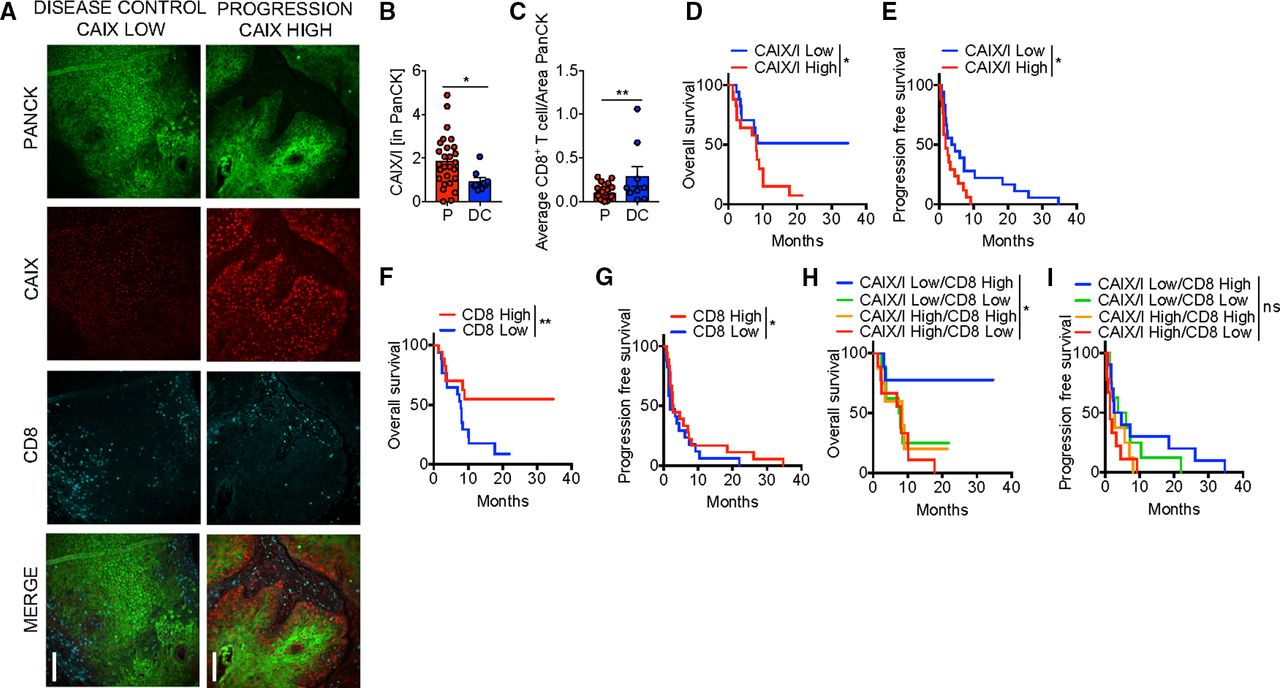
Defining DCR as those that achieved either CR, PR, or SD and progression as those with progressive disease by RECIST 1.1,16 22% of patients had disease control (3 CR, 5 SD). Representative immunofluorescent images of patients with stable disease and progression are shown in figure 2A. Low hypoxia by CAIX/I ratio, as well as high CD8 infiltration and high CD8/Treg ratio were significantly associated with a higher DCR with anti-PD-1 therapy (table 1, figure 2B,C). In a multivariate model, both CAIX/I and CD8 were independently associated with DCR, and 75% of those that achieved disease control (6/8) had both high CD8 and low CAIX/I. Low CAIX/I was significantly associated with increased PFS and OS in univariate analysis (table 1, figure 2D,E).
Univariate survival analysis
Hypoxia is associated with poor clinical efficacy with Programmed cell death protein 1 (PD-1) blockade therapy in patients. (A) Representative immunofluorescence of pan cytokeratin (PanCK), carbonic anhydrase IX (CAIX), and CD8 at 20× magnification of formalin-fixed paraffin-embedded (FFPE) sections from squamous cell carcinoma of the head and neck (HNSCC) patients treated with anti-PD-1 monoclonal antibodies (mAb). Scale bar, 200 µm comparing a patient with disease control (stable disease) to a patient with progression. (B) Tabulated results of percent area and mean intensity of CAIX (CAIX/I) within PanCK+ regions of FFPE sections from patients with HNSCC that progressed on (P) or had disease control (DC; defined as stable disease, partial or complete response) anti-PD-1 mAb. (C) Tabulated results of CD8+ T cell counts normalized to the PanCk+ area from patients as in (B). (D) Overall survival of patients treated with anti-PD-1 mAb based on CAIX/I. (E) Progression free survival of patients as in (C). (F) Overall survival of patients treated with anti-PD-1 mAb based on CD8+ T cell counts normalized to the PanCk area. (G) Progression free survival of patients as in (F). (H) Overall survival of patients treated with anti-PD-1 mAb monotherapy based on combination of CAIX/I and CD8+ T cell counts. (I) Progression free survival of patients as in (H). *p<0.05, **p<0.01, ns not significant. Error bars indicate SEM.
For example, patients with low CAIX/I had a 12-month OS of 51.3% versus 14.1% in high CIAX/I patients (HR 1.9, 95% CI 1.02 to 3.49, p=0.036). Patients with high CD8 had significantly increased PFS and OS (figure 2F,G) as shown previously.17 PD-L1 expression was of borderline significance for OS and Treg infiltration was not predictive of response, OS, or PFS in univariate analysis (online supplemental figure 1). In a multivariate analysis (table 2), both CAIX/I and CD8 were independently associated with PFS but neither were significant for OS. Patients with both low CAIX/I and high CD8 had significantly increased OS with 77.8% of patients alive at 12 months (HR 0.20, 95% CI 0.04 to 1.02, p=0.02), but this was not predictive of PFS (figure 2H,I). We examined correlation between these biomarkers analyzed and found that CAIX/I significantly correlated with Treg but not with CD8, PD-L1, or CD8/Treg (online supplemental table 2). Thus, tumor microenvironment hypoxia appears to be an independent factor that defines PD-1 blockade resistance in patients with R/M HNSCC.
Supplemental material
Multivariate survival analysis
Discussion
Anti-PD-1-based systemic therapy has become standard of care across different solid tumors, including R/M HNSCC.2 18 As such there is a rapidly growing need to better understand the mechanisms of resistance to anti-PD-1 therapy with subsequent therapeutic modulation of the tumor immune microenvironment based on these mechanisms. The murine MEER HNSCC model provided us with a unique opportunity to study this relationship in a rigorous fashion, as the parental line is partially responsive to anti-PD-1, such that we could drive PD-1 resistance through repeated passage in treated mice. These studies revealed that as PD-1 resistance developed, tumor cells had increased oxidative metabolism with resulting increased intratumoral hypoxia and a decrease in CD8+ T cells. Subsequent analysis of a cohort of anti-PD-1 treated patients with R/M HNSCC showed that lower tumor hypoxia was significantly predictive of increased DCR, PFS, and OS, and independently associated with DCR and PFS in multivariate analysis.
These data build on our data in melanoma, where similarly, anti-PD-1 resistance was associated with increased oxidative metabolism and hypoxia,8 analogous to pretreatment sequencing data obtained in melanoma that identified a hypoxia signature.15 However, uniquely in this current analysis, both resistant and sensitive cell lines were implanted into the same mouse, allowing for paired analysis of several immunological and microenvironmental factors. This is an important model for further preclinical experiments whereby differences in potentially highly variable host factors may change from animal to animal. In these experiments, while the same systemic immune response is elicited, there exist vastly different consequences within the tumor microenvironments.
In R/M HNSCC and other solid tumors, PD-L1 expression, tumor mutational burden, T cell-inflamed phenotype, and CD8+ tumor infiltrating lymphocytes have been observed to have predictive value for anti-PD-1 therapy.1 19–21 To our knowledge, this is the first evaluation of the predictive value of hypoxia in anti-PD-1 treated patients with R/M HNSCC. We found that lower tumor hypoxia was significantly associated with increased DCR, PFS, and OS, similar to our prior findings in melanoma patients.8 Multivariate analysis showed that both tumor hypoxia and CD8+ T cell infiltration were independently associated with DCR and PFS and there was not a significant correlation between these two biomarkers. Indeed, those patients with both low hypoxia and high CD8 had considerably better efficacy with anti-PD-1 than all other combined subgroups and by hypoxia or CD8 alone. Interestingly, hypoxia high/CD8 high and hypoxia low/CD8 low had intermediate outcomes although closer to the hypoxia high/CD8 low cohort, which had the worst outcomes. This suggests that even high CD8+ T cell infiltration may not be able to overcome a highly hypoxic tumor microenvironment, nor lower hypoxia sufficient for efficacy without the presence of CD8+ T cells. In our melanoma analysis, increased tumor oxidative metabolism was associated with T cell exhaustion and dysfunction, and this may also be an explanation for the intermediate outcomes observed in the hypoxia high/CD8 high group.8 Unfortunately, we were not able to do functional studies on CD8+ T cells in our retrospective patient cohort. Our preclinical data suggest that tumors become more hypoxic as they become resistant to anti-PD-1 mAb therapy. While we did not have any tumor tissue from patients that had failed anti-PD-1 therapy, a comparative analysis is planned using tissue from a recently opened trial for anti-PD-1 failure patients with R/M HNSCC (NCT04326257).
Our study has a number of limitations. One of the potential weaknesses of our study was that archival patient tissue samples were used rather than fresh samples obtained prior anti-PD-1 mAb therapy. This prevented us from being able to do functional analysis of immune cells, or by using a bona fide hypoxia tracer like pimonidazole in patient samples. While it could be suggested that an archival sample was not representative of the current tumor microenvironment, it is interesting that despite this, there was still predictive value found in multiple immune biomarkers that we analyzed. This is similar to PD-L1 analysis from large prospective trials, where predictive value seems to be similar with archival versus fresh sampling and most analysis of biomarkers have included archival tissue.22 This suggests the possibility that there may be stable host-dependent characteristics to the tumor immune microenvironment that remain stable over time. Compared with reported prospective clinical trials, our cohort represents a more refractory patient population with a response rate of 8% and DCR of 22%. Because of a low percentage of responders, we chose to focus on DCR as an endpoint. Importantly stable disease and durable stable disease is very clinically meaningful in this patient population and therefore we do not feel it reduces the significance of our study. Additionally, while our findings will need to be confirmed in a larger data set, despite this limited sample, significant predictive value was found for tumor hypoxia.
The promise of cancer immunotherapy using PD-1 blockade in HNSCC as well as other solid tumor types is tempered, since in only the minority of patients that do respond there is potential for prolonged disease control and survival. This highlights the importance of identifying more predictive biomarkers, especially those where subsequent therapeutic intervention is possible, in order to both improve efficacy and allow for a more personalized treatment approach. Our data highlight the importance of increased tumor oxidative metabolism and subsequent hypoxia in anti-PD-1 resistance in R/M HNSCC. A therapeutic trial of metabolic modulation, using metformin or rosiglitazone, combined with anti-PD-1 mAb therapy is currently accruing (NCT04114136). By altering tumor cell metabolism in combination with immune modulation, the benefits of immunotherapy may potentially be extended to additional patients.
Data availability statement
All data relevant to the study are included in the article, uploaded as supplementary information, and are available upon request.
Ethics statements
Ethics approval
Animal work in this study was approved by the University of Pittsburgh Institutional Animal Care and Use Committee, accredited by the AAALAC. Procedures were performed under their guidelines. C57BL/6J mice were obtained originally from the Jackson Laboratories and bred in house. Patient data and tissue were obtained under HCC 96-069 Tissue banking protocol which is an IRB approved protocol by the University of Pittsburgh IRB.
References
Supplementary materials
Supplementary Data
This web only file has been produced by the BMJ Publishing Group from an electronic file supplied by the author(s) and has not been edited for content.
Footnotes
Twitter @DelgoffeLab
DPZ and AVM contributed equally.
Contributors DPZ procured and analyzed human data, obtained research funding, and wrote the paper. AVM completed all mouse experiments, IF imaging of mouse and human samples, analyzed data, and wrote the paper. MV analyzed human clinical data and wrote the paper. DN performed statistical analyses. KD generated the PD-1 resistant MEER mouse model. AL assisted with tissue analysis. RLF provided the initial MEER model, clinical expertise, and research funding. GMD conceived of the study, oversaw research, obtained research funding, and wrote the paper.
Funding This study was funded by National Cancer Institute (P30CA047904, P50CA097190).
Competing interests DPZ has research support (institutional) for his role a PI for studies with Merck, BMS, GSK, AstraZeneca, Aduro, Lilly, Astellas, Macrogenics, Varastem, advisory board for Blueprint Medicines. GMD declares competing financial interests and has submitted patents covering the use of PGC1α in cell therapies that are licensed or pending and is entitled to a share in net income generated from licensing of these patent rights for commercial development. GMD consults for and/or is on the scientific advisory board of BlueSphere Bio, Century Therapeutics, Novasenta, Pieris Pharmaceuticals, and Western Oncolytics/Kalivir; has grants from bluebird bio, Novasenta, Pfizer, Pieris Pharmaceuticals, TCR2, and Western Oncolytics/Kalivir; GMD owns stock in Novasenta. RLF serves on advisory boards for BMS, EMD Serono, Macrogenics, Merck, Numab Therapeutics, Pfizer. RLF receives research funding from Astra-Zeneca/MedImmune, BMS, Novasenta, Tesaro. RLF consults for Aduro and Novasenta, RLF owns stock in Novasenta.
Provenance and peer review Not commissioned; externally peer reviewed.
Supplemental material This content has been supplied by the author(s). It has not been vetted by BMJ Publishing Group Limited (BMJ) and may not have been peer-reviewed. Any opinions or recommendations discussed are solely those of the author(s) and are not endorsed by BMJ. BMJ disclaims all liability and responsibility arising from any reliance placed on the content. Where the content includes any translated material, BMJ does not warrant the accuracy and reliability of the translations (including but not limited to local regulations, clinical guidelines, terminology, drug names and drug dosages), and is not responsible for any error and/or omissions arising from translation and adaptation or otherwise.