Article Text

Abstract
Background Autologous T cells engineered to express a chimeric antigen receptor (CAR) specific for CD19 molecule have transformed the therapeutic landscape in patients with highly refractory leukemia and lymphoma, and the use of donor-generated allogeneic CAR T is paving the way for further breakthroughs in the treatment of cancer. However, it remains unknown how the intrinsic heterogeneities of these engineered cells mediate therapeutic efficacy and whether allogeneic products match the effectiveness of autologous therapies.
Methods Using single-cell mRNA sequencing in conjunction with CITE-seq, we performed multiomics characterization of CAR T cells generated from healthy donor and patients with acute lymphoblastic leukemia. CAR T cells used in this study were manufactured at the University of Pennsylvania through lentiviral transduction with a CD19-4-1BB-CD3ζ construct. Besides the baseline condition, we engineered NIH-3T3 cells with human CD19 or mesothelin expression to conduct ex vivo antigen-specific or non-antigen stimulation of CAR T cells through 6-hour coculture at a 1:1 ratio.
Results We delineated the global cellular and molecular CAR T landscape and identified that transcriptional CAR tonic signaling was regulated by a mixture of early activation, exhaustion signatures, and cytotoxic activities. On CD19 stimulation, we illuminated the disparities of CAR T cells derived from different origins and found that donor CAR T had more pronounced activation level in correlation with the upregulation of major histocompatibility complex class II genes compared with patient CAR T cells. This finding was independently validated in additional datasets from literature. Furthermore, GM-CSF(CSF2) expression was found to be associated with functional gene productions, but it induced little impact on the CAR T activation.
Conclusions Through integrated multiomics profiling and unbiased canonical pathway analyses, our results unveil heterogeneities in the transcriptional, phenotypic, functional, and metabolic profiles of donor and patient CAR T cells, providing mechanistic basis for ameliorating clinical outcomes and developing next-generation ‘off- the-shelf’ allogeneic products.
- immunotherapy
- translational medical research
- receptors
- chimeric antigen
Data availability statement
All the data presented in this study are available on reasonable request to the corresponding authors.
This is an open access article distributed in accordance with the Creative Commons Attribution Non Commercial (CC BY-NC 4.0) license, which permits others to distribute, remix, adapt, build upon this work non-commercially, and license their derivative works on different terms, provided the original work is properly cited, appropriate credit is given, any changes made indicated, and the use is non-commercial. See http://creativecommons.org/licenses/by-nc/4.0/.
Statistics from Altmetric.com
Background
Following the first success in adults with chronic lymphocytic leukemia,1 CD19-directed chimeric antigen receptor (CAR) T cell therapy has evolved from a boutique academic approach to an USA Food and Drug Administration (FDA)-approved immunotherapy that has been integrated into standard anticancer care in relapsed or refractory B cell acute lymphoblastic leukemia (ALL) and lymphoma.2 3 Furthermore, with >1400 active cancer cell therapy pipelines ongoing globally, the advances in gene editing, T cell engineering, and cell manufacturing have extended the CAR T achievement to other therapy types such as CAR natural killer (NK), CRISPR engineered T cells, and macrophage-based therapies.4 However, as more patients involved in the treatment and longer follow-up data become available, a substantial number of patients cannot benefit from these therapies at the starting point while more subjects who achieved initial remission develop disease relapse,5 yet the fundamental mechanisms and pathways driving these clinical outcomes remain elusive.
Multiple T cell intrinsic factors, such as differentiation state,6 CD4/CD8 formulation,7 and T cell polyfunctionality,8 have been demonstrated correlative with the therapeutic efficacy. Therefore, despite the fact that successful manufacture and infusion of CAR T products remain barriers to some patients, many autologous CAR T treated subjects have experienced therapeutic collapse due to T cell dysfunction.5 To reduce the manufacturing failures and optimize CAR T qualities, the field is increasingly exploring the use of healthy donor (HD) generated CAR T, referred to as ‘off-the-shelf’ allogeneic products, as feasible option to ameliorate responses and benefit wider patient populations. Although the engraftment of allogeneic CAR T was observed limited in the pilot trial using transcription activator-like effector nuclease based technique,9 clinical trials have continued to expand in ALL and acute myeloid leukemia and are planned in lymphomas and multiple myeloma.10 However, the major question remaining is whether their biological characteristics are consistent with patient-derived CAR T, leading to a constant concern of their potency to serve as a stand-alone therapy.
With the advent of revolutionized single-cell mRNA sequencing (scRNA-seq), it is now possible to characterize the full spectrum of immune cell functional states and gene programs in a comprehensive and unbiased manner. Although not fully used, several reports have leveraged scRNA-seq to compare the transcriptional states of 4-1BB and CD28 CAR T cells,11 to understand the clonal kinetics and transcriptional programs preinfusion and postinfusion,12 to identify pre-existing CD19-negative subclones,13 to reveal subpopulations, stimulation, and exhaustion signatures,14 and to track dynamic development of CAR T cell dysfunction in clinical samples.15 Yet despite some transcriptomic features have been identified associated with the clinical observations,16 17 how the constitutional properties of these cellular products mediate therapeutic activities is incompletely understood. Such insights would be instructive to eliminate the hurdles of broadening therapy applications and promote the discovery of predictive biomarkers.
Here we present a systematic single-cell multiomics evaluation of HD-derived and ALL patient-derived CD19-targeted CAR T cells with identical CAR structure design. By combining scRNA-seq and CITE-seq,18 we interrogated the intrinsic transcriptional, phenotypic, functional, and metabolic profiles of these cells at basal state or following CD19-specific activation. We delineated the single-cell landscape of CAR T heterogeneity and identified the detectable transcriptome signatures that regulate the ligand-independent tonic signaling. Furthermore, through integrated clustering statistics and canonical pathway analysis, we demonstrated that the cellular and molecular states were dramatically different between autologous and allogeneic CAR T cells. Notably, we found that the stimulated donor CAR T cells displayed more enhanced functional activities than patient samples that are associated with the upregulation of major histocompatibility complex (MHC) class II genes. This finding was further validated in integrative analysis of scRNA-seq datasets from literature. Together, these data provide a biological basis for understanding the fundamental mechanisms of genetically engineered CAR T cells and its association with clinical responses or T cell resources.
Methods
HD and patient samples
Anonymous HD cells were obtained from the University of Pennsylvania Apheresis Unit. Patient samples were acquired from pilot clinical trials designed to assess the safety and feasibility of CD19-dericted chimeric antigen receptor T (CTL019) cell therapy in the treatment of relapsed/refractory ALL (ClinicalTrials.gov number, NCT01626495), which was conducted at the Children’s Hospital of Philadelphia. All subjects provided written informed consent in accordance with the Declaration of Helsinki and the International Conference on Harmonization Guidelines for Good Clinical Practice, including approval for future data collection and analysis. All laboratory operations followed the standard operating procedures for sample receipt, processing, freezing, and analysis. All ethical regulations were followed. The donor sample with CD28 costimulatory domain was obtained from Promab Biotechnologies, which uses high-titer lentivirus transduction to generate CAR T cells with a CD19 scFv-CD28-CD3ζ transgene.
Vector production, T cell isolation, and generation of CTL019 cells
A lentiviral vector containing a previously described CD19-specific CAR with 4-1BB/CD3ξ transgene was constructed and produced.19 Peripheral blood mononuclear cells were collected by standard leukapheresis. T cells were enriched by mononuclear cell elutriation, then washed and activated with anti-CD3/CD28-coated paramagnetic beads, which were then transduced with the above vector. The lentiviral vector was washed out 3 days after the culture initiation, and the cells were expanded for 8–12 days on a rocking platform device (WAVE Bioreactor System), followed by removing the beads magnetically. Finally, CTL019 products were harvested and cryopreserved in infusible medium.
Generation of transduced target cell lines
The NIH3T3 cell lines were originally obtained from the American Type Culture Collection and were cultured in Dulbelcco’s modified Eagle’s medium (Gibco) supplemented with glutamate and 10% fetal bovine serum (FBS; Gibco) in a humidified incubator (37°C in an atmosphere of 5% CO2). The cells were transduced with a lentiviral vector encoding human proteins CD19, CD86, and 4-1BB ligand (3T3-CD19), and the control cell line expressed human mesothelin (3T3-MESO) instead of CD19. Cells were sorted on a FACSAria (BD) to reach a >99% purity after transgene introduction. Mycoplasma and authentication were routinely performed before and after molecular engineering.
CTL019 in vitro coculture with target cell lines
On day 1, CTL019 cells were thawed and cultured in OpTmizer T-Cell Expansion Basal Medium supplemented with OpTmizer T-Cell Expansion Supplement and GlutaMAX Supplement (Gibco) in the humidified incubator for overnight rest. On day 2, dead cells were removed using EasySep Dead Cell Removal Kit (Stemcell) as per the manufacturer’s instructions. For the evaluation of unstimulated basal CAR T condition, 1×10⁶ cells were counted using hemocytometer; for the stimulation with 3T3-CD19 or 3T3-MESO target cells, 1×10⁶ CTL019 cells were mixed with the same number of engineered target cells. All the suspensions were cultured in 2 mL RPMI medium (Gibco) containing 10% FBS in a tissue culture treated 48-well plate (Fisher Scientific) for 6 hours in the incubator.
Cell staining with DNA-barcoded antibodies for CITE-seq
After 6-hour coculture, samples were resuspended in 100 µL Cell Staining Buffer (Biolegend) added with 5 µL of Human TruStain FcX Fc Blocking reagent (Biolegend). Cell suspensions were then incubated at 4°C for 10 min, during which the antibody pool was prepared using 1 µg of each TotalSeq antibody (Biolegend). After 30 min incubation at 4°C, cells were washed two times with 1 mL PBS (Life Technologies) and finally resuspended in PBS at 5×10⁵ cells/mL for the downstream single-cell isolation. TotalSeq antibodies for human T cell characterization panels: anti-CD4 (clone SK3), anti-CD8 (clone SK1), anti-CD45RO (clone UCHL1), anti-CD45RA (clone HI100), anti-CCR7 (clone G043H7), anti-CD62L (clone DREG-56), anti-HLA-DR (clone L243), anti-CD38 (clone HB-7), anti-CD69 (clone FN50), and anti-4-1BB (clone 4B4-1).
scRNA-seq device preparation and microfluidic operation
We used home-developed scFTD-seq to perform scRNA-seq, and the detailed materials and methods for preparing and operating the device have been described in our previous report.20 Briefly, a subnanoliter microchamber array and a microfluidic channel layer were made by casting Polydimethylsiloxane (PDMS) over the SU8 master wafers followed by degassing and curing at 80°C for 6–8 hours. Then, the two PDMS layers were cut to proper sizes and then plasma-bonded to assemble onto a 1 inch × 3 inch glass slide. The cell suspension prepared as previously was pipetted on the inlet reservoir of our microchip and was withdrawn into the device. Once the cell solution fully covered the microwell array area, the fluid flow was stopped, and cells were allowed to settle down into wells by gravity. Next, excessive cells were washed out by rushing PBS, and barcoded beads were loaded similarly to the cells. Then, lysis buffer and fluorinated oil were loaded sequentially to seal microwells. After cell and bead loading, the device was placed in a petri dish and exposed to three cycles of freeze and thaw, each of which included freezing at −80°C freezer or dry ice for 5 min followed by thawing at room temperature for 5 min. To capture mRNA onto beads, the device was then incubated for 1 hour inside an aluminum foil covered humidity chamber. After incubation, the beads were retrieved by 6× saline-sodium citrate (SSC) buffer flushing. Finally, collected beads were washed twice with 6× SSC buffer and then proceeded to the reverse transcription step.
Library preparation and sequencing
Library preparations were performed as described in the DropSeq protocol (V.3.1).21 Briefly, the captured mRNA was reverse-transcribed using Maxima H Minus reverse transcriptase (Thermo Fisher) with a custom template switching oligo. Then, the beads coated with cDNA were treated using Exonuclease I (Exo I, NEB) for 1 hour at 37°C with rotation to chew away any unbound mRNA capture probes. The cDNA was then amplified using a 13-cycle PCR whole transcriptome amplification. At this step, 0.4 µL of ‘additive’ primers were added to cDNA PCR to increase yield of antibody-derived tag (ADT; cDNA derived from the TotalSeq antibodies) products. After the amplification, ADT-derived cDNAs (180 bp) and mRNA-derived cDNAs were separated using SPRIselect (Beckman Coulter) beads at 0.6 ratio. After a standard Nextera tagmentation, PCR reactions (Nextera XT, Illumina) and another round of 0.6× purification using AMPure XP beads (Beckman Coulter), the mRNA library was ready to be sequenced. For ADT-derived cDNAs, 2× SPRI purifications and then an eight-cycle PCR were performed to amplify ADT sequencing library, followed by another round of 1.6× SPRI purification per manufacturer’s protocol. The quality of both the mRNA and ADT libraries were assessed by high sensitivity Bioanalyzer test (Agilent Inc). To obtain sufficient read coverage for both libraries, we combined 10% of ADT and 90% of cDNA library into one lane. The libraries were sequenced on HiSeq4000 (Illumina) at medium depth (average of 20,000–40,000 reads/cell) with three samples pooled into one sequencing lane.
Integrative analysis of scRNA-seq dataset from literature
The aligned scRNA-seq data from two 4-1BB CAR T donor samples were selected from Boroughs et al’s11 published work with SRA database accession number PRJNA554339. In their experimental setting, the CAR T cells were generated by transduction with a CD19 targeting 4-1BB-CD3ξ construct in a way similar to our CAR-T cell products. The CAR T cells were either left unstimulated (basal condition) or stimulated through CAR using CD19-expressing Nalm6 leukemia cells. Single cell isolation was conducted using 10× Genomics chromium, and the libraries were sequenced on Illumina HiSeq4000.
Processing of sequencing data
Reads from the mRNA libraries were aligned to the concatenated human (hg38) and mouse (mm10) reference genomes and the sequence of the transduced CAR construct using STAR 2.6.1a. The expression of CAR transgene was detected based on the sequence of the CAR construct provided in our previous publication22 and was further validated and visualized using Integrative Genomics Viewer tool developed by the Broad Institute.23 A UMI count matrix was built using the Drop-seq core computational protocol. To filter out low-quality cells, the boundary between empty microwells and wells containing a cell was determined in a sample-specific manner by examining the log scale barcode rank plots. The steep drop-off was regarded as the specified number of mRNA UMIs and cells with less than this number were removed from the downstream analysis. This method was also used to filter out 3T3 mouse species for coculture conditions. By examining the plots of mouse versus human UMI counts, we filtered out cells with more than a specified number of mouse UMIs. For the unsupervised clustering, either in our own samples or the literature samples, the quality control criteria used to filter cells was that gene expression counts between 200 and 3000 genes. Then, the mRNA expression data were log normalized using Seurat,24 and the Seurat V.3 anchor-based integration workflow was used to remove sample-correlative or condition-correlative batch effects with the default parameter setup. Finally, the integrated mRNA data were reduced to two dimensions using UMAP for visualization.25 CITE-seq-Count was used to count UMIs for the ADT libraries. To normalize ADT libraries, we fit the distribution of ADT counts for each antibody with a two-component negative binomial mixture model, as described previously.26
Differentially expressed genes
All differentially expressed genes (DEGs) analyses were performed in Seurat. The function ‘FindMarkers’ was used for pairwise comparison between subgroups (samples or clusters). A log fold-change threshold of 0.25 was applied in later steps to select genes as differentially expressed.
Ingenuity Pathway Analysis (IPA)
IPA (QIAGEN) was used to unveil the signaling pathways correlated with each cluster or sample.27 Here, DEGs identified in each cluster or sample and their corresponding fold change values were loaded into the dataset. Ingenuity knowledge base (genes only) was used as reference set to perform core expression analysis. T cell function related signaling were selected from the identified top canonical pathways to represent the major molecular and cellular functional profiles of the specific groups. The
z
score was used to determine activation or inhibition level of a specific pathway ( , inhibited;
  activated;
  or
or  can be considered significant).
Statistics
Statistical analyses were performed with Prism V.8 (GraphPad). Unless specifically indicated, data were presented as means±SEM as stated in the figure captions. Wilcoxon matched-pairs signed test was used to compare metabolic gene set expression levels between groups. Mann-Whitney test was used to compare the expression level of specific genes or ADTs between different groups. A p value below 0.05 was considered as statistically significant.
Results
Experimental design for single-cell multiomics profiling of 4-1BB CAR T cells
To delineate the transcriptional and functional features of 4-1BB/CD3-signaling second-generation CAR T cells, using our in-house-developed microwell-based scFTD-seq20 (online supplemental figure S1A–D), we performed scRNA-seq on bio-banked CAR T generated from one HD (41 years old, male) and two patients with ALL from phase I/IIA CD19-directed CAR T clinical trial.28 CAR T cells used in this study were manufactured at the University of Pennsylvania for pediatric and young adult acute B-lymphoblastic leukemia who were treated at the Children’s Hospital of Philadelphia. One of the patients achieved morphologic complete remission (CR) after autologous CAR T infusion (<5% leukemic blasts in bone marrow), was minimal residual disease (MRD) negative and still had B cell aplasia in 72 months postinfusion, as summarized in online supplemental table 1. Another patient did not develop initial response (non-responder (NR)) to the therapy.
Supplemental material
To simultaneously provide phenotypic information of T cell surface protein expression, we integrated CITE-seq technique into our platform, which combines highly multiplexed protein marker detection with transcriptome profiling through sequencing of ADTs.18 In total, 10 well-characterized T cell markers including subset markers (CD4 and CD8), memory markers (CD45RO, CD45RA, CCR7, and CD62L), and activation markers (HLA-DR, CD69, CD38, and 4-1BB) were characterized in our study. Besides the baseline condition, ex vivo CAR-specific activation through 6-hour coculture with CD19-engineered NIH-3T3 cells (CD19-3T3) or its control counterpart (mesothelin-expressed 3T3 cells (MESO-3T3)) was also considered in this experimental design (figure 1A). After quality control and filtering, we obtained transcriptomes and cellular proteomes of 23 349 single CAR T cells. To define the immune landscape and its association with T cell origin or clinical outcomes in an unbiased fashion, we aligned the datasets and corrected for sample-specific or condition-specific batch effects with canonical correlation analysis (online supplemental figures S2A–B).

A single-cell multiomics landscape of CD19-targeted CAR T cells generated from healthy donor and ALL patients. (A) Schematic of experimental design. (B) UMAP plot of pooled 23,349 single CAR T cells collected from all conditions of three samples. (C) Heatmap of differentially expressed genes of each identified cluster. Highlighted genes were used to annotate each cluster. (D) The distribution of surface protein ADT-CD4 and ADT-CD8 expression revealed by CITE-seq. Color bar represents normalized expression level. (E) Fraction of cells from each sample in each cluster. x axis indicates sample resources and stimulation condition. ALL, acute lymphoblastic leukemia; CAR, chimeric antigen receptor; CART, without any stimulation; CD19, cocultured with 3T3-CD19; CR, patient with complete remission; HD, healthy donor; MESO, cocultured with 3T3-MESO (mesothelin); NR, non-responder.
Global landscape of single-cell transcriptional and phenotypic states of CAR T cells
Using dimensionality reduction with uniform manifold approximation and projection (UMAP), we clustered all the single cells into 11 subpopulations and annotated them by the expression of ADT-CD4, ADT-CD8, and DEGs of each cluster (figure 1B,D). Specifically, cells in C0 were characterized by the expression of ADT-CD4 and gene CRBN, which occupied the largest proportion (close to 30%) among all clusters. In mice lacking Crbn, CD4+ T cells showed increased activation and interleukin (IL) 2 production on T cell receptor (TCR) stimulation,29 suggesting C0 cells were maintaining inactivated states. Cells in subset C1 exhibited CD4+ central memory phenotype, confirmed with the enriched CCR7 gene expression (online supplemental figure S3A), low ADT-CD45RA molecule feature and relatively high ADT-CCR7 expression30 (figure S4a). It has been reported that, compared with CD28 domain CAR T, activated 4-1BB CAR T cells have enhanced mitochondrial biogenesis.31 In our single-cell analysis, a unique C2 cluster was identified with highly expressed mitochondrial genes such as MT-CO1, MT-CO3, and MT-ATP6. Despite their low ADT-CD69 and ADT-HLA-DR and high ADT-CD62L features (online supplemental figure S4A,B), C2 cluster was one of the major components in basal or control condition across all samples (figure 1E), indicating that mitochondrial respiratory capacity was also presented at baseline level. Cluster C3 was a mixture of CD4+ and CD8+ cells that showed HMGB2-marked proliferating phenotype as well as enriched expression of G2/M and S cell cycle genes (online supplemental figure S3B). CD8+ cytotoxic effector CAR T cells were localized in cluster C4, characterized by the increased expression of ADT-CD8 and genes GZMA, GNLY, CCL5, GZMB, and CD8A. It is well known that the interaction with antigen-presenting cells drives an orchestrated program of naive CD8+ T cells differentiation into effector states.32 However, we found 10%–15% CAR T cells at basal condition or cocultured with MESO-3T3 also displayed cytotoxic signatures (figure 1E), which was potentially attributed to CAR tonic signaling induced in the process of ex vivo expansion.33
The distribution of C5–C8 was geographically fragmented with the continental clusters, characterized by high expression of cytokines or chemokines. As the only two members of C chemokine subfamily mainly secreted by activated CD8+ T cells,34 XCL1 and its paralog XCL2 were enriched in C5 cells, which indeed showed increased ADT-CD8 expression in our protein data. The two chemokines fulfill a unique role in chemoattraction of conventional type 1 dendritic cells,35 hence implying how CAR T orchestrate other immune members to mediate antitumor efficacy. Cells in C6 presented a prevalent colony stimulating factor 2 (GM-CSF, CSF2)-producing CD4+ phenotype, and another CD4+ helping T cell subpopulation C7 was identified with marked expression of IFNG. In cluster C8, an important chemoattractant for NK cells,36 CCL4, was evidently expressed in CD8+ CAR T, which also showed improved expression of CSF2 and GZMB (online supplemental figure S3A). In the correlation study of clonal kinetics and single cell transcriptional programs of lymphoma patient-derived CAR T cells, CD8+ clonotypes with higher expression of CCL4 were found to possess more prolonged persistence,12 revealing the functional contribution of this transcriptionally distinct subset. In line with these observations, the increased expression of ADT-CD69, ADT-HLA-DR, ADT-4-1BB and decreased expression of ADT-CD62L further confirmed the activated states of cells in C5–C8, and they were apparently more frequent in CD19-3T3 stimulated condition (figure 1E and online supplemental figure S4A,B). Interestingly, we found that a small fraction of basal CAR T cells also obtained these activation signatures, potentially owing to CAR tonic signaling. Furthermore, the total proportion of C5–C8 clusters in resting NR cells was noticeably greater than that in HD or CR group (13.9% vs ~4%), arguably indicating elevated tonic signaling could impair the CAR T efficacy.
Cells in C9, in our analysis, were dominated by the upregulated expression of MHC II genes and their regulators, suggesting another intrinsic molecular signature of 4-1BB CAR T cells. An extremely low number of cells were affiliated to cluster C10 (0.8%), which showed distinguishable expression of Th1 differentiation master regulator TBX21 (T-BET), yet its upstream regulator STAT1 was downregulated. Finally, we compared the expression level of functional genes between experimental conditions. Significantly amplified production of cytokines, granzyme, and perforin was observed in CD19 activation group (online supplemental figure S5). In aggregate, we have leveraged the unique advantage of single-cell multiomics data to unveil the constitutional heterogeneity and function of CAR T cells derived from HD and ALL patients.
Basal CAR T cells have tonic signaling regulated by a mixture of early activation, exhaustion, and cytotoxic activities
While global analysis of pooled CAR T cells under different conditions could define their intrinsic properties, we next sought to characterize only basal CAR T cells to explore their transcriptional signatures at rest. Unsupervised clustering further defined nine subclusters (figure 2A), and several of them shared coherent cellular activities with global landscape, including cytotoxic (cluster 2), proliferating (clusters 1 and 3) and mitochondrial (cluster 4) features (online supplemental figure S6A). To decipher molecular and cellular scripts of each cluster, we applied IPA to link the DEG expression patterns with literature-based canonical pathways. CAR T in clusters 0–3, which totally occupied 80% of all single cells (online supplemental figure S6B), showed highly activation of sirtuin signaling pathway, suggesting these cells maintained the potential of delaying cellular senescence and aging37 (figure 2B). Among them, cells in clusters 1 and 3 had upregulated actin cytoskeleton, integrin and RhoA signaling that were regarded as prominent regulatory factors in many fundamental cellular activities including cell cycle progression, gene expression, cell transformation, and cell-to-cell communications.38 39

Transcriptional and pathway signatures of basal CAR T cells indicate tonic signaling is regulated by a mixture of early activation, exhaustion, and cytotoxic activities. (A) UMAP clustering of basal single-cell profiles. (B) Canonical pathways identified in each cluster and their comparisons.
z
score reflects the predicted activation level ( , inhibited;
  activated;
  or
or  can be considered significant). (C) Fraction of cells from each sample in each cluster, separately calculated for CAR+ and CAR− cells. (D) The distribution of early activation related genes identified in cluster 7. (E) Expression level comparison of evaluated genes in (D) between CAR+ and CAR− cells. (F) The distribution of exhaustion-related genes identified in cluster 5. (G) Expression level comparison of evaluated genes (F) across all the single cells between CAR+ and CAR− cells. Color bar represents normalized expression level. Bar plots show mean±SEM. The p values were calculated with two-tailed Mann-Whitney test. **P<0.01, ***p<0.0001. ns, not significant. CAR, chimeric antigen receptor; UMAP, uniform manifold approximation and projection.
To examine whether there is a tonic signaling among the basal 4-1BB CAR T cells and look for evidence of detectable tonic transcriptional activities, we classified these cells into CAR+ and CAR− subgroups based on the presence of lentiviral vector elements in the CAR construct (online supplemental figure S7). Strictly speaking, CAR+ group indisputably consists of cells that successfully transduced with CAR structure, whereas CAR− group is a mixture of untransduced endogenous T cells and transduced cells with CAR gene expression level lower than detection sensitivity. Notable differences of cell proportion in clusters 3, 5 and 7 were observed, in which CAR+ cells were more frequent regardless of their origins (HD, CR or NR) (figure 2C). For clusters 3 and 5, we found a remarkable upregulation of signaling by Rho family GTPases, which is elicited when TCR is engaged during T cell activation.40 Furthermore, a comprehensive cascade of signaling events with activation signatures arose in clusters 5 and 7, including PKC θ signaling in T lymphocytes that transduces signals downstream the activated TCR/CD28 receptor,41 NFAT in regulation of the immune response that modulates the transcription of polarizing cytokines and helper T cell differentiation,42 as well as Th1 pathway (figure 2B). The activation of ICOS-ICOSL signaling in T helper cells, which contributes mainly to the regulation of effector T cell functions,43 was uniquely identified in cluster 7. Further inquiry into the molecules associated with this pathway found that TNFRSF4 (CD134), MHC II genes and NFKB1 were highlighted in cluster 7 (figure 2D), and their expression levels were significantly increased in CAR+ cells (figure 2E).
Another observation was that T cell exhaustion signaling pathway was highly activated in cluster 5. We performed similar analysis and JAK1, STAT1, HAVCR2, and PTPN11 were emerged from all DEGs (figure 2F), which led to T cell exhaustion through distinct tracks. The JAK-STAT pathway has been widely recognized as critical players in orchestrating the polarization of T helper cells44; actually, in nuclei from T lymphocytes, STATs can also increase the expression of programmed cell death protein 1 (PD-1) and further result in exhaustions.45 HAVCR2 (TIM-3) is a well-recognized immune checkpoint mediating the CD8+ T cell exhaustion,46 and PTPN11 encodes SHP-2 that is considered responsible for T cell dysfunction.47 As compared with the CAR− group, CAR+ cells showed a significantly higher expression of these four genes (figure 2G). By extension, two direct exhaustion-induced gene signatures, PDCD1 and LAG3, were significantly upregulated in CAR+ cells despite their extremely low expression level (online supplemental figure S8A). No difference existed for CTLA4 expression between CAR+ and CAR− cells, and TOX, a transcription factor that primarily expressed in exhausted effector memory CD8+ T cells,48 was not detected at current sequencing depth. Interestingly, our analysis also identified the cytotoxic T cell mediated apoptosis of target cells pathway in cluster 2, featured by enriched expression of granzyme (GZMB), perforin (PRF1) and granulysin (GNLY) genes (online supplemental figure S8B). Although cluster 2 had more CAR− cells, the expression level of GZMB and PRF1 were distinctly increased in CAR+ group (online supplemental figure S8C). These data indicate that 4-1BB CAR T has a tonic signaling prior to CD19-antigen presence, which is predominantly regulated by a mixed early activation, exhaustion signatures in conjunction with cytotoxic activities.
Basal CAR T cells generated from different origins have distinct phenotypic, functional, and metabolic programs
Various T cell subpopulations present at homeostasis and the starting T cell phenotype has been demonstrated to be an important determinant of clinical responses in CAR T immunotherapy.5 In order to determine whether the original T cell resources could correlate with the phenotypic composition of CAR T cells, we leveraged the single-cell CITE-seq markers to define the T cell differentiation states. Based on a four-marker recognition scheme involving CD62L, CCR7, CD45RA, and CD45RO,49 we found that a majority of CAR T cells generated from HD or CR patient had conserved differentiation status, including stem cell-like memory (TSCM) and central memory (TCM) phenotypes (figure 3A). By contrast, 67.9% of CAR T cells from NR patient exhibited an effector memory (TEM) state. The proportion of naïve (TN) or effector cells (TEF) showed no apparent difference between the three groups. Additionally, expression heatmap of the four maker panels in each state verified that our CITE-seq label-based classification is reliable (figure 3B). When further investigating the two early memory-related markers, we found the expression levels of ADT-CD62L and ADT-CCR7 were significantly augmented in HD as compared with patient samples (figure 3C), suggesting donor-derived allogeneic cells maintained superior proliferative capacity that would lead to prolonged persistence after infusion.31
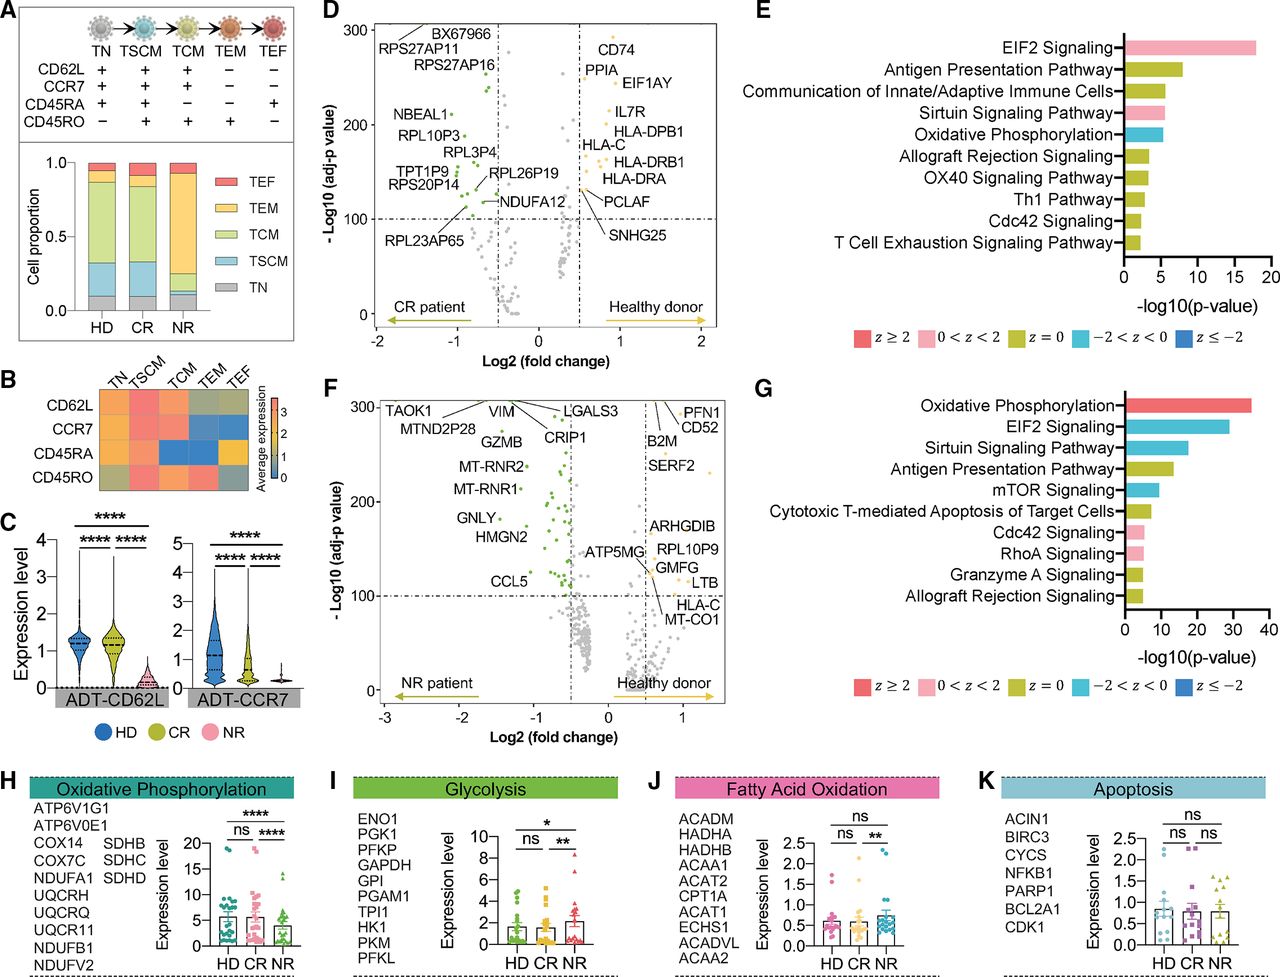
Phenotypic, functional, and metabolic states of basal CAR T cells. (A) Composition of T cell differentiation states of each sample determined by ADT-CD62L, ADT-CCR7, ADT-CD45RA, and ADT-CD45RO expression.(B) The average expression heatmap of the four ADT markers in each T cell state. (C) Comparison of early memory related ADT-CD62L and ADT-CCR7 expression between different samples. The p values were calculated with two-tailed Mann-Whitney test. (D) Volcano plot of DEGs upregulated in HD versus CR sample. (E) Corresponding signaling pathways regulated by DEGs identified in (D). (F) Volcano plot of DEGs upregulated in HD versus NR sample. (G) Corresponding signaling pathways regulated by DEGs identified in (F).
z
score reflects the predicted activation level ( , inhibited;
  activated;
  or
or  can be considered significant). (H–K) Comparison of oxidative phosphorylation (H), glycolysis (I), fatty acid oxidation (J) and apoptosis (K) correlative gene sets between HD, CR, and NR group. Literature-based gene sets were listed at left side. Scatter plot with bar shows mean±SEM. Symbols represent average expression value of each gene across all single cells. The p values were calculated with Wilcoxon signed-rank test. *P<0.05, **p<0.01, ***p<0.0001. ADT, antibody-derived tag; CAR, chimeric antigen receptor; CR, complete remission; DEGs, differentially expressed genes; HD, healthy donor; NR, non-responder; ns, not significant; TN, naïve T cell; TSCM, stem cell-like memory T cell; TCM, central memory T cell; TEM, effector memory T cell; TEF, effector T cell.
In an attempt to explore the transcriptional distinctions between HD, CR, and NR cells, we further compared the DEGs between these groups. For HD versus CR, we found a set of MHC II genes were upregulated in donor cells (figure 3D), and IPA analysis disclosed that the functional programs related to these DEGs were slenderly activated EIF2 signaling and sirtuin signaling pathway, which both instructed some fundamental cellular activities such as protein synthesis, translation initiation, and DNA repair50 (figure 3E). Similar analyses were implemented in HD versus NR and CR versus NR comparisons, resulted in the identification of highly activated oxidative phosphorylation (OXPHOS) mechanism in CAR T from HD or CR group (figure 3F,G and online supplemental figure S9A,B). Considering the metabolic signatures can shape the phenotypic characteristics of T cells, we evaluated several metabolic activities via the expression level comparisons of manually curated literature-based gene sets.51 52 CAR T cells from HD and CR again demonstrated significantly higher expression of OXPHOS than NR (figure 3H), whereas NR cells showed increased expression of aerobic glycolysis-related genes (figure 3I). It is well recognized that T cell transition from quiescence to activation state relies on a metabolic shift from oxidative to glycolytic pathways to ensure long-term survival and faster energy supply,53 which further verifies that elevated activation degree is presented in basal NR CAR T cells, while HD or CR group preserves improved naïve or memory signatures. The cellular lipid metabolism of fatty acid oxidation (FAO) is also of major importance for directing T cell differentiation, and the preferential usage of FAO has been linked to the development of CD8+ memory T cells and the induction of CD4+ regulatory T subtype.54 We observed an upregulation of FAO metabolism in NR cells, despite its far low expression level compared with OXPHOS or glycolysis gene sets (mean values were 0.65, 5.14, and 1.80, respectively) (figure 3J). Finally, equivalent apoptosis level was shown across three groups (figure 3K). Together, these phenotypic, functional, and metabolic analyses demonstrate that resting NR CAR T cells have impaired ability to conserve less differentiation states and rely more on glycolysis for energy supplement, which are very likely associated with attenuated CAR T expansion and remission induction failures after infusion.
Antigen-specific stimulation unveils inherent characteristics of 4-1BB CAR T
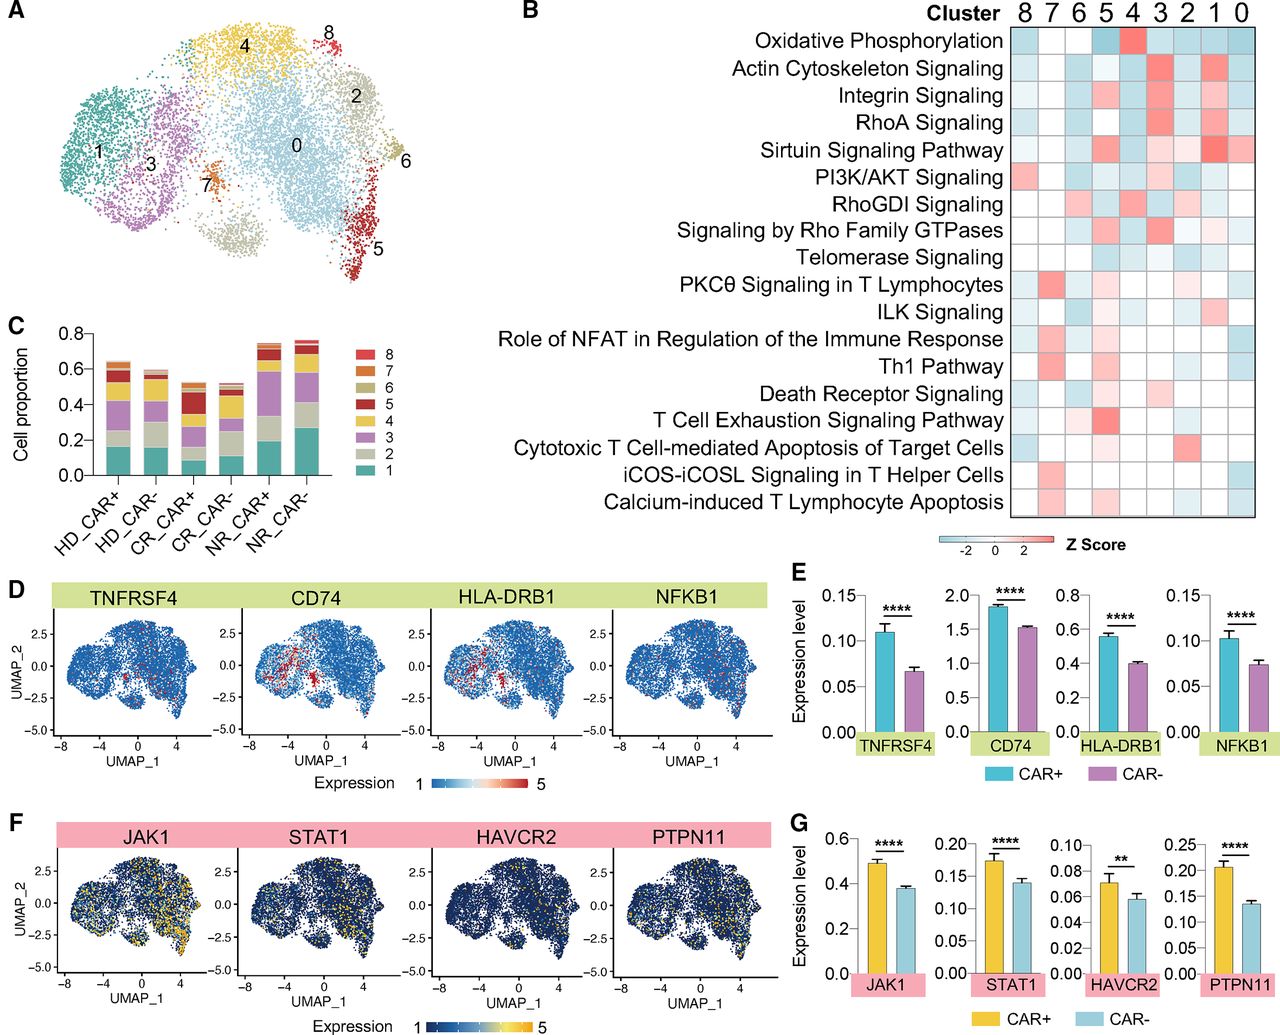
In light of the aforementioned phenomenon observed in basal CAR T cells, we next asked how transcriptional program evolves following antigen-specific stimulation and whether functional distinctions remain among different groups. Using unsupervised graph-based clustering, 9744 CD19-3T3 stimulated CAR T cells were dissected into 10 subclusters (figure 4A). One of the notable observations that has not appeared in the profiling of resting cells was that CAR+ cells exclusively enriched in one subset (cluster 0), indicating that intrinsic characteristics of successfully CAR-transduced T cells could be unveiled through CAR-specific activation and be separated with their autologous counterparts (figure 4B). The finding raises the question of whether these CAR+ cells are also functional effectors. To answer this, we investigated the distributions of Th1-related and Th2-related cytokine genes on the UMAP plot, which turned out to be not entirely consistent with CAR gene allocation (online supplemental figure S10A). Further calculation of correlation scores revealed delicate positive interrelationships between CAR and these functional genes (online supplemental figure S10B). To interrogate the canonical signaling pathways associated with cells in cluster 0, we performed IPA analysis using DEGs identified in this cluster (online supplemental figure S10C). Inhibition of EIF2 signaling and OXPHOS and the preferential utilization of glycolysis demonstrated the active essence of these cells. T helper cell differentiation, cytotoxic activity, and exhaustion signaling were also identified, although the associative z scores were not significant enough to predict their activation or inhibition identity. Additionally, the upregulation of Th1 pathway, Th2 pathway and ICOS-ICOSL signaling represented their functional capacity, and the antipodal regulation of apoptosis signaling and telomerase signaling indicated their robust replicative potential.55 The CD28 signaling in T helper cells was inhibited, mainly due to the structural design that these cells incorporated 4-1BB as their second costimulatory domain rather than CD28.

CD19-specific stimulation of CAR T cells unveils their inherent characteristics and identifies signatures specific to HD, CR, or NR group. (A) UMAP clustering of 9744 CD19-3T3 stimulated CAR T cells identified 10 transcriptional clusters. (B) Distribution of CAR gene expression. (C) Single-cell expression violin plot of key immunologically relevant cytokine genes separated by CAR+ and CAR− as well as resource groups. The values listed at left represent normalized expression level of each cytokine. (D) UMAP reclustering of only activated CAR+ cells. (E) Volcano plot of DEGs when comparing activated HD with CR sample. (F) Signaling pathways regulated by DEGs identified in (E).
z
score reflects the predicted activation level ( , inhibited;
  activated;
  or
or  can be considered significant). (G) Comparison of activation related surface protein expressions between different groups. (H) The proportion of each T cell differentiation state in each group. CAR, chimeric antigen receptor; CR, complete remission; HD, healthy donor; NR, non-responder; TN, naïve T cell; TSCM, stem cell-like memory T cell; TCM, central memory T cell; TEM, effector memory T cell; TEF, effector T cell; UMAP, uniform manifold approximation and projection.
Cytokines are the principal determinants of T cell functions and subtypes. To gain insights into the CAR T functional profile on stimulation, we evaluated and compared the expression of major immunologically relevant cytokines between CAR+ and CAR− cells as well as between HD, CR, and NR groups (figure 4C). The expression level of these molecules varied dramatically. For cytotoxic category that mainly plays role of destroying tumor cells, GZMB was the prime performer, whereas PRF1 expression was generally very low. Improved expression of T helper functional genes and the stimulatory CSF2 were observed in HD or CR versus NR CAR T cells, whereas regulatory and inflammatory activities were not induced vigorously. Besides, a group of chemoattractive factors were also highly operative in CR and HD cells, including CCL3, CCL4, XCL1, and XCL2, which had been discussed a lot in our previous analyses. When further comparing HD with CR group, Th2-dominated cytokines, IL4 and IL5, had augmented expression in HD-derived cells, whereas the ability to induce directed chemotactic was obviously increased in responsive patient sample. Interestingly, CAR− cells also showed polyfunctionality of producing a combination of multiple cytokines although at a reduced level compared with CAR+ cells, and this gap was expanded in NR group. Collectively, our data suggest that antigen-specific stimulation drives the exposure of CAR T intrinsic characteristics involved in activation mechanisms, immune responses, metabolic activities, and cytokine production profiles.
HD-derived CAR T cells have more pronounced activation level than patient cells in correlation with their upregulated MHC II genes expression
To dive deeper into the understanding of concealed activated CAR T signatures and correlate them with product origins, we narrowed down the unsupervised clustering using only CAR+ cells cocultured with CD19-3T3, leading to the identification of nine new clusters (figure 4D and online supplemental figure S11A). The computation of cell ratio in each cluster and the interpretation of submerged signaling pathways allow us to track the evolvement of molecular and cellular functions from basal to activated state (online supplemental figure S11B,C). We found that more amounts of NR cells were aggregated in clusters 2 and 4 than HD or CR. In cluster 2, highly upregulated OXPHOS and inhibition of majority of functional pathways indicated these cells were not fully activated. For cells in cluster 4, several signs of T cell activation were visible but Th2, HMGB1 and NF- κ B signaling were not normally operative. Clusters 0, 1, and 3 were enriched for HD and CR cells. Despite highly activation states for cells in clusters 0, the distribution in clusters 1 and 3 suggested that a proportion of HD or CR CAR T cells were also not activated, which very likely was due to the unsaturated number of coculture target cells (CAR T was cocultured with 3T3-CD19 at a 1:1 ratio). Considering the relative low number of cells in clusters 5–8, their contributions were not taken into consideration. Overall, regard to the proportion of fully activated CAR T cells, NR group decreased a relative abundance of 8% as compared with CR (28.7% vs 36.6%), and no big difference existed for CR versus HD (36.6% vs 34.9%).
Aforementioned analyses revealed that allogeneic donor CAR T displayed similar functional profiles in comparison with responsive patient cells. To illuminate their subtle intrinsic distinctions, we directly compared the differential expression between activated HD and CR cells. Consistent with the observation in basal condition, a predominantly upregulated expression of MHC II genes was existed in HD sample, and these genes were largely involved in a full-scale amplification of functional signatures, including Th1 pathway, Th2 pathway, activation-related signaling, as well as activation-induced death receptor signaling (figure 4E,F). We analyzed the surface expression of several activation CITE-seq markers and found that ADT-HLA-DR expression was particularly increased in HD when marked higher ADT-CD69, ADT-CD38, and ADT-4-1BB were expressed in CR cells (figure 4G and online supplemental figure S12A–D). Additionally, all these molecules were induced to significantly diminished level in NR group.
Examination of activated CAR T differentiation states revealed the enrichment of TCM cells in the HD or CR group in comparison with the NR, as well as a steady decline of TSCM cells from donor to patient samples. By contrast, compared with the basal condition, about 20% TEM cells in NR differentiated into later-stage TEF subtype (figure 4H). Finally, we investigated the metabolic gene sets and found a ~5-fold increase in glycolysis and a ~4-fold increase in apoptosis compared with resting CAR T cells, while no evident changes occurred for OXPHOS and FAO gene expressions (online supplemental figure S13B–E and figure 3H). Additionally, the lower level of OXPHOS and higher level of glycolysis observed in resting NR cells were still conserved following activation, potentially representing a resource-specific metabolism characteristic (online supplemental figure S13A). Thus, we conclude that on CAR stimulation, HD cells have more pronounced activation signatures than CR cells correlated with their upregulated HLA-DR reactions, whereas NR cells exhibit activation induction failure, decreased central memory phenotype, accelerated exhaustion, and higher glycolysis activity.
CSF2 expression is associated with functional genes production but induces no impact on the CAR T activation level
In our previous study, we observed that CSF2 (GM-CSF) was highly prevalent in activated third-generation CAR T cells confirmed independently by single-cell cytokine secretion assay and scRNA-seq.56 In the current work, this phenomenon continues to exist, but the situation varies in different groups. From the perspective of expression ratio, 98.9% of CR cells have CSF2 expression, and this number reduce to 77.3% in HD and 67.7% in NR. In regard with expression level, again, CR group has evidently higher production than their HD or NR counterparts (figure 5A). Unsurprisingly, CD4+ helper CAR T generated more CSF2 than CD8+ cytotoxic cells (figure 5B).

CSF2 expression is correlative with functional genes production but induces no impact on the CAR T activation level. (A) Comparison of CSF2 expression in HD, CR, and NR group. (B) Comparison of CSF2 expression in CD4+ and CD8+ cells. Box middle line, median; whiskers, minimum and maximum. (C) CSF2-expressed single cells were manually classified into CSF2_HIGH and CSF2_LOW subgroup. (D) Violin comparison of functional genes expression between CSF2_HIGH and CSF2_LOW group. (E) The correlation between CSF2 expression and representative functional genes. (F) Violin comparison of activation surface markers between CSF2_HIGH and CSF2_LOW group. The P values were calculated with two-tailed Mann-Whitney test. ****P<0.0001. CR, complete remission; HD, healthy donor; IL, interleukin; NR, non-responder.
Recent studies suggest that monocytes and macrophages contribute to the development of cytokine release syndrome (CRS) and neurotoxicity, and CSF2 neutralization has been verified as an effective therapeutic strategy to reduce these CAR T associated adverse effects without compromise of antitumor activity.57 58 Here, to investigate whether CSF2 expression level has effects on CAR T functional performance, based on the ranked CSF2 expression values, we manually selected the top half cells and defined them as CSF2_HIGH group while set the bottom half as CSF2_LOW group (figure 5C). In CR cells, we observed an elevated production of IFNG, IL2, and IL13 genes in CSF2_HIGH compared with CSF2_LOW group, and these disparities widened for NR cells (figure 5D). Notably, for cells originated from HD, comparable levels of these functional molecules were revealed in two CSF2 subgroups, suggesting their unique feature different with patient-derived CAR T. Furthermore, we examined the correlation coefficients between CSF2 and these genes and all found positive associations, despite relatively low correlation scores (<0.5) (figure 5E). However, when we are analyzing the aforementioned CITE-seq activation markers to explore whether the two subgroups received equivalent activation, no distinction displayed across all three samples, demonstrating CAR T activation state was independent of CSF2 expression level (figure 5F). These single cell data illuminate the mechanistic explanations of why CSF2 neutralized CAR T maintains normal antitumor functions.
Integrated analyses of literature data identified the upregulation of MHC II genes among functional heterogeneities in activated donor samples
In the aforementioned analyses, we found donor CAR T cells had a more pronounced activation spectrum than the complete responsive CR patient sample, which was associated with the upregulation of MHC II genes. To validate this observation, we extend our evaluation by integrating scRNA-seq data from two additional 4-1BB HD samples (HD-L1 and HD-L2) in literature that share similar experimental settings with ours.11 The CAR T cells that generated with the same approach by transduction of a CD19 targeting 4-1BB-CD3 ζ construct were used in the literature work, and both the basal condition and CD19-specific stimulated CAR T cells were evaluated.
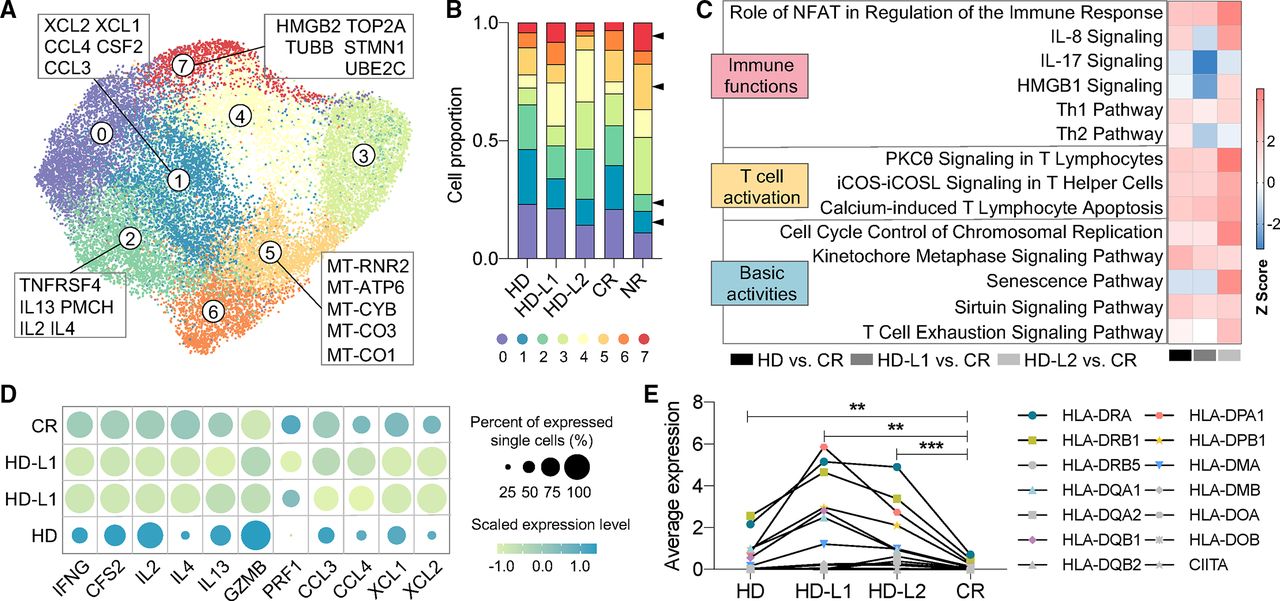
While the clustering analysis of basal CAR T can differentiate each sample based on some inherent cell fundamental activities (online supplemental figure S14A–C), the integrated characterization of antigen-specific activated CAR T cells further identified eight clusters, consisting of two functional subpopulations that highly express chemokine or cytokine genes (clusters 1 and 2) and two inactive subsets with the identity of HMGB2-marked proliferation or mitochondrial biogenesis (clusters 5 and 7) (figure 6A and online supplemental figure S15). Unsurprisingly, the proportion of NR CAR T cells in clusters 1 and 2 was apparently lower than of CR or donor samples and that in cluster 5 or 7 was significantly higher (figure 6B). Based on the aforementioned observation that the HD sample has more enhanced activation level than CR cells, we pursued an assessment in HD-L1 and HD-L2 through comparing the signaling pathways regulated by the DEGs between each donor and the CR. We found that the major pathways representing T cell activation were upregulated in all three donors, whereas the donor-to-donor variability in immune functions was always observed (figure 6C), which could be caused by a heterogeneous expression profiles of the functional molecules (figure 6D). Notably, when focusing our analysis on a full set of MHC II-defining genes, CAR T cells from both HD and the literature samples showed significantly increased expression levels than the responsive CR (figure 6E), demonstrating the validity of the finding from our CAR T cell samples.

Integrated analyses identify the upregulation of MHC II genes among functional heterogeneities in two more literature-derived activated donor samples. (A) UMAP clustering of two more literature-derived activated 4-1BB donor samples. The top five DEGs of specific clusters were displayed. (B) Proportion of cells from each sample in each cluster. HD-L1 and HD-L2 represent literature-derived samples. (C) Signaling pathways regulated by DEGs generated through comparing each donor sample with CR sample.
z
score reflects the predicted activation level ( , inhibited;
  activated;
  or
or  can be considered significant). (D) Dot plot of functional genes expression in CR and three donor samples. (E) Expression level comparisons of a full set of MHC II defining genes between three donor samples and CR. Each data point represents the average expression level of all the single cells of each gene. CR, complete remission; DEGs, differentially expressed genes; HD, healthy donor; MHC, major histocompatibility complex; NR, non-responder; UMAP, uniform manifold approximation and projection.
Direct comparison with CD28 CAR T highlights memory signatures in basal 4-1BB cells
Our work aims to delineate the cellular and molecular 4-1BB CAR T landscape from a single-cell multiomics view. To further elucidate the distinguishable transcriptomic and phenotypic signatures of these CAR T cells from those with different costimulatory domains, we applied our single-cell multiomics profiling pipeline to directly compare the HD sample to a donor-derived sample constructed with CD28 costimulatory domain, which is the other broadly used second-generation CAR T product. Through integrated analysis of the data from two samples at basal state, we generated the unsupervised UMAP projection, where we observed separation of 4-1BB CAR T cells from the CD28 counterparts (figure 7A). Specifically, clusters 0 and 1 were mainly occupied by CD28 cells, and a majority of 4-1BB cells were distributed in clusters 2, 3, and 4 (online supplemental figure S16A). However, except for the activation/inhibition level of some fundamental biological activities and cell cycle regulations, no unique functional differences were observed in these clusters (online supplemental figure S16B). For both CD28 and 4-1BB samples, a small fraction of cells in clusters 5 and 6 were highly activated with respect to the Th1 and Th2 pathways, suggesting the tonic signaling events (online supplemental figure S16B). To determine whether any genes were specific to the 4-1BB cells, we further compared the DEGs between the two samples. Among the most differentially expressed genes, three TCM or TSCM associated gene symbols, including CCR7, SELL, and TCF7, were upregulated in 4-1BB CAR T cells (figure 7B). Consistently, the expression of the three genes was enriched in clusters 2, 3, and 4 (figure 7C), in which the cellular protein expression level of ADT-CCR7 and ADT-CD62L was also significantly higher than that in other subsets (figure 7D). All of these data highlighted the predominance of enhanced memory phenotype in 4-1BB CAR T as compared with CD28 CAR T.

Comparison with CD28 CAR T cells identifies the enhanced memory signature in basal 4-1BB CAR T cells. (A) UMAP clustering of donor 4-1BB and CD28 CAR T cells at basal condition identified the separate cluster distribution of the two CAR T samples. (B) Upregulated or downregulated DEGs of directly comparing 4-1BB CAR T with CD28 CAR T sample. (C) The expression of memory T cell related genes in identified clusters. The numbers at lower left indicate the average expression level of all the single cells of specific gene in each sample. (D) The distribution of surface protein ADT-CCR7 and ADT-CD62L expression revealed by CITE-seq. CAR, chimeric antigen receptor; DEGs, differentially expressed genes; UMAP, uniform manifold approximation and projection.
Discussion
Impressive clinical results have been reported after administration of CD19-BB-3 ζ CAR T cells, and the feasibility and safety of ‘off-the-shelf’ allogenic CAR T products are currently tested in clinical trials. However, so far, the intrinsic heterogeneity and function of these HD-derived CAR T cells have not been systematically evaluated and compared with patient samples. Taking the advantages of single-cell multiomics technology and canonical signaling pathway analysis, we have uncovered significant differences in the transcriptional, phenotypic, functional, and metabolic profiles of CAR T cells at basal or following antigen-specific activation, as well as between donor and patient groups.
Through pooled clustering analysis, we found that all the evaluated conditions broadly expressed CRBN, a gene that has been extensively studied because it is involved in multiple effects of immunomodulatory drugs (IMiDs). By modulating the activity of E3 ubiquitin ligase complex cereblon (encoded by CRBN), lenalidomide (LEN)—one of the FDA-approved IMiDs—has been shown to increase antitumor immune responses in the treatment of multiple myeloma and mantle cell lymphoma.59 Previous study has verified LEN can enhance the antilymphoma efficacy of CD19-targeted CAR T therapy through direct effects on T cells but not on B-lymphoma cells.60 To the best of our knowledge, no combined IMiD and CAR T immunotherapy has been reported in the treatment of ALL. By making use of the revolutionized scRNA-seq in identifying subtle heterogeneities, our data suggest that IMiD could be a complementary therapeutic approach to augment leukemia clearance ability or even convert CAR T resistant patients into responders.
TCM or TSCM cells maintaining high proliferative capacity are known to promote sustained persistence after adoptive T cell transfer and to deliver satisfactory treatment efficacy.5 6 Our multiomics data found that, at basal condition, HD and CR CAR T cells preserved significantly more TSCM and TCM cells, whereas the TSCM proportion in NR patient was extremely low. On CD19-specific activation, the proportion of TCM cells in these two groups was still the highest among all the T cell subtypes. This phenotypic signature provides a path to optimize the manufacturing process to select donors with certain T cell subtypes and to optimize the ratio. We also observed that, when directly comparing the basal 4-1BB CAR T with another donor CD28 CAR T sample through unbiased clustering analysis, the memory-related genes, including CCR7, SELL, and TCF7, were highly upregulated in 4-1BB cells. These data collectively explained the superior persistence of 4-1BB costimulatory domain-containing CAR T cells than those containing a CD28 domain indicated by both preclinical reports and clinical experience.28 61–63 However, our previous single-cell transcriptional profiling of the third-generation anti-CD19 4-1BB/CD28/CD3ζ CAR T revealed that TN and TEF were major populations in the activated cells,56 further suggesting that the costimulatory domain built into each unique CAR construct impacts a lot to the CAR T cell persistence.
Multifunctional heterogeneity of CD19-BB-3 ζ CAR T cells has been revealed by single-cell multiplexed proteomic method, and clear distinctions in the range of cytokine/chemokine profiles across each of four HDs were identified.64 Here, we showed that antigen-specific stimulation could unveil CAR T intrinsic characteristics including their activation mechanisms, metabolic activities and cytokine production. While activated allogeneic HD cells shared substantial similar features with CR patient CAR T, we were still able to identify their subtle difference that HD cells obtained inclusively enhanced activation profiles in comparison with CR cells on CD19-3T3 stimulation, indicating their potential stronger and more rapid antitumor response after infusion. Tracing back to the root, we found this potent functionality was highly correlated with upregulated expression of MHC II genes, which was further validated in two additional donor scRNA-seq datasets obtained from literature. This finding leads to one concern that the upregulation could result in more rapid elimination of allogeneic products by the host immune system. We also found HD cells expressed more ADT-HLA-DR surface molecule than the CR sample. However, different HDs may differ in the activation markers including HLA-DR depending on their functional status, and hence further studies in larger cohorts are indispensable to determine whether this observation is a universal phenotypic feature.
Another inherent superiority we observed in donor CAR T cells was that they produced less CSF2 than remission achieved patient sample. Since elevated CSF2 level has been confirmed as a stimulator to CRS,57 our data suggest this toxicity issue might be better managed by using allogeneic therapy. A recent retrospective study reviewed 31 ALL patients who received autologous (n=17), donor-derived allogeneic (n=3) or allogeneic hematopoietic stem cell transplantation recipient-derived (n=11) CAR T treatment.65 It was identified that the two allogeneic groups had significantly fewer patients with severe CRS (grade >=3) than the autologous group (p=0.049). Our analysis, although yet to be fully validated in the trial, might explain this clinical observation by the dissection of single-cell molecular mechanisms and may pave the way for further inquiry of the strategies to improve allogeneic CAR-T cell therapy.
A number of factors might contribute to the remission induction failures, here we found that the cell intrinsic programs were dramatically different in CR and NR CAR cells. Despite their impaired capacity to induce activation surface markers on CAR stimulation, NR cells exhibited a proliferative burst into effector-like properties at rest and rapidly acquired highly differentiated signatures after activation. While GZMB, IFNG, and PRF1 were normally detected in NR cells, we found significant deficiency in CCL3, CCL4, XCL1, and XCL2 production, which were identified as constitutional functional subsets of 4-1BB CAR T cells through our pooled unsupervised analysis. Considering these molecules have important roles in recruiting DC or NK cells, this observation also implies that failed enrolment of other immune members might be responsible for the primary resistance to CAR T therapy. Furthermore, our evaluation of metabolic gene sets unambiguously demonstrated that, either at rest or activated state, NR cells tended to use aerobic glycolysis as their nutrient consumption modality, rather than OXPHOS. Overall, our studies unveil some intrinsic defects contained in NR cells, thereby have consequential clinical implications to predict response or reverse therapeutic failure.
This work was not without limitations. Due to restricted access to patient CAR T preinfusion products, we only analyzed one sample in each condition and no statistical significance could be provided. Therefore, the results cannot exclude the possibility of patient-specific features contributing to the transcriptome profiles. However, through integrated multiomics profiling and unbiased clustering analyses, our data delineated the global cellular and molecular CAR T landscape, identified the characteristics of 4-1BB CAR tonic signaling, illuminated the disparities of CAR T cells generated from different origins, and unveiled the associations between CSF2 expression and CAR T activation level. In conclusion, the explicit insights from this study further broaden our understanding of remission-related mechanisms, shedding light on the pathways of ameliorating clinical outcomes and the development of effective ‘off-the-shelf’ allogeneic products.
Data availability statement
All the data presented in this study are available on reasonable request to the corresponding authors.
Ethics statements
Ethics approval
The protocols were approved by the institutional review board of the Children’s Hospital of Philadelphia.
Acknowledgments
The authors would like to thank Drs Lei Wang and Yong Sun for their help with microfabrication.
References
Supplementary materials
Supplementary Data
This web only file has been produced by the BMJ Publishing Group from an electronic file supplied by the author(s) and has not been edited for content.
Supplementary Data
This web only file has been produced by the BMJ Publishing Group from an electronic file supplied by the author(s) and has not been edited for content.
Footnotes
Twitter @gruppsteve, @rongfan8
JJM and RF contributed equally.
Contributors Conceptualization: RF, JJM, and CHJ; methodology: ZB, RF, and JJM; experimental investigation: ZB, SL, and DK; data analysis: ZB, SW, and PGC; resources: ZB, SL, DMB, RMM, SAG, and MVM; writing – original draft: ZB, RF, and JJM; writing – review and editing: all the authors.
Funding The research was supported by Stand-Up-to-Cancer Convergence 2.0 Grant (to RF) and the Packard Fellowship for Science and Engineering (to RF). This material is based on work supported under a collaboration by Stand Up To Cancer, a program of the Entertainment Industry Foundation and the Society for Immunotherapy of Cancer. The microfluidic devices were fabricated in the Yale School of Engineering and Applied Science Cleanroom and Yale West Campus Cleanroom. The sequencing service was conducted at Yale Stem Cell Center Genomics Core Facility, which was supported by the Connecticut Regenerative Medicine Research Fund and the Li Ka Shing Foundation or Yale Center for Genomics Analysis. Computational data analysis was conducted with the Yale High Performance Computing clusters (HPC).
Competing interests RF is a cofounder of IsoPlexis, Singleron Biotechnologies and AtlasXomics and a member of their scientific advisory boards with financial interests, which could affect or have the perception of affecting the author’s objectivity. The interests of RF were reviewed and managed by Yale University Provost’s Office in accordance with the University’s conflict of interest policies.
Provenance and peer review Not commissioned; externally peer reviewed.
Supplemental material This content has been supplied by the author(s). It has not been vetted by BMJ Publishing Group Limited (BMJ) and may not have been peer-reviewed. Any opinions or recommendations discussed are solely those of the author(s) and are not endorsed by BMJ. BMJ disclaims all liability and responsibility arising from any reliance placed on the content. Where the content includes any translated material, BMJ does not warrant the accuracy and reliability of the translations (including but not limited to local regulations, clinical guidelines, terminology, drug names and drug dosages), and is not responsible for any error and/or omissions arising from translation and adaptation or otherwise.