Article Text

Abstract
Background Talimogene laherparepvec (T-VEC), an oncolytic virus, was designed to selectively replicate in and lyse tumor cells, releasing tumor-derived antigen to stimulate a tumor-specific immune response.
Methods In this phase II study in patients with unresectable stage IIIB–IV melanoma, we evaluated non-injected lesions to establish whether baseline or change in intratumoral CD8+ T-cell density (determined using immunohistochemistry) correlated with T-VEC clinical response.
Results Of 112 enrolled patients, 111 received ≥1 dose of T-VEC. After a median follow-up of 108.0 weeks, objective/complete response rates were 28%/14% in the overall population and 32%/18% in patients with stage IIIB–IVM1a disease. No unexpected toxicity occurred. Baseline and week 6 change from baseline CD8+ T-cell density results were available for 91 and 65 patients, respectively. Neither baseline nor change in CD8+ T-cell density correlated with objective response rate, changes in tumor burden, duration of response or durable response rate. However, a 2.4-fold median increase in CD8+ T-cell density in non-injected lesions from baseline to week 6 was observed. In exploratory analyses, multiparameter immunofluorescence showed that after treatment there was an increase in the proportion of infiltrating CD8+ T-cells expressing granzyme B and checkpoint markers (programmed death-1, programmed death-ligand 1 (PD-L1) and cytotoxic T-lymphocyte antigen-4) in non-injected lesions, together with an increase in helper T-cells. Consistent with T-cell infiltrate, we observed an increase in the adaptive resistance marker PD-L1 in non-injected lesions.
Conclusions This study indicates that T-VEC induces systemic immune activity and alters the tumor microenvironment in a way that will likely enhance the effects of other immunotherapy agents in combination therapy.
Trial registration number NCT02366195.
- biomarkers
- tumor
- immunotherapy
- melanoma
- oncolytic virotherapy
- T-lymphocytes
Data availability statement
Data are available on reasonable request. Qualified researchers may request data from Amgen clinical studies. Complete details are available at the following: https://www.amgen.com/science/clinical-trials/clinical-data-transparency-practices/clinical-trial-data-sharing-request/.
This is an open access article distributed in accordance with the Creative Commons Attribution Non Commercial (CC BY-NC 4.0) license, which permits others to distribute, remix, adapt, build upon this work non-commercially, and license their derivative works on different terms, provided the original work is properly cited, appropriate credit is given, any changes made indicated, and the use is non-commercial. See http://creativecommons.org/licenses/by-nc/4.0/.
Statistics from Altmetric.com
Background
Talimogene laherparepvec (T-VEC) is an intratumorally injected herpes simplex virus-1 (HSV-1)-derived oncolytic immunotherapy.1 2 Based on data from the phase III OPTiM (Oncovex (GM-CSF) Pivotal Trial in Melanoma) study,3–5 T-VEC was the first oncolytic virus to be approved in the United States6 and Europe.7 T-VEC selectively replicates within tumor cells, resulting in cell lysis; this leads to release of tumor-specific antigens as well as new viral particles, which can infect other nearby tumor cells.1 8 Local expression of virally encoded granulocyte-macrophage colony-stimulating factor (GM-CSF)1 8 is postulated to enhance the recruitment of antigen-presenting cells, including dendritic cells. These antigen-presenting cells take up released tumor-specific antigens and mature as a result of contact with innate immune danger signals. Maturing dendritic cells with endocytosed tumor-derived antigens migrate to draining lymph nodes and present these antigens to T-cells, including to cytotoxic CD8+ T-cells. After expansion of relevant T-cell clones in draining lymph nodes, they enter the circulation to act regionally and systemically to destroy cells expressing the same tumor antigens.1 8–13 Thus, T-VEC is believed to act through a mechanism comprising direct oncolytic activity and stimulation of local innate and systemic adaptive immune responses, which then confers distant antitumor effects.1 8–13
This mechanism of action (MOA) has been explored in preclinical tumor models. In preclinical studies with a syngeneic B-cell lymphoma tumor model (A20), administration of OncoVEXmGM-CSF, an HSV-1 modified similarly to T-VEC (but with murine GM-CSF), led to complete regression of all injected tumors and ~50% of contralateral, non-injected tumors, supporting the hypothesis that the therapy induces a systemic antitumor immune response.8 Furthermore, a significant increase in tumor-specific T-cells was observed in injected and contralateral tumors.8 In a D4M3A melanoma murine model (a low-STING-expressing melanoma model that is resistant to anti-programmed death-1 (PD-1) treatment), therapeutic responses were observed with T-VEC in injected and non-injected tumors.11 Additionally, T-VEC was able to recruit viral and tumor antigen-specific CD8+ T-cells and induce a proinflammatory gene signature.11
However, to date, the MOA has not been fully demonstrated in patients, and human tumoral adaptations remain unclear. Data reported by Ribas et al (n=21) suggested that T-VEC can increase immune infiltration in tumors; however, the biomarker results were derived from both injected and non-injected lesions, with only a small subset of the patients from whom non-injected lesions were examined (n=6).9 In the current study, we sought to clinically confirm the systemic immune effects of T-VEC by characterizing changes in the tumor microenvironment during T-VEC treatment in a sizeable number of patients with melanoma (stage IIIB–IVM1c). Exploratory analyses included measurement of changes in various immune cells from non-injected lesions, including CD8+ T-cells, helper T-cells (CD4+) and macrophages, as well as CD8+ T-cells expressing granzyme B and checkpoint markers (eg, PD-1, programmed death-ligand 1 (PD-L1) and cytotoxic T-lymphocyte antigen-4 (CTLA-4)). This is thus the first clinical study to evaluate the systemic immune response with T-VEC monotherapy. This is important as it has been established that the concentration and type of immune cells infiltrating the tumor microenvironment alter the course of melanoma, regardless of treatment.14 Furthermore, an understanding of treatment-related tumor microenvironment adaptations may support a rational approach to combinatorial strategies.
Additionally, the study investigated potential predictors of response to T-VEC, which could ultimately be used to stratify patients. For other immunotherapies, such as anti-PD-1 agents, several predictive biomarkers have been identified and continue to be investigated, including immune cell infiltration in the tumors (including CD8+ T-cells), PD-L1 expression and mutational burden.15–20 High levels of CD8+ T-cells and tumor-infiltrating lymphocytes, tumor mutational burden and expression of PD-L1 before starting treatment all partially correlate with the therapeutic efficacy of anti-PD-1 therapies in patients with melanoma and/or other cancers.21–24 However, biomarkers predicting clinical response to T-VEC have not yet been investigated. A key objective of the current study was to determine the relationship between baseline intratumoral CD8+ T-cell density in patients with melanoma treated with T-VEC and clinical outcome (primary endpoint). We also assessed the correlation between clinical response and: baseline PD-L1 expression; change in intratumoral CD8+ T-cell density in non-injected lesions (6 weeks after treatment); and change in PD-L1 expression (6 weeks after treatment).
Methods
Study design and patients
This phase II, open-label, single-arm study (T-VEC-325) was conducted at 36 sites in 12 European countries. Eligible patients were aged ≥18 years with histologically confirmed unresectable stage IIIB–IV melanoma; Eastern Cooperative Oncology Group (ECOG) performance status ≤1; serum lactate dehydrogenase (LDH) ≤1.5× upper limit of normal and with adequate organ function. Patients were required to have melanoma lesions (cutaneous, subcutaneous or nodal) appropriate for intralesional injection, defined as ≥1 lesion with a diameter of ≥10 mm or multiple lesions with a combined diameter of ≥10 mm and ≥1 melanoma lesion that could be accurately and serially measured by clinical (caliper) assessment or by contrast-enhanced or spiral CT scan, MRI or ultrasound for nodal/soft-tissue disease (including lymph nodes). Patients with >3 visceral lesions (excluding lung or nodal metastases associated with visceral organs), primary ocular or mucosal melanoma, bone metastases, or active cerebral metastases were excluded. Full inclusion/exclusion criteria are listed in online supplemental table 1. Study procedures were approved by the institutional review boards or ethics committees for each participating site. All patients provided written informed consent.
Supplemental material
Study drug administration
T-VEC was administered by intralesional injection, with or without image ultrasound guidance, using the dosing regimen described in the registrational phase III OPTiM study.4 If there were ≥2 lesions at baseline, one (the lowest priority lesion for injection) was left non-injected.
Treatment continued until one of the following occurred: complete response (CR); all injectable tumors disappeared; clinically significant (resulting in clinical deterioration or requiring change of therapy) disease progression (as per modified WHO response criteria25); or intolerance of study treatment. Treatment continued for ≥6 months from initial dosing, regardless of progression (provided that treatment was tolerated). Patients were followed for safety for 30 days after the last dose and for survival for up to 24 months after the last patient was enrolled.
Assessments
Online supplemental table 2 details the schedule of assessments.
CD8 and PD-L1 immunohistochemistry
Baseline tumor biopsies were performed on one lesion before treatment (within 5 days of day 1 of week 1). Week 6 tumor biopsies were performed on a non-injected lesion following two T-VEC doses (within 7 days before the third dose; day 1 of week 6). The non-injected lesion biopsied at week 6 had to be a different lesion to that biopsied at week 1. No additional biopsies were collected after week 6. Samples were fixed in formalin and embedded in paraffin. H&E staining was used to identify tumor areas.
The CD8+ T-cell density in the overall tumor areas, invasive margins, and center of tumor areas was determined by immunohistochemistry (IHC) using an anti-CD8 mouse monoclonal antibody (clone C8/144B), red chromogen and automated cell counting, as previously reported.9
PD-L1 IHC (clone E1L3N) was similarly performed using H&E to define tumor areas. PD-L1 expression was assessed for the entire tumor area, with the percentage of all cells staining positive for PD-L1, and the maximum PD-L1 staining level observed in each sample reported.9
Multiparameter immunofluorescence
To more broadly characterize tumor microenvironment changes after T-VEC treatment, a subset of paired baseline and week 6 biopsies were analyzed by multiparameter immunofluorescence, using previously described methods.9 Specific markers used for characterization are listed in online supplemental table 3 (including macrophages (CD68+) helper T-cells (CD3+ CD4+), effector cytotoxic T-lymphocytes (CD3+ CD8+) and cytotoxic lymphocytes expressing PD-1, PD-L1, CTLA-4 and/or granzyme B). CD8 clone C8/144B and PD-L1 clone SP142 were used in the multiparameter immunofluorescence study.
Clinical response
Assessments used to determine clinical response included: objective response rate (ORR), duration of response (DOR), durable response rate (DRR), changes in tumor burden, time to treatment failure (TTF) and overall survival (OS). All patients were assessed at screening and every 3 months by radiographic tumor imaging (CT, positron emission tomography (PET), PET-CT, MRI or ultrasonography) and clinical tumor assessment (ruler or caliper measurement). The best modality for objective measurement of each lesion was used for tumor response assessments, with radiographic imaging as the preferred option whenever possible. Response was evaluated per modified WHO criteria,25 as previously reported.3 4 Responses were assessed by investigator, and were not centrally confirmed. For the assessment of tumor burden, up to 10 lesions were selected at baseline for measurement. These index lesions were chosen based on their size (those with the longest bidimensionally perpendicular diameters) and suitability for repeated measurements. The sum of the products of the two largest of perpendicular diameters (SPD) of all index lesions was recorded. At each tumor assessment, the SPDs of the index lesions were added together to give the total tumor burden.
Time to treatment failure
TTF was calculated from first dosing until whichever of the following occurred first: (1) clinically relevant disease progression; (2) death from any cause and (3) non-clinically relevant disease progression associated with a requirement for alternative therapy as the reason for ending treatment or start of new anticancer therapy.
Adverse events
Adverse events (AEs) occurring between the first administration of T-VEC and 30 days after last treatment were graded according to the National Cancer Institute Common Terminology Criteria for AEs V.3.0. Cold sores, vesicles and other lesions of suspected herpetic origin were swabbed for quantitative PCR analysis to evaluate the presence or absence of detectable T-VEC DNA and summarized descriptively.
Statistical analyses
The primary analysis was performed once all patients had the opportunity to complete 12 months of treatment (data cut-off date: June 27, 2017). A longer-term analysis was also conducted based on a data cut-off date of January 27, 2020. A final planned analysis will be completed once all patients have completed treatment with T-VEC (as of March 15, 2020, three patients were still receiving T-VEC). Unless otherwise stated, the safety and efficacy analyses were conducted on the safety analysis set, which included all patients who received ≥1 T-VEC dose.
The planned population size was 110 patients. It was anticipated that 100 patients (91% of the study population) would be evaluable for baseline intratumoral CD8+ T-cell density. This provided 88% power to detect a positive association between CD8+ T-cell density and ORR, using a one-sided Fisher’s exact test at a 5% nominal level to explore the hypothesis that the response rate is equal regardless of baseline intratumoral CD8+ T-cell density (assuming the true response rate is 13% in the biomarker low subgroup, and 40% in the biomarker high subgroup). Based on a sample size of 110 patients and assumption of an ORR of ~30%,4 the expected width of the 95% CI is ~18%.
It was assumed that 55 patients (~50% of the study population) would be evaluable for changes from baseline in CD8+ T-cell density in non-injected lesions. Pearson’s correlation coefficient (r) was estimated between change in CD8+ T-cell density and the maximum decrease in index lesions. With 55 evaluable patients, a value of r≤0.30 would be rejected at a nominal one-sided 5% significance level with an observed r>0.49 for which the power would be >80% given a true value for r≥0.60.
To assess the correlation between clinical response and baseline or change from baseline in intratumoral CD8+ T-cell density, univariate logistic regression models were used for ORR and DRR; Cox proportional-hazards regression models were used for DOR, OS, and TTF. A log2 transformation was taken on the original scale of CD8+ T-cells in continuous variable analyses. Scatter plots and a 95% CI for Pearson’s correlation coefficient were provided between the baseline/change in log2(CD8+) T-cell density and the maximum decrease in measurable tumor burdens. A trend test was performed to assess whether outcomes changed according to ordered CD8+ T-cell density categories defined by distribution quartiles. Fisher’s exact test was used to determine whether response rates positively correlated with a high baseline immunoprofile defined with each distribution quartile as a cut-off. Multivariate models were used to evaluate possible confounding effects of baseline covariates, such as disease stage, ECOG score, LDH elevation and line of therapy.
Analysis of % PD-L1 positivity by IHC and association with response was performed in a similar manner to CD8 IHC; however, PD-L1 results were not transformed before analysis (further methodology provided in footnote to online supplemental figure 2). Likewise, analysis of multiparameter immunophenotyping results and associations with clinical response were also modeled in a similar way, although multiparameter immunophenotyping results were transformed before modeling.
All analyses of immune infiltrates and PD-L1 were descriptive; no formal hypothesis was tested. For continuous variables, mean, SD, median, first and third quartiles, minimum and maximum were calculated; for categorical variables, frequency count and percentage were calculated.
OS, DOR and TTF were summarized by Kaplan–Meier methods.
Results
Baseline characteristics
Between April 7, 2015 and June 27, 2017, 112 patients were enrolled, 111 of whom were included in the safety analysis set. Baseline characteristics are shown in table 1. Most patients (76%) had stage IIIB–IVM1a disease (13% stage IIIB, 29% stage IIIC, 34% stage IVM1a). Approximately half of patients had received prior anticancer therapy, with 28 previously receiving ≥1 checkpoint inhibitor (ipilimumab (n=22), nivolumab (n=9) or pembrolizumab (n=7)). Further details of these patients have been reported previously.26
Patient baseline demographics and clinical characteristics
Primary analysis
At the data cut-off for the primary analysis, 79 patients remained on study (online supplemental table 4). The median (IQR) duration of follow-up was 59.0 (52.1–68.9) weeks, with a median treatment duration of 25.1 (0.1–83.9) weeks.
Efficacy outcomes
Responses and response rates by baseline characteristics (including ECOG score, LDH and line of therapy) are shown in table 2. The ORR was 27% in the overall population and 31% in patients with stage IIIB–IVM1a disease. Of 100 patients with measurable disease, a maximum reduction in baseline tumor burden of ≥50% was reported in 38% of patients. Treatment failure was recorded in 69 (62%) patients. Median TTF was 8.1 months. Twenty-six deaths occurred by the primary analysis. Median OS was not estimable.
Responses overall and according to baseline characteristics
IHC findings
Baseline and change in CD8+ T-cell density
Baseline and week 6 change from baseline CD8+ T-cell density results were available for 91 (81%) and 65 (58%) patients, respectively. In some samples, both at baseline and at week 6, the tumor content was insufficient for data to be obtained. Additionally, week 6 samples were not collected from all patients.
At baseline, the mean intratumoral CD8+ T-cell density was 460 cells/mm2 (range 5–3963). The mean log2(CD8+) T-cell density at baseline was 8.04 (range 2.32–11.95; a log transformation was applied due to skewed data). In non-injected lesions, a 2.41-fold median increase (95% CI 1.64 to 4.77) in CD8+ T-cell density was observed from baseline to week 6 (p<0.0001; the underlying distribution of values was skewed, therefore median values are presented for change in CD8+ T-cell density) (figure 1A, B).
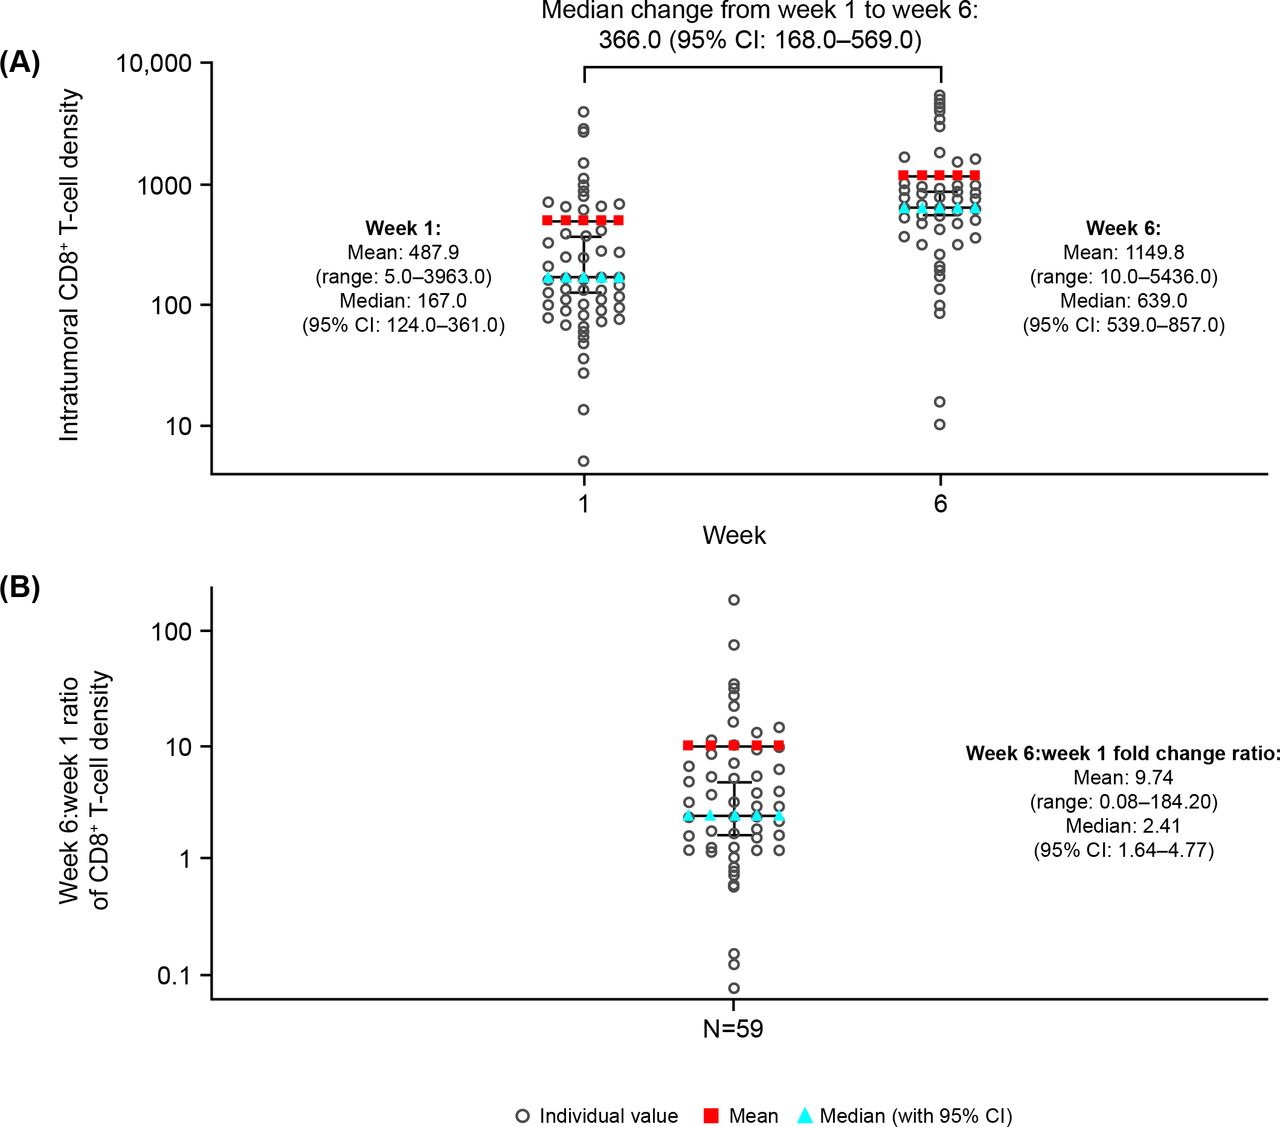
Changes in intratumoral CD8+ T-cell density according to the primary analysis (biomarker evaluable analysis set; n=59). (A) Scatter graph showing intratumoral CD8+ T-cell density at baseline and week 6 in non-injected lesions. (B) Scatter graph showing week 6/week 1 ratio of intratumoral CD8+ T-cell density in non-injected lesions. Biomarker valuable analysis set for non-injected lesions includes all subjects in the safety analysis set who had the intratumoral CD8+ cell density recorded at baseline and week 6, and the week 6 measurements from the injected lesion.
Tumor-infiltrating cell location has previously been shown to influence clinical outcome.14 27 Exploratory analysis showed that mean log2(CD8+) T-cell density at baseline in invasive margin and center of tumor areas was 8.52 (range 3.91–11.61) and 7.34 (range 0.00–11.73), respectively (online supplemental figure 1A, C). From baseline to week 6, in non-injected lesions, there was a 2.07-fold median increase (95% CI 1.73 to 3.39) in CD8+ T-cell density in invasive margin areas and a 2.19-fold median increase (95% CI 1.48 to 36.55) for center of tumor areas (online supplemental figure 1B, D).
Association between intratumoral CD8+ T-cell density and clinical outcome
Among 91 eligible patients, baseline CD8+ T-cell density did not correlate with ORR or DRR (table 3). Trend tests showed no significant differences in ORR or DRR across quartile categories of baseline CD8+ T-cell density. There were no statistically significant differences in ORR or DRR between subgroups defined by low vs high baseline CD8+ T-cell density (with ‘high’ defined as being at or above a quartile). No correlation was observed between baseline CD8+ T-cell density and DOR, maximum decrease in measurable tumor burden, OS or TTF (table 3).
Relationship between CD8+ T-cell density at baseline/during treatment and efficacy endpoints following treatment with talimogene laherparepvec
Acknowledging the small sample size (n=59), change (weeks 1 to 6) in CD8+ T-cell density did not correlate with ORR or DRR (table 3). There were no statistically significant differences in ORR or DRR across quartile categories of change in CD8+ T-cell density or between subgroups defined by low vs high baseline CD8+ T-cell density. Similarly, no correlation was observed between change in CD8+ T-cell density and DOR, maximum decrease in measurable tumor, OS or TTF (table 3). Exploratory analysis revealed no association between change in CD8+ T-cell density during treatment (in the invasive margin and center of tumor regions) and clinical outcomes.
Baseline and change in PD-L1
For non-injected lesions, PD-L1 staining results were available for 77 subjects at baseline, 55 at week 6, and 50 at both baseline and week 6 (paired samples). Regarding the baseline samples, PD-L1 staining was not detectable for 71% (55/77) and the percentage of cells staining positive for PD-L1 ranged from 1% to 85%. Among the week 6 samples, 47% (26/55) were PD-L1 negative, and staining ranged from 1% to 100%. For the 50 paired samples, PD-L1 was not detected in 40 of the baseline samples, nor in 23 of the week 6 samples. Out of 40 patients with paired samples who were PD-L1 negative at baseline, 19 (48%) became PD-L1 positive and 21 (53%) remained PD-L1 negative. PD-L1 positive status increased from 20% before treatment to 54% afterwards (p=0.00021, McNemar’s test). Among the paired samples, the least squares mean estimate of absolute increase of PD-L1 % positive in non-injected lesions between baseline and week 6 was 7.86% (p=0.0072). In a sensitivity analysis, the PD-L1 % positive increase was estimated to be 8.39% between baseline and week 6 (p=0.021), and independent of baseline (p<0.05), distance from injection site and fixation time (p<0.05).
Association between PD-L1 and clinical outcome
While the number of samples was small, baseline PD-L1 % positive did not correlate with ORR (OR 1.03; 95% CI 1 to 1.07; p=0.075) but did appear to correlate with DRR (OR 1.06; 95% CI 1.02 to 1.11; p=0.0070) (online supplemental figure 2). Change in PD-L1 % positive did not correlate with ORR (OR 1.02; 95% CI 0.99 to 1.05; p=0.24) or DRR (OR 0.99; 95% CI 0.94 to 1.04; p=0.70). Neither baseline nor change in PD-L1 % positive were associated with DOR, OS, TTF or best tumor burden change.
Multiparameter immunofluorescence findings
Changes in the tumor environment according to multiparameter immunofluorescence
An additional survey of infiltrating immune cells was conducted for 25 paired baseline/week 6 biopsies by multiparameter immunofluorescence. A total of 172 overlapping cell populations were analyzed from the immunofluorescence analysis. Infiltration of T-cells, including granzyme B+ effector CD8+ T-cells and CD4+ T-cells, but not macrophages, was significantly increased by T-VEC in non-injected lesions (figure 2A). Tumor-infiltrating CD8+ T-cells generally had a memory phenotype (CD45RO+) and many expressed immune checkpoint markers PD-1 and CTLA-4. There was a threefold increase in intratumoral cytotoxic T-lymphocytes expressing PD-1 (p=0.0002) and CTLA-4 (p=0.0023) in non-injected tumors (figure 2A). We previously reported an increase in granzyme B+ CD56+ CD3− natural killer (NK) cells as part of this study.26 Further image review revealed that the NK cell marker (CD56) was also expressed by melanoma cells. Therefore, follow-up studies are planned to clarify the role of NK cells.

(A) Changes in intratumoral density of immune cell subsets from baseline to week 6 in non-injected lesions (based on 25 paired baseline to week 6 biopsies). (B) Immunofluorescence image examples from non-injected melanoma lesions, before and after starting treatment with T-VEC (from a patient exhibiting a durable response). CD3+ T-cells are shown in red; CD68+ macrophages in blue; PD-L1 cells in green; and S100+ melanoma cells in gray. aFold increase from baseline to week 6, analyzing number of positive cells per square millimeter within the tumor region. bP values were calculated using a visit level contrast from a linear model of visit and subject ID, where immunofluorescence results (based on 25 paired baseline/week 6 biopsies) were first transformed with a base 2 version of arcsinh: log2((z + (z2+1)1/2)/2). CTLA-4, cytotoxic T-lymphocyte antigen-4; CTL, cytotoxic T-lymphocyte; PD-L1, programmed death-ligand 1; T-VEC, talimogene laherparepvec.
In the tumor microenvironment, PD-L1 can be expressed by both tumor and immune cells, including T-cells and macrophages. In non-injected lesions, PD-L1 expression on cytotoxic T-lymphocytes increased threefold (p=0.0024) from week 1 to week 6 (figure 2A). Pretreatment/posttreatment tumor biopsy immunofluorescence examples are shown in figure 2B and online supplemental figure 3). Spatial analysis demonstrated that T-cells were often in close proximity to macrophages expressing PD-L1 (online supplemental figure 4).
Association between multiparameter immunofluorescence and clinical outcome
There were several trends (nominal p value ≤5%) for an association between the multiparameter immunofluorescence analytes of interest and responses with T-VEC. However, due to the limited available data and increased chance of false discovery due to multiple testing, associations with clinical outcome require further investigation.
Safety and tolerability
Table 4 summarizes AEs. Most (91%) treatment-related AEs (TRAEs) were grade 1/2 in intensity. The most frequent TRAEs were fever (48%), chills (26%) and influenza-like illness (23%). TRAEs of grade ≥3 occurred in 10 patients (9%) and TRAEs led to permanent discontinuation of treatment in three patients (3%). Treatment-related serious AEs occurred in eight patients: fever (n=2), cytokine release syndrome, hemoptysis, medical observation (hospitalization for grade 1 dizziness, nausea and pain), pain in extremity, malignant peripheral nerve sheath tumor and tumor hemorrhage (n=1 each).
Summary of AEs (safety analysis set)
Longer-term analysis
At the data cut-off for the longer-term analysis, five patients remained on study (online supplemental table 4). The median (IQR) duration of follow-up was 108.0 (53.1–122.4) weeks, with a median treatment duration of 25.1 (11.1–49.1) weeks.
Efficacy outcomes
In the longer-term analysis, the ORR was 28% in the overall population and 32% in patients with stage IIIB–IVM1a disease (table 2; figure 3A–C). Median (range) time to response was 5.39 (2.5–32.0) months. Most responses were ongoing (22/31) (figure 3A); the median DOR was, therefore, not estimable. Of the total 31 responders, 12 (39%) exhibited an unconfirmed progression prior to response (pseudoprogression; a new or enlarging area, in the absence of true tumor growth, which subsides or stabilizes without a change in therapy). DRR was 22% in the overall population and 26% in patients with stage IIIB–IVM1a melanoma (table 2). Of patients with measurable disease, a maximum reduction in baseline tumor burden of ≥50% was reported in 40% of patients (figure 3B). Treatment failure was recorded in 77 (69%) patients, respectively. Median TTF remained at 8.1 months.

Efficacy of talimogene laherparepvec according to the longer-term analysis (median follow-up 108 weeks). (A) Waterfall plot of maximum change in measurable tumor burden by patient (safety analysis set). (B) Spider plot of change in measurable tumor burden over time (safety analysis set). (C) Duration of response in patients with a best overall response of complete or partial response (n=31). (D) Kaplan-Meier plot of overall survival (safety analysis set). In part D, censor indicated by vertical bar, error bars represent 95% CIs. CR, complete response; PD, progressive disease; PR, partial response; SD, stable disease.
Responses according to baseline characteristics are shown in table 2. Partial response was observed in 6/28 patients (21%) previously treated with an immune checkpoint inhibitor, including 1/7 patients (14%) who had previously received pembrolizumab, 1/9 (11%) who had previously received nivolumab and 5/22 (23%) who had previously received ipilimumab.
By the longer-term analysis, 41 deaths had occurred and median OS was not estimable. The estimated 1-year, 2-year and 3-year survival rates (95% CI) were 80% (71% to 87%), 65% (55% to 73%) and 56% (42% to 68%), respectively (figure 3D).
IHC and multiparameter immunofluorescence findings
The IHC and multiparameter immunofluorescence findings observed in the longer-term analysis were consistent with those seen in the primary analysis.
Safety and tolerability
In the longer-term analysis, one additional patient experienced a TRAE of grade ≥3 and one additional serious TRAE (anemia, n=1) was reported (table 4).
Discussion
This is the first study to provide evidence that T-VEC monotherapy induces systemic immune activity by significantly increasing the intratumoral density of CD8+, helper T-cells (CD4+) and other immune cell infiltrates in non-injected lesions. Furthermore, the presence of granzyme B+ CD8+ T-cells suggests the recruitment of cells with effector properties. These findings demonstrate that T-VEC can boost inflammation in tumors distant to injected lesions, thereby supporting T-VEC’s purported systemic MOA. While the OPTiM phase III clinical trial demonstrated that T-VEC leads to tumor responses in non-injected lesions,4 28 it did not address the mechanism for these distant effects. Ribas et al previously reported similar systemic immune effects, but this was based on biopsies from only 13 patients and reported on specimens from only a small subpopulation with non-injected lesions (n=6).9 Therefore, the current study adds considerably to our understanding of the MOA of T-VEC and verifies previous hypotheses and preclinical data.1 8 11
Higher levels of intratumoral CD8+ T-cells have been associated with improved outcomes in patients with melanoma, independent of treatment.14 Furthermore, elevated levels of CD8+ T-cells and tumor-infiltrating lymphocytes are associated with better clinical outcomes to immunotherapy (ie, anti-PD-1 agents) in patients with melanoma and other cancers.21–24 However, in our study, baseline CD8+ T-cell density did not correlate with clinical outcomes in response to T-VEC. This suggests that responses are observed with T-VEC in patients with low levels of intratumoral CD8+ T-cells and that other factors could be driving resistance.
The functional activity of CD8+ T-cells is negatively regulated by immune checkpoint molecules such as PD-L1, PD-1 and CTLA-4.29 Cancer cells might use these pathways to downregulate T-cell responses and evade immune attack.29 In the current study, according to exploratory analyses, we observed increased expression of PD-L1 by tumor cells and a variety of intratumoral immune cells (including macrophages and T-cells), suggesting that increased infiltration of T-cells stimulates adaptive resistance mechanisms.30 Indeed, spatial analysis revealed a relationship between T-cell proximity to tumor-associated macrophages and PD-L1 expression. We considered whether adaptive resistance of this nature could limit the clinical responses that can be achieved with T-VEC monotherapy (as well as the quality of the responses) and might explain the lack of correlation between CD8+ T-cell infiltration and clinical outcomes. However, in our exploratory analyses, we observed PD-L1 increases in both responders and non-responders, suggesting that the increased T-cell infiltrate observed in T-VEC-treated patients could overcome the negative immune effects of PD-L1. It may also be possible to overcome adaptive resistance (ie, the effects of increased PD-L1) by combining T-VEC with an immune checkpoint inhibitor, which would act to restore suppressed antitumor immune responses.31 In this regard, Herbst et al demonstrated that responses to atezolizumab were increased in patients with tumors expressing high levels of PD-L1, especially when PD-L1 was expressed by tumor-infiltrating immune cells.32
The rationale for combining T-VEC with an immune checkpoint inhibitor is further strengthened by the fact that a significant number of patients who fail to respond to treatment with immune checkpoint inhibitors are thought to do so because of low levels of tumor-specific cytotoxic T-cells within the tumor microenvironment.15 33 Consistent with this theory, immune infiltration in tumors has been linked with therapeutic efficacy in patients receiving immune checkpoint inhibitors16–18 21–24 and PD-1 blockade has been shown to be ineffective in patients with low abundance of CD8+ T-cell tumor-infiltrating lymphocytes.22 In this regard, the baseline intratumoral CD8+ T-cell density in the current study (mean 460 cells/mm2) was in line with the levels previously associated with poor response to immune checkpoint inhibitors; progression with anti-PD-1 inhibitors has been previously reported in patients with an intratumoral CD8+ T-cell density of <500–1000 cells/mm2.22 Since T-VEC attracts immune cells to the tumor microenvironment, it might increase the number of CD8+ T-cells to a level sufficient for immune checkpoint inhibitors to act effectively. We observed a 2.41-fold median increase in intratumoral CD8+ T-cell density from baseline to week 6 of T-VEC treatment in non-injected lesions. Our results confirm the findings from preclinical and in vitro models, which showed that T-VEC was able to increase recruitment of both viral and tumor antigen-specific CD8+ T-cells, as well as induce a proinflammatory gene signature, in non-injected tumors.11
Preclinical and clinical studies evaluating the combination of T-VEC and immune checkpoint inhibitors have been encouraging to date. In an A20 B-lymphoma murine tumor model, OncoVEXmGM-CSF in combination with anti-CTLA-4 antibodies significantly increased median survival and complete regressions compared with either agent alone.8 Notably, 90% of contralateral tumors showed complete regression. The combination was also found to result in an increase in tumor-specific CD8+ T-cells.8 However, it should be noted that there are differences in the MOA of anti-CTLA-4 antibodies in mouse models compared with humans.
Two combination clinical studies have been undertaken in patients with unresectable stage IIIB–IVM1a melanoma, with promising findings: a phase II study of T-VEC plus ipilimumab (N=189),34 and a phase Ib study of T-VEC plus pembrolizumab (N=21). In the former study, the ORR was twice as high in the combination arm (39%) versus the ipilimumab monotherapy arm (18%).34 In the latter study, combination therapy resulted in an ORR of 62% and a CR rate of 33%, with responses evident in some patients with immunologically ‘cold’ tumors (those with low CD8+ T-cell infiltrates, a negative interferon (IFN)-γ signature and low PD-L1 expression).9 Patients who responded to the combination showed increased levels of CD8+ T-cells, elevated PD-L1 protein expression, and elevated IFN-γ gene expression in injected and non-injected lesions following an initial short lead-in of T-VEC monotherapy.9 The combination of T-VEC plus pembrolizumab is being further evaluated for melanoma in an ongoing phase III, placebo-controlled study (MASTERKEY-265; KEYNOTE-034; NCT02263508) and for a variety of solid tumors metastasized to the liver in an ongoing phase I study (MASTERKEY-318; NCT02509507). T-VEC is also being assessed in combination with atezolizumab in triple-negative breast cancer and colorectal cancer (NCT03256344).
Efficacy and safety data from the current study were consistent with those from the phase III OPTiM trial. Compared with OPTiM, this study included a larger percentage of patients with earlier-stage disease (57 vs 76% stage IIIB–IVM1a).3 4 Nevertheless, in the current study, ORR and CR (28% and 14%, respectively) were similar to those in OPTiM (26% and 11%), while DRR was higher in the current study (22% vs 16%).4 As also seen in OPTiM,3 patients with earlier-stage (IIIB–IVM1a) metastatic disease achieved higher DRR, ORR and CR (26%, 32% and 18%, respectively) vs patients with later-stage disease (stage IVM1b/c; 7%, 15%, 0%, respectively). An even higher ORR (61.5%) and CR rate (27%) was recently reported in the real-world setting in patients with stage IIIB/C melanoma in the Netherlands.35 Other real-world studies, predominantly in patients with stage IIIB/C melanoma, have also reported higher response rates than the current study and OPTiM.36–39 Regarding tolerability, the types and incidence of AEs are comparable to those observed in the OPTiM trial, where few patients experienced grade 3/4 AEs or discontinuing due to toxicity, and no treatment-related deaths occurred.4 No unexpected AEs were observed. The good tolerability of T-VEC further supports its utility in combination with checkpoint inhibitors.
Limitations of the present study include a small patient population (with smaller paired baseline and on-treatment biomarker-evaluable analysis sets for CD8+ T-cell density and multiparameter immunofluorescence) and the open-label, single-arm design. Additionally, since the majority of patients in the study had stage IIIB–IVM1a melanoma (and thus lesions biopsied at week 6 were frequently close to injected lesions), it is possible that the immune effect we observed in some cases was more of a locoregional effect rather than a systemic effect. Furthermore, the extent and type of prior therapy could have influenced the biomarker findings by altering the tumor microenvironment (a relatively high proportion of patients (36%) received prior immunotherapy, the most common class being immune checkpoint inhibitors (33%)). Furthermore, taking a biopsy from a different lesion at week 6 than at baseline might have led to heterogeneity, which could have influenced results.
In conclusion, this study indicates that T-VEC increases systemic immune activity in non-injected tumor lesions by increasing the intratumoral density of CD8+ T-cells and other immune infiltrates, including helper T-cells, in metastatic lesions between baseline and week 6. PD-L1 was also shown to increase in the tumor microenvironment on non-injected lesions during treatment, according to exploratory analyses. Additionally, there was a significant increase in the proportion of infiltrating CD8+ T-cells expressing granzyme B and checkpoint markers PD-1, PD-L1 and CTLA-4 in non-injected lesions. This MOA, together with its favorable tolerability profile, provides a strong rationale for combining T-VEC with checkpoint blockade. This is the subject of ongoing clinical investigations.
Data availability statement
Data are available on reasonable request. Qualified researchers may request data from Amgen clinical studies. Complete details are available at the following: https://www.amgen.com/science/clinical-trials/clinical-data-transparency-practices/clinical-trial-data-sharing-request/.
Ethics statements
Ethics approval
Study procedures were approved by the institutional review boards or ethics committees for each participating site.
Acknowledgments
We thank all patients and investigators involved in the study (as well as members of the adjudication, independent data monitoring, and publication steering committee). Jennifer Gansert, MD, PhD, at Amgen Inc, designed the study. Medical writing support (including development of a draft outline and subsequent drafts in consultation with the authors, assembling tables and figures, collating author comments, copyediting, fact checking and referencing) was provided by Debbie Sherwood and Ryan Woodrow at Aspire Scientific (Bollington, UK), and funded by Amgen. Programming and statistical support was provided by Parexel, and funded by Amgen.
References
Supplementary materials
Supplementary Data
This web only file has been produced by the BMJ Publishing Group from an electronic file supplied by the author(s) and has not been edited for content.
Footnotes
Contributors JM, IS, DS, RG, J-JG, JJS and HG acquired the study data. KSG, AA, CAP and KL analyzed the data. All authors interpreted the data, were involved with drafting or critical revisions of the manuscript, and provided approval of the final manuscript for submission.
Funding This study was funded by Amgen Inc.
Competing interests JM has acted as a consultant/advisor for and has received honoraria from Almirall, Amgen, Bristol-Myers Squibb, GlaxoSmithKline, Merck Sharp & Dohme, Leo Pharma, Novartis, Pierre Fabre and Roche. IS has acted as a consultant and served on a speaker’s bureau for Biocad, Bristol-Myers Squibb, Merck Sharp & Dohme, Novartis and Roche. DS has received research support from Bristol-Myers Squibb and Novartis; has acted as a consultant for and received royalties from Amgen, Array, AstraZeneca, Bristol-Myers Squibb, Merck Sharp & Dohme, Novartis, Pierre Fabre, and Roche; and has acted as a consultant for Immunocore, Incyte, LeoPharma, Merck Serono, Pfizer, Philogen, and Regeneron. RG has received research support from Johnson & Johnson, Novartis, Merck Serono, Amgen and Pfizer; has received honoraria for advice and/or lectures from Almirall Hermal, Amgen, Bayer, Bristol-Myers Squibb, Merck Serono, Merck Sharp & Dohme, Novartis, Pierre Fabre, Roche, Sanofi/Regeneron, SUN Pharma and 4SC. J-JG has acted as a consultant/in an advisory role for and has received honoraria from Bristol-Myers Squibb, GlaxoSmithKline, Merck Sharp & Dohme, Merck-Pfizer, Pierre Fabre, and Roche. JJS has received research support from AstraZeneca, Bristol-Myers Squibb and Immunocore; has acted as a consultant/in an advisory role for Immunocore, Delcath, Merck Sharp & Dohme, Amgen and Pierre Fabre; and served on a speaker’s bureau for Bristol-Myers Squibb. KSG and AA are employees and stock holders of Amgen. KL is an employee of Amgen. CAP was previously an employee of Amgen. HG has acted as a consultant/in an advisory role for Bristol-Myers Squibb, Merck Sharp & Dohme, Novartis, Amgen, Roche and Pierre Fabre.
Provenance and peer review Not commissioned; externally peer reviewed.
Supplemental material This content has been supplied by the author(s). It has not been vetted by BMJ Publishing Group Limited (BMJ) and may not have been peer-reviewed. Any opinions or recommendations discussed are solely those of the author(s) and are not endorsed by BMJ. BMJ disclaims all liability and responsibility arising from any reliance placed on the content. Where the content includes any translated material, BMJ does not warrant the accuracy and reliability of the translations (including but not limited to local regulations, clinical guidelines, terminology, drug names and drug dosages), and is not responsible for any error and/or omissions arising from translation and adaptation or otherwise.