Article Text

Abstract
The advent of immune checkpoint inhibitors has reinvigorated the field of immuno-oncology. These monoclonal antibody-based therapies allow the immune system to recognize and eliminate malignant cells. This has resulted in improved survival of patients across several tumor types. However, not all patients respond to immunotherapy therefore predictive biomarkers are important. There are only a few Food and Drug Administration-approved biomarkers to select patients for immunotherapy. These biomarkers do not consider the heterogeneity of tumor characteristics across lesions within a patient. New molecular imaging tracers allow for whole-body visualization with positron emission tomography (PET) of tumor and immune cell characteristics, and drug distribution, which might guide treatment decision making. Here, we summarize recent developments in molecular imaging of immune checkpoint molecules, such as PD-L1, PD-1, CTLA-4, and LAG-3. We discuss several molecular imaging approaches of immune cell subsets and briefly summarize the role of FDG-PET for evaluating cancer immunotherapy. The main focus is on developments in clinical molecular imaging studies, next to preclinical studies of interest given their potential translation to the clinic.
- immunotherapy
- review
- tumor biomarkers
This is an open access article distributed in accordance with the Creative Commons Attribution Non Commercial (CC BY-NC 4.0) license, which permits others to distribute, remix, adapt, build upon this work non-commercially, and license their derivative works on different terms, provided the original work is properly cited, appropriate credit is given, any changes made indicated, and the use is non-commercial. See http://creativecommons.org/licenses/by-nc/4.0/.
Statistics from Altmetric.com
Introduction
The immune system has long been recognized to play a vital role in eliminating malignant cells.1 The first immunotherapy for cancer dates back to the 19th century with the work of William B. Coley, using bacterial toxins.2 3 Since then, several major developments have occurred. The most impactful discovery has been antibodies targeting the immune checkpoints. These immune checkpoint molecules maintain immunological tolerance and avoid autoimmunity under physiological circumstances. Tumors misuse this mechanism to dampen the antitumor immune response. Targeting immune checkpoints allows the immune system to recognize and eliminate the malignant cells. A decade ago, the first immune checkpoint inhibitor (ICI), ipilimumab, was approved to treat metastatic melanoma. This cytotoxic T-lymphocyte-associated antigen 4 (CTLA-4) targeting monoclonal antibody demonstrated impressive, durable responses in a subset of treated patients. Afterward, eight other ICIs were approved. Most of them target either programmed cell death 1 (PD-1) or programmed death-ligand 1 (PD-L1) (REF 4). However, more recently, the lymphocyte-activation gene 3 (LAG-3) targeting antibody relatlimab was approved by the European Medicines Agency (EMA) and the T cell immunoreceptor with Ig and ITIM domains (TIGIT) targeting antibody tiragolumab received a breakthrough therapy designation from the United States Food and Drug Administration.4 5
Still, many patients do not respond to ICI therapy.6 Only a few biomarkers are approved to select patients for ICI therapy. PD-L1 immunohistochemistry (IHC), IHC for mismatch repair (MMR) proteins, PCR-based assays for microsatellite instability, and whole-exome sequencing for tumor mutational burden are currently used for several indications.7–9 However, these biomarkers are far from perfect as they do not consistently predict treatment outcomes. Additionally, these assays are performed on tumor tissue samples. The tumor can adapt to the host’s immune system and treatment effects. Therefore, previously collected tumor tissue may not accurately reflect the current tumor status. Obtaining new tissue would require an invasive procedure which is not always possible. Moreover, existing approaches do not consider the heterogeneity of tumor characteristics across lesions within a patient. Multiple tumor subclones can be present in one patient and be responsible for resistance to therapy or result in oligo progression of disease.10 11
New molecular imaging tracers are emerging to address this issue. In the past few years, single photon-emission CT (SPECT) and several new positron emission tomography (PET) tracers have been developed to visualize components of the immune system. These new tracers might allow non-invasive whole-body assessment of immunotherapeutic drug biodistribution, immune checkpoints, and immune cell populations. Moreover, these techniques would permit serial evaluation of the dynamic tumor microenvironment. In this review, we will summarize recent developments and future opportunities for molecular imaging for ICI therapy.
Molecular imaging of immune checkpoints
The molecular imaging tracers discussed in this review can be roughly divided into two main groups, being antibody (fragment)-based tracers and a group of smaller molecules, such as adnectins, peptides and small molecule-based tracers. Each of these two approaches has its distinct advantages and disadvantages.
Intact IgG monoclonal antibodies are relatively large proteins of around 150 kDa. Therefore, PET imaging with antibody-based PET tracers is generally performed several days after tracer injection to allow sufficient tracer accumulation at the target site. These antibodies are labeled with radioisotopes with long physical half-lives, such as zirconium-89 (89Zr) or copper-64 (64Cu), to accommodate this imaging schedule. Additionally, the ICIs that are currently approved are all antibodies. Radiolabeling those antibodies provides insight into their biodistribution.
The group of smaller molecules are usually labeled with radioisotopes with a short half-life, such as fluorine-18 (18F) or gallium-68 (68Ga). The small size is thought to result in better tissue penetration and might allow for earlier scanning after tracer injection. Given the smaller size, the clearance is also faster than that of monoclonal antibodies. There are currently no head-to-head comparison studies available.
PD-L1 imaging
PD-L1 is involved in maintaining immunological tolerance and preventing autoimmunity. PD-L1 is commonly expressed by immune cells, such as T-cells and dendritic cells, and non-lymphoid parenchymal tissue cells and tumor cells.12 To date, multiple different PD-L1 targeting molecular imaging tracers have been evaluated in small clinical trials.
The three approved therapeutic anti-PD-L1 antibodies: atezolizumab, durvalumab, and avelumab have been radiolabeled and are being evaluated for PET imaging in patients.13–15 The first-in-human PD-L1 PET imaging study was performed with [89Zr]Zr-atezolizumab in 22 patients with metastatic non-small-cell lung cancer (NSCLC), bladder cancer, and triple-negative breast cancer. They were imaged before starting atezolizumab treatment.13 The total tracer dose of 10 mg protein, 2 mg labeled [89Zr]Zr-atezolizumab with 8 mg of unlabeled atezolizumab, was optimal for PET imaging. This study demonstrated tracer uptake in lymphoid tissues such as the spleen, tonsils, healthy lymph nodes, and bone marrow. Furthermore, [89Zr]Zr-atezolizumab uptake in tumor lesions correlated with tumor response to therapy, progression-free survival, and overall survival. PD-L1 IHC on a fresh tumor biopsy did not predict tumor response.13
Two studies have since been published using [89Zr]Zr-durvalumab. The first evaluated [89Zr]Zr-durvalumab PET in 13 patients with NSCLC at two imaging time points. Here patients received 2 mg total protein dose of [89Zr]Zr-durvalumab before ICI therapy and a second tracer administration on the same day as the first 750 mg therapeutic durvalumab dose. This resulted in a twofold higher blood pool activity than in the first PET series. Tracer uptake in tumor lesions, spleen, bone marrow, and liver was lower than during the first PET series, indicating some degree of saturation. Day 5, after tracer injection, was optimal for image acquisition. The tracer biodistribution was similar to that of [89Zr]Zr-atezolizumab. Tracer uptake in tumor lesions of responders was higher than in patients with progressive disease but lacked statistical significance.15 [89Zr]Zr-durvalumab PET was also performed in 33 patients with metastatic head and neck squamous cell carcinoma.16 The patients were imaged before durvalumab treatment. Three tracer protein doses were evaluated: 2 mg, 10 mg, and 50 mg. Ten mg resulted in the highest tumor-to-blood ratio, and PET imaging was performed on day 5 after tracer injection. [89Zr]Zr-durvalumab tumor uptake, expressed as standardized uptake value (SUVpeak), did not correlate with response to therapy or PD-L1 IHC.
Lastly, PD-L1 PET imaging was performed in patients with a zirconium-89 labeled investigational anti-PD-L1 probody, [89Zr]Zr-CX-072.17 It is engineered to be activated by tumor proteases that remove a masking peptide to allow tumor-specific PD-L1 binding.18 This study aimed to analyze whether this antibody modification would influence the biodistribution pattern. Eight patients were scanned, three received the optimal tracer dose level of 10 mg. Tracer uptake in tumor lesions was highest on day 7 after tracer injection. Tracer biodistribution demonstrated the highest uptake in spleen, liver, and tumor lesions, and in four patients, uptake was observed in tonsils and lymph nodes. Uptake in healthy tissues, like the spleen, was lower (SUVmean: 8.6) than those reported for [89Zr]Zr-atezolizumab and [89Zr]Zr-durvalumab (SUVmean:~15), most likely due to its probody design.
Adnectin and peptide-based PET tracers have also been evaluated for PD-L1 PET imaging. The first tracer evaluated in humans was [18F]-BMS-986192, a fluorine-18 labeled anti-PD-L1 adnectin.19 Image acquisition followed 1 hour after tracer injection. The biodistribution demonstrated high uptake in lymphoid tissues, such as the spleen (SUVmean: 15.7±4.0) and bone marrow (SUVmean: 3.2±1.0). Within and between the 13 patients included, there was heterogeneous tumor uptake. [18F]-BMS-986192 uptake was also seen in brain metastases.19 20 Tracer uptake correlated with PD-L1 IHC in 13 fresh tumor biopsies but not with response to nivolumab treatment.
The second tracer is gallium-68 labeled WL12, a high-affinity PD-L1-binding small peptide.21 In nine patients with NSCLC, image acquisition was performed 1 hour after tracer injection. Biodistribution demonstrated high uptake in the liver, small intestine, spleen, and kidneys. Tracer uptake in tumor lesions (SUVpeak) correlated with PD-L1 IHC staining of 9 tumor biopsies. Treatment response was assessed in only three patients. Therefore, no definitive conclusions can be made regarding tracer uptake in tumor lesions and treatment response.
PD-1 imaging
PD-1 is the receptor for PD-L1 and PD-L2 and is mainly expressed by activated T-cells, regulatory T-cells (Tregs), natural-killer T cells, B cells, and monocytes.22 Two of the four approved anti-PD-1 antibodies, namely pembrolizumab and nivolumab, have been radiolabeled and evaluated in patients. A study was performed in 13 patients with NSCLC using 2 mg [89Zr]Zr-nivolumab.19 Patients were imaged before and during nivolumab treatment. However, only tracer uptake in tumor lesions from the PET scan before treatment is reported. [89Zr]Zr-nivolumab uptake in tumor lesions correlated with PD-1 IHC staining, and tracer uptake was higher in responding lesions, defined as a 30% or more reduction in size compared with baseline. Tumor response to therapy at a patient level, according to the RECIST criteria, was not reported. Biodistribution data revealed the highest uptake (SUVmean) in the spleen (5.8±0.7), liver (4.8±2.2), kidneys (2.8±0.7), and bone marrow (2.5±0.7). For the second PET series, where the tracer injection coincided with the first therapeutic dose of nivolumab (3 mg/kg), lower uptake was reported for the spleen and bone marrow, whereas liver and kidney uptake remained similar. This effect is likely due to partial saturation by nivolumab of the PD-1 binding sites.
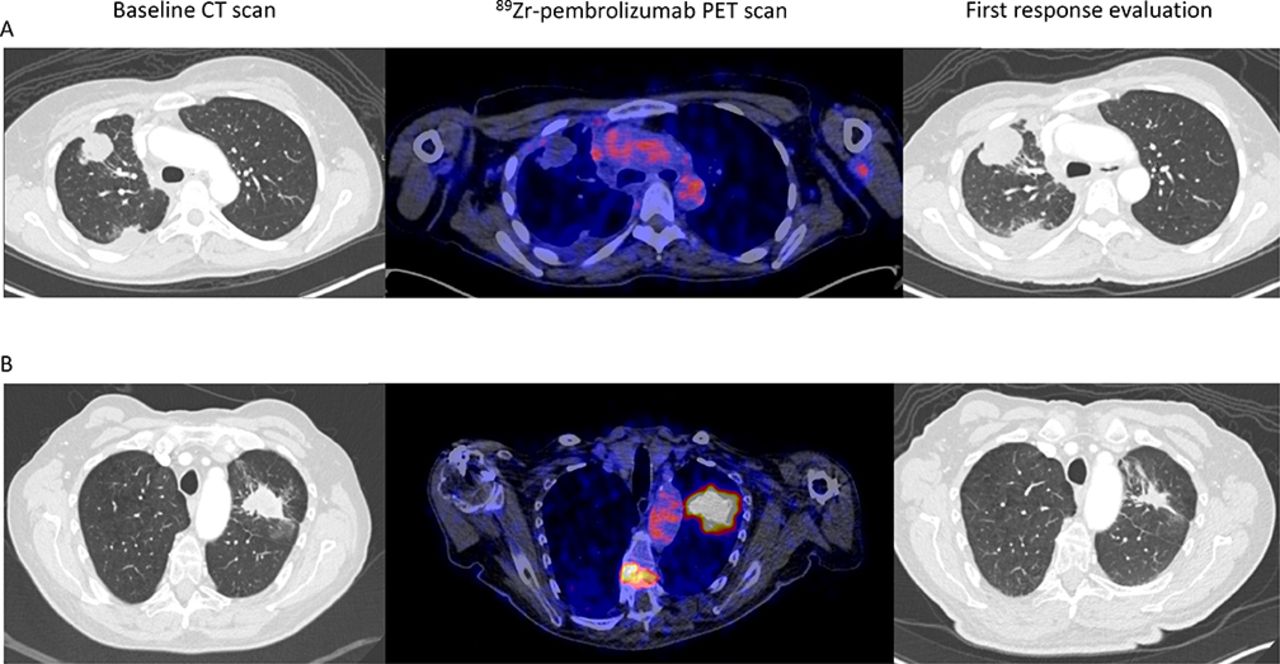
Two papers evaluated [89Zr]Zr-pembrolizumab for PD-1 PET imaging. These studies reported similar biodistribution compared with [89Zr]Zr-nivolumab, with high uptake in lymphoid tissues. One study included 12 patients with NSCLC who underwent two [89Zr]Zr-pembrolizumab PET scans.23 The first scan was performed before pembrolizumab treatment, using a tracer dose of 2 mg of [89Zr]Zr-pembrolizumab and imaging 7 days after tracer injection. The second tracer administration was on the day of the first full therapeutic pembrolizumab dose of 200 mg, with a PET scan 7 days later. Tracer uptake in the spleen and tumor lesions was lower with the 200 mg unlabeled predose than the 2 mg [89Zr]Zr-pembrolizumab dose alone, suggesting that some saturation of PD-1 binding sites occurred. Higher tracer uptake was observed in lesions of responders to pembrolizumab treatment, although this difference did not reach significance. The other [89Zr]Zr-pembrolizumab study performed a PET scan in 18 patients with metastatic melanoma or NSCLC before PD-1 antibody treatment.24 Tracer dose-finding was done for 5 and 10 mg total protein doses. The first six patients were scanned on days 2, 4, and 7 after tracer injection. Optimal imaging results were achieved with a total protein dose of 5 mg and PET imaging on day 7. Higher [89Zr]Zr-pembrolizumab tumor uptake correlated with response to anti-PD-1 therapy (figure 1), progression-free survival, and overall survival. Tracer uptake did not differ between NSCLC and melanoma lesions. Biodistribution results are similar to the [89Zr]Zr-nivolumab and [89Zr]Zr-pembrolizumab studies.
Two examples of [89Zr]Zr-pembrolizumab tumor uptake (scaled 0–8) in patients with metastatic NSCLC and a CT scan before and during PD-1 antibody treatment. (A) On the left, an axial view of the baseline CT scan. In the middle, the [89Zr]Zr-pembrolizumab PET/CT scan before starting treatment shows no uptake in tumor lesions in right lung. On the right, the first CT scan made 40 days on treatment, demonstrating progressive disease. (B) On the left, an axial view of the baseline CT scan before treatment. in the middle, the [89Zr]Zr-pembrolizumab PET/CT scan before starting treatment shows clear uptake in the lung lesion and in a bone metastasis in the spine. On the right, CT scan made 44 days on treatment demonstrating a partial response. NSCLC, non-small-cell lung cancer; PET, positron emission tomography.
CTLA-4 imaging
CTLA-4 is expressed by activated T cells and regulatory T cells. CTLA-4 is upregulated after binding to the T cell receptor to antigen-presenting cells. CTLA-4 competes with the stimulatory molecule CD28 for binding to B7-1 and B7-2 on antigen-presenting cells, resulting in dampening of the immune response. Ipilimumab is currently mainly administered with nivolumab to increase the antitumor efficacy.25 This often also results in more side effects. There is one ongoing CTLA-4 PET imaging trial (NCT03313323), in which [89Zr]Zr-ipilimumab is evaluated patients with melanoma. [89Zr]Zr-ipilimumab PET scans are performed before and after 3 weeks of ipilimumab treatment. A preliminary report about three patients showed high uptake in liver and spleen and uptake in 5 out of 12 tumor lesions.26 In future studies, it could be interesting to see whether tumor uptake of [89Zr]-ipilimumab can identify patients who might benefit from adding ipilimumab to nivolumab.
LAG-3 imaging
LAG-3 is another immune checkpoint that is increasingly being studied for cancer treatment. Fifteen LAG-3 targeting antibodies have been developed, and multiple ongoing trials investigate LAG-3 blockade.27 The LAG-3 antibody relatlimab has been approved in combination with nivolumab to treat patients with melanoma. LAG-3 is an inhibitory receptor, generally found on T-cells, natural-killer cells, B-cells, and dendritic cells.28 The exact mechanism through which LAG-3 exerts its inhibitory effect has not yet been fully elucidated. However, the intracellular KIEELE motif is considered to play an important role.28 The main target for LAG-3 is major histocompatibility complex II (MHC-II) on antigen-presenting cells. However, several other targets have been identified, such as galectin-3 (Gal-3) and fibrinogen-like protein 1 (FGL1).28 Currently, three clinical PET imaging studies are ongoing evaluating feasibility and safety of LAG-3 PET imaging (NCT04566978, NCT04706715, and NCT03780725). Preliminary results of PET imaging with anti-LAG-3 antibody BI 754111 ([89Zr]Zr-BI 754111) in four patients with NSCLC and two with HNSCC progressing on anti-PD-1 treatment were presented.29 The first PET scan, using 4 mg protein of [89Zr]Zr-BI 754111, was performed before starting ezabenlimab (anti-PD-1) plus BI 754111 therapy. The second tracer injection coincided with the first therapeutic dose of BI 754111. The first PET series demonstrated uptake in the liver and spleen and heterogeneous tracer uptake in tumor lesions, both within and between patients. The second series showed clear saturating effects of the therapeutic BI 754111 dose of 40 or 600 mg. This study was terminated prematurely by the company. Two ongoing studies use [89Zr]-labeled LAG-3 antibody fianlimab (REGN3767) for PET imaging in diffuse large B cell lymphoma and advanced solid tumors.
Other immune checkpoints
Many other immune checkpoint molecules are currently under investigation for potentiating and optimizing ICI treatment regimens. For some of these checkpoints, molecular imaging tracers have already been developed and are currently being evaluated. One of them is TIGIT, which is present on T-cells and NK-cells.30 A gallium-68 labeled peptide targeting TIGIT ([68Ga]Ga-GP12) has been evaluated for PET imaging of TIGIT.31 PET imaging in a tumor-bearing mouse model revealed optimal tumor-to-muscle ratio 60 min after tracer injection. Pretreatment with excess GP12 reduced the PET signal, whereas pretreatment with an anti-TIGIT monoclonal antibody did not, indicating binding to another epitope. Afterward, first-in-human imaging of TIGIT was performed in two patients with NSCLC receiving 203.5 and 233.1 MBq [68Ga]Ga-GP12. The tracer cleared rapidly from the blood pool, and the optimal imaging time point was 40 min postinjection. The tracer visualized primary and metastatic lesions. An anti-mouse TIGIT antibody PET tracer was also developed. The antibody was labeled with [64Cu] and [89Zr], with superior contrast for [89Zr]. [89Zr]Zr-TIGITmAb detected TIGIT+tumor infiltrating lymphocytes in a melanoma allograft mouse model.32
T cell immunoglobulin and mucin domain-containing-3 (TIM-3) is another immune checkpoint for which a PET tracer was developed,33 namely a rat anti-mouse TIM-3-specific monoclonal antibody [64Cu]Cu-NOTA-RMT3–23. [64Cu]Cu-NOTA-RMT3–23 PET visualizes the distribution of TIM-3-positive lymphocytes in melanoma mouse models. PET signal was restricted mainly to the peritumoral regions.
Molecular imaging of immune cells
T-cells are considered the main effector cells in the antitumor immune response. Therefore, much effort is put into developing PET tracers targeting T-cell lineage markers. Ex vivo labeling of immune cells for imaging is discussed at length elsewhere.34 Several studies have found that T cell infiltration in the tumor is associated with a higher chance of response to ICI therapy.35–39 In theory, molecular imaging tracers targeting T-cell subsets could be used to assess the degree of T cell infiltration in all tumor lesions. Additionally, serial PET imaging might serve to detect changes in T-cell densities in the tumor following ICI therapy. As of yet, most knowledge regarding T-cell activation and migration following checkpoint blockade comes from tumor tissue analyses in neoadjuvant studies or studies performing serial biopsies (table 1).35 36 40–54 These studies show varying results. Those that report an increase of T-cells in the tumors following ICI therapy sometimes observe this already after one or two treatment cycles. However, most of these studies are relatively small, and their method of assessing T-cell infiltration varies. Multiple studies evaluating neoadjuvant checkpoint blockade only report pathological response rates without specific immunohistochemical staining of T-cells.55–58 These studies provide further, although circumstantial, evidence that the immune response following ICI therapy could take place in a few weeks.
Overview of studies evaluating changes in T-cell infiltration following immune checkpoint inhibitor therapy
CD8 PET
CD8 +T cell presence in the tumor before treatment correlates with favorable responses to ICI therapy.35–39 Additionally, CD8 +T cells play an essential role in eradicating tumor cells and are thought to be reinvigorated following ICI therapy. Three CD8 targeting PET tracers are being evaluated in several different clinical trials. The first-in-human CD8 PET imaging study used [89Zr]Zr-Df-IAB22M2C ([89Zr]Zr-Df-crefmirlimab), a zirconium-89 labeled anti-CD8 minibody.59 60 In this phase one study, the biodistribution suggested successful CD8 targeting, with high uptake in the spleen, bone marrow, normal lymph nodes, and uptake in tumor lesions. Work is ongoing to reduce the radioactivity dose,61 which would further increase its applicability in patient care. The other CD8 PET tracer being evaluated is 89ZED88082A, a zirconium-89 labeled one-armed antibody.62 A clinical study is ongoing evaluating CD8 PET imaging before and during immunotherapy (NCT04029181). Preliminary results show specific CD8 targeting, with high tracer uptake in the spleen, bone marrow, tonsils, and healthy lymph nodes. Tracer uptake in tumor lesions was variable within and between patients. Tumor uptake was higher in patients with MMR deficient tumors (n=9) than in patients with MMR proficient tumors (n=28). Tracer uptake in tumor lesions was associated with CD8 tumor expression stained immunohistochemically, and the autoradiography signal of biopsied lesions. Furthermore, higher tracer uptake in tumor lesions at baseline showed a trend with improved clinical outcomes.63 Serial CD8 PET imaging results for both tracers are not yet available. The third CD8 PET tracer currently being investigated is [68Ga]Ga-NODAGA-SNA006 (NCT05126927). [68Ga]Ga-NODAGA-SNA006 is a gallium-68 labeled CD8 targeting nanobody. Currently, a phase 1 study is ongoing to evaluate this tracer’s safety and imaging characteristics.
CD4 PET
CD4 assists in T-cell activation through interaction with MHC-II on antigen-presenting cells. Several CD4 targeting PET tracers are currently being developed to image immunological processes. To our knowledge, no clinical studies are ongoing evaluating CD4 PET imaging in patients. Preclinical imaging studies have shown specific tracer uptake in lymphoid tissues.64–70 With CD4 PET imaging in the context of cancer immunotherapy, it is expected that besides visualizing pro-inflammatory CD4 +T-helper cells, also anti-inflammatory CD4 +Tregs will be visualized.
IL-2 imaging
Interleukin-2 (IL-2)-based molecular imaging tracers are another strategy for T-cell imaging. These probes are directed against the high-affinity IL-2 receptor, expressed by Tregs and activated effector T-cells. The first study evaluated [99mTc] labeled IL-2 ([99mTc]Tc-HYNIC-IL-2) during ICI therapy. Three of the five patients included completed both the baseline and the on-treatment [99mTc]Tc-HYNIC-IL-2 SPECT scan. Metastatic lesions were visualized, and a positive correlation between tumor lesion size and [99mTc]Tc-HYNIC-IL-2 uptake was found. Serial imaging during immunotherapy demonstrated increased uptake in some lesions and decreased uptake in others.71
A study with fluorine-18 labeled IL-2 ([18F]FB-IL2) was performed in 13 patients with metastatic melanoma. They underwent PET imaging at baseline, and 11 patients also underwent a [18F]FB-IL2 PET scan during treatment with an ICI. Imaging findings did not correlate with clinical outcomes. Serial [18F]FB-IL2 PET imaging demonstrated a minor decrease in tracer uptake on-treatment overall, with tracer uptake increasing in some lesions and decreasing in others.72
[18F]F-AraG PET
Fluorine-18 labeled 9-β-d-arabinofuranosylguanine ([18F]F-AraG) is being investigated for imaging the immune response in patients with cancer. The guanosine analog [18F]F-AraG can be phosphorylated by cytoplasmic deoxycytidine kinase and deoxyguanosine kinase in T cells and is afterwards trapped intracellularly.73 This tracer is being evaluated for several indications, such as infection, auto-immune disease, and cancer immunotherapy. Although multiple trials with this tracer are ongoing, limited clinical data is available. Biodistribution data has been published from six healthy volunteers who underwent an [18F]F-AraG PET scan, which showed high uptake in the kidneys, liver, bladder, and cervical lymph nodes with low uptake in the brain muscles, and heart.74
Granzyme-B PET
A novel approach for PET imaging in immuno-oncology is measuring T-cell activity using granzyme B PET. Granzyme B is a serine-protease released by activated T-cells and NK-cells for eliminating target cells.75 Visualization of granzyme might therefore allow early assessment of response to ICI therapy. A major strength of this approach is that it focuses on T-cell activity rather than T-cell presence. Thus, granzyme PET only visualizes proinflammatory processes. Several studies evaluating granzyme B PET for ICI therapy in different mouse models accurately predicted response to ICI therapy.76–82 Granzyme B levels were higher in human melanoma tumors responding to ICI therapy.78 There is one ongoing clinical trial evaluating granzyme PET with [68Ga]Ga-NOTA-hGZP in patients with melanoma and NSCLC treated with pembrolizumab (NCT04169321), two other trials are listed (NCT04721756, NCT05000372), evaluating [18F]-LY3546117 and [68Ga]Ga-grazytracer respectively for granzyme PET imaging, but not yet recruiting.
[18F]-FDG PET
Fluorine-18 deoxyglucose ([18F]-FDG)-PET is the most commonly used molecular imaging tracer in oncology. [18F]-FDG-PET has been well established for staging patients with cancer, including melanoma and NSCLC. [18F]-FDG-PET is also increasingly studied as a tool for response evaluation during ICI treatment.83–89 Although these results show potential for [18F]-FDG PET, they should be confirmed in adequately powered studies. As of yet, [18F]-FDG PET serves mainly as a supportive tool for anatomic imaging modalities such as CT and MRI. In a study of 27 patients, [18F]-FDG PET was able to differentiate viable tumor tissue from residual fibrosis.89 Another retrospective study in 104 patients with metastatic melanoma demonstrated that [18F]-FDG PET 1 year after treatment initiation is better able to assess complete response than anatomical imaging.90 Five-year follow-up data were recently published for this cohort showing sustained responses in the majority of patients, especially those with a complete metabolic response on [18F]-FDG PET.91 [18F]-FDG PET is also used for more exploratory analyses such as predicting response to ICI therapy or correlations of tracer uptake in tumor lesions and PD-L1 status.92–101 A downside of [18F]-FDG PET for these exploratory analyses is that glucose metabolism is not tumor-specific. Elevated glucose metabolism can be due to inflammatory processes as well as to metabolic active tumor cells, which complicates these kinds of analyses.
[18F]-FLT PET
Imaging of proliferation, using 3'-deoxy-3'-[18F]-fluorothymidine ([18F]-FLT) PET, has also been performed in the context of cancer immunotherapy. After entering the cell, [18F]-FLT is phosphorylated by thymidine kinase 1 and is subsequently trapped intracellularly. The activity of thymidine kinase 1 is elevated during the S phase of the cell cycle. Therefore, [18F]-FLT-PET can be used as an indirect measure of cell proliferation. The largest study to date evaluated [18F]-FLT-PET in 26 patients with advanced NSCLC.102 [18F]-FLT-PET scans were performed before, after 2 weeks, and after 6 weeks of anti-PD-1 antibody therapy. In this cohort, changes between the baseline and week 6 [18F]-FLT-PET scans were able to predict progression of disease with 90.9% accuracy.102
Future directions and conclusions
As more immunotherapeutics are making their way into the clinic, the demand for tools to select patients for the right treatment increases. Molecular imaging can provide valuable insight into the interplay between tumors and the immune system. Radiolabeled therapeutic antibodies can visualize the biodistribution of the drug. This might support drug development and show whether the drug reaches its target. Moreover, they can be used to semi-quantitative assess the presence of their target and evaluate the heterogeneity of target expression at different sites of interest. Given the complex mechanisms involved in the immune response, one could foresee that one signal biomarker will not suffice to predict tumor response to ICI. Potentially molecular imaging might well contribute here.
Molecular imaging tracers targeting the PD-1/PD-L1 axis have been most extensively studied to date and have shown potential in discriminating between responders and non-responders. Other immune checkpoints are also being targeted, with multiple new tracers being developed. In the future, these tracers might aid in guiding ICI treatment combinations or even switch to ICI monotherapy in individuals with much higher tracer uptake in tumor lesions.
There are also challenges regarding applying molecular imaging in the setting of cancer immunotherapy. Not all studies demonstrate a correlation between the imaging results and clinical outcomes of the patients. Most studies discussed here are feasibility studies, not adequately powered to evaluate correlations with clinical outcomes. Additionally, there are substantial methodological differences between these studies, making comparison difficult. Future studies should also include a direct comparison to more commonly used biomarkers for immunotherapy to adequately assess the value of these tracers or the potentially improved value when molecular imaging is combined with other biomarkers.
The technology behind molecular imaging is also refining. Total-body PET scanners provide far high sensitivity than previous systems. These new scanners offer higher image quality, allow for shorter scan times, and require less radioactivity. Reducing radiation exposure is key for patients with durable disease-free survival following ICI therapy and the application of these tracers for other non-cancer indications.
Molecular imaging provides insight for the evaluation of the effects of ICI therapy. However, the studies discussed in this review are of modest size, and therefore, further studies in larger cohorts are warranted to evaluate the impact for patient selection for immunotherapies.
Ethics statements
Patient consent for publication
Ethics approval
Not applicable.
References
Footnotes
Twitter @VriesElisabeth
Contributors Design: PvdD and EDV. Writing: PvdD. Figure: PvdD. Review and editing: SO, DK, AvdW, AB, ML-dH, D-JAdG and EDV. All authors have read and agreed to the submitted version of the manuscript.
Funding Supported by the Dutch Cancer Society grant POINTING (number 10034).
Competing interests EDV reports an advisory role at Daiichi Sankyo, NSABP, and Sanofi and research funding from Amgen, AstraZeneca, Bayer, Chugai Pharma, Crescendo, CytomX Therapeutics, G1 Therapeutics, Genentech, Nordic Nanovector, Radius Health, Regeneron, Roche, Servier, and Synthon (paid to UMCG). AvdW reports an advisory role at Janssen, Takeda, and Boehringer-Ingelheim (paid to UMCG) and research funding from AstraZeneca, Boehringer-Ingelheim, Pfizer, Roche, and Takeda. ML-dH reports research funding from Merck, Bayer, and Amgen (paid to UMCG). SO reports research funding from Novartis, Pfizer and Celldex Therapeutics (paid to UMCG) and an advisory role at Bristol Myers Squibb (paid to the UMCG).
Provenance and peer review Commissioned; externally peer reviewed.