Article Text

Abstract
Background There is an urgent need for effective treatments for hepatocellular carcinoma (HCC). Immunotherapy is promising especially when combined with traditional therapies. This study aimed to investigate the immunomodulatory function of an approved Chinese medicine formula, compound kushen injection (CKI), and its anti-HCC efficiency in combination with low-dose sorafenib.
Methods Growth of two murine HCC cells was evaluated in an orthotopic model, a subcutaneous model, two postsurgical recurrence model, and a tumor rechallenge model with CKI and low-dose sorafenib combination treatment. In vivo macrophage or CD8+ T cell depletion and in vitro primary cell coculture models were used to determine the regulation of CKI on macrophages and CD8+ T cells.
Results CKI significantly enhanced the anticancer activity of sorafenib at a subclinical dose with no obvious side effects. CKI and sorafenib combination treatment prevented the postsurgical recurrence and rechallenged tumor growth. Further, we showed that CKI activated proinflammatory responses and relieved immunosuppression of tumor-associated macrophages in the HCC microenvironment by triggering tumor necrosis factor receptor superfamily member 1 (TNFR1)-mediated NF-κB and p38 MAPK signaling cascades. CKI-primed macrophages significantly promoted the proliferation and the cytotoxic ability of CD8+ T cells and decreased the exhaustion, which subsequently resulted in apoptosis of HCC cells.
Conclusions CKI acts on macrophages and CD8+ T cells to reshape the immune microenvironment of HCC, which improves the therapeutic outcomes of low-dose sorafenib and avoids adverse chemotherapy effects. Our study shows that traditional Chinese medicines with immunomodulatory properties can potentiate chemotherapeutic drugs and provide a promising approach for HCC treatment.
- immunology
- gastroenterology
- pharmacology
- tumours
This is an open access article distributed in accordance with the Creative Commons Attribution Non Commercial (CC BY-NC 4.0) license, which permits others to distribute, remix, adapt, build upon this work non-commercially, and license their derivative works on different terms, provided the original work is properly cited, appropriate credit is given, any changes made indicated, and the use is non-commercial. See http://creativecommons.org/licenses/by-nc/4.0/.
Statistics from Altmetric.com
Introduction
Hepatocellular carcinoma (HCC) is the most common malignant primary liver cancer, ranking as the sixth most common neoplasm and the fourth cause of cancer-related death globally.1 2 HCC morbidity is the highest in Eastern, Southern and Middle Asia.3 Current modalities for HCC treatment include transarterial chemoembolization (TACE), surgical resection, radiotherapy and chemotherapy.4 Although liver resection and transplantation remain the most effective treatments for early-stage HCC, they are not suitable for most patients with HCC, who have been at the advanced stage at the time of diagnosis. Only three systemic drugs, sorafenib and lenvatinib (frontline therapy) and regorafenib (second-line therapy), have been approved by the Food and Drug Administration (FDA) for advanced HCC treatment.2 4–9 Due to the lack of more efficient approaches, liver cancer is the second most lethal cancer type, with a 5-year survival rate of only 18%.2 Therefore, new therapeutic strategies for HCC should be developed urgently, especially promising combination therapies that aim to maximize the clinical benefit with minimize toxic effects.2
Immune cells that have infiltrated the HCC microenvironment play key roles in tumor cell initiation, growth, and metastasis. Among these immune cells, tumor-associated macrophages (TAMs) and CD8+ T cells represent the major components.9 10 Macrophages are critical in HCC pathogenesis.10 In general, macrophages can be polarized to M1 or M2 status in response to various signals.11 Classically activated macrophages, known as M1 (lipopolysaccharide (LPS) or interferon (IFN)-γ activated), produce proinflammatory and immunostimulatory cytokines (interleukin (IL)-1β, tumor necrosis factor (TNF)-α, INF-β1 and so on) to participate in antigen presentation and resultant anti-tumorigenic activity.12 Alternatively activated macrophages, known as M2 (IL-4 or IL-13 activated), produce anti-inflammatory and immunosuppressive effectors (Arg-1, IL-10, CD206 and so on), which exert pro-tumorigenic effects.13 In the HCC microenvironment, tumor cells can educate infiltrating macrophages and polarize them to M2-TAM while at the same time suppressing M1-TAM polarization, which further leads to the decline and exhaustion of cytotoxic T cells (CD8+T) in tumor tissues.14 15 Thus, the transformation of TAMs to the M1 phenotype is a potential strategy for HCC treatment.
Traditional Chinese medicines (TCMs) have been used to treat diseases for over 2500 years.16 Compound kushen injection (CKI, also known as Yanshu injection) is a TCM formula approved by National Medical Products Administration (NMPA) in China. The substance is extracted from the roots of two medical herbs, Kushen (Radix Sophorae flavescentis) and Baituling (Rhizoma Smilacis glabrae), through standardized Good Manufacturing Processes (GMPs).17 The primary bioactive alkaloids in CKI include oxymatrine, matrine, oxysophocarpine, and sophocarpine.17–19 CKI has been applied to treat various solid tumor types clinically for the last 20 years, including liver cancer, lung cancer, breast cancer, gastric cancer, colorectal cancer, and other cancer types.18–22 Notably, CKI was found to be effective in treating cancer-induced pain via the transient receptor potential cation channel subfamily V member 1 signaling.17 Previous reports have shown that CKI used alone or combined with conventional chemotherapy enhances antitumor efficacy, reduces chemotherapy-induced toxicity, and improves quality of life.17 21 22 For HCC, CKI increases the therapeutic efficacy of TACE against unresectable liver cancer.23–25 However, the effect of CKI on tumor immunity and its underlying mechanism remain poorly understood. Particularly, considering the different modes of action of immunotherapeutic (microenvironment-targeted) and chemotherapeutic drugs (tumor cell-targeted), it is necessary to illustrate the potential efficacy of combined treatment with CKI and chemotherapeutic drugs against HCC.
In the present study, we combined CKI with a subclinical dose of sorafenib to treat HCC. Low dosage reduced the toxicity of sorafenib, while anticancer activity was enhanced when combined with CKI. By regulating TAMs and CD8+ T cells, CKI also reduced tumor recurrence and elicited a long-term antitumor memory response. TNFR1 and the downstream NF-κB and p38 MAPK signaling cascades in macrophages were identified to mediate the immunomodulatory effects of CKI. These data provided evidence for the potential application of CKI in combination with low-dose sorafenib for HCC therapy.
Materials and methods
Animal models
C57BL/6 mice and BALB/c athymic nude mice (male, 4 weeks old) were obtained from Shanghai Slac Laboratory Animal (Shanghai, China) and fed in a pathogen-free vivarium under standard conditions. The principles and experimental protocols of animals used were approved by the Animal Care and Use Committee of Shanghai Institute of Nutrition and Health, SIBS, CAS.
To establish luciferase-labeled orthotopic HCC model, 1×10⁶ Hepa1-6 tumor cells stably expressing firefly luciferase were suspended in 50 µL Dulbecco’s Modified Eagle Medium (DMEM) (containing 20% Matrigel) and orthotopically injected into the liver of C57BL/6 mice under anesthesia with tribromoethanol (240 mg/kg, Sigma, Massachusetts, USA). After 7 days, tumor volumes were evaluated by bioluminescent imaging with the Xenogen IVIS imaging system (Perkin-Elmer, Fremont, California, USA). Mice were injected with 10 mg/mL D-luciferin (Alameda, California, USA) intraperitoneally at 150 µL per mouse 2 min before imaging. Then tumor-bearing mice were randomized into vehicle and different treatment groups, and the tumor growths were monitored every 5 days.
To establish the subcutaneous HCC model, Hepa1-6 or LPC-H12 cells (2×10⁶ in 100 µL (Fatal Bovine Serum) FBS-free medium containing 20% Matrigel) were injected into the left flanks of recipient mice. Tumor-bearing (about 0.5 cm in diameter) mice were randomized into control and different treatment groups. Tumors were measured by using vernier caliper and the volumes were calculated according to the formula 1/2a×b 2, where a was the long diameter and b was the short diameter.
In vivo macrophages and CD8+ T cell depletion
For macrophage depletion, mice bearing LPC-H12 tumors were injected intraperitoneally with 150 µL clodronate liposomes as the first dose and 100 µL clodronate liposomes every 3 days subsequently for longer depletion according to the manufacturer’s instructions. For CD8+ T cell depletion, mice bearing LPC-H12 tumors were injected intraperitoneally with 200 µg neutralizing anti-CD8 antibody every 4 days. Vehicle groups received an equivalent amount of saline or in vivo MAb rat IgG2a isotype (BioXcell, West Lebanon, USA).
Generation of bone marrow-derived macrophages and macrophage polarization
Bone marrow-derived macrophages (BMDMs, M0) were isolated by pestling the femurs of 8-week-old C57BL/6 mice and cultured for 7 days in Iscove's Modified Dulbecco's Medium (IMDM) containing 10% FBS and 20 ng/mL M-CSF after removal of red blood cells. The medium was changed every 3 days. To mimic tumor microenvironment, BMDM culture medium was changed to condition medium (CM) from Hepa1-6 for 24, 48 or 72 hours (Mhepa1-6) on day 5, 6 or 7, respectively. The CM was collected from Hepa1-6 tumor cells incubated in serum-free medium for 48 hours and added to fresh BMDM culture medium (with the ratio of 1:1). For M1 polarization, matured BMDMs incubated in IMDM containing 10% FBS with 100 ng/mL LPS and 50 ng/mL IFN-γ for 12 hours. For M2 polarization, matured BMDMs incubated in IMDM containing 10% FBS with 10 ng/mL IL-4 and 10 ng/mL IL-13 for 24 hours. For CKI incubation, CKI was added to the culture medium (CKI concentrations: 0.43, 0.66, 1.32 mg/mL, based on the total alkaloid concentration in CKI; incubation time: 12 hours for Mhepa1-6 and M1, 24 hours for M2). All cytokines were purchased from Peprotech (Rocky Hill, USA). The contents of the identified primary bioactive alkaloids in CKI were provided in online supplementary table 1.
Supplemental material
CD8+ T cell isolation and proliferation assays
Fresh mouse spleen tissue, isolated from 8-week-old C57BL/6 mice, was passed through a 70 µm Strainer (BD Falcon) to obtain single-cell suspensions, and then red blood cells were removed by lysis. CD8+ T cells were isolated from single-cell suspensions by using EasySep Mouse CD8+ T cell Isolation Kit (Stemcell Technology, Vancouver, Canada) according to the manufacturer’s instructions. For CD8+ T cell proliferation assay, CD8+ T cells were labeled with carboxyfluorescein succinimidyl amino ester (CFSE, Life Technologies, San Diego, California, USA) and cocultured with CKI-primed macrophages (CD8+T: macrophage=5:1, CD8+ T number: 2×10⁵) in l640 medium supplemented with 10% FBS, anti-CD3 (2.5 µg/mL, eBioscience) and anti-CD28 (5 µg/mL, eBioscience) for 72 hours. Then, the proliferation rate of CD8+ T cells was measured by flow cytometry and quantified by FlowJo V.10 software.
Tumor cell viability and lysis assays
For tumor cell viability assays, Hepa1-6 cells were plated in 96-well plates at 5000 cells per well in DMEM with 10% FBS. After incubated overnight at the incubator, CKI (0.43 mg/mL) and sorafenib (0, 10, 15, or 20 µM) were added into the medium. After 3 days, the cell number was quantitated using Cell TiterGlo ATP Luminescent assay kit (Promega, Madison, USA). For tumor cell lysis assay, Hepa1-6 cells stably expressing firefly luciferase were planted with CD8+ T cells, which were cocultured with CKI-primed macrophages before, in 96-well plates in 1640 medium with 10% FBS (CD8+T: Hepa1−6=12:1, total cell number: 5000), and incubated at 37℃ for 24 hours. To detect the lysis level of tumor cells, D-luciferin (10 µL per well) was added into the 96-well plates. The concrete fluorescence values of each well were measured by Fluoroskan FL Microplate Fluorometer and Luminometer (Thermo Fisher Scientific).
Statistical analysis
The data were analyzed by using GraphPad Prism V.7. The statistical significance of differences was examined with Student’s two-tailed t-test. Kaplan-Meier survival curves were plotted and were compared by log-rank test. Flow cytometry data were analyzed by FlowJo V.10. P values <0.05 were considered statistically significant.
Results
CKI sensitizes the therapeutic effect of low-dose sorafenib, reduces tumor recurrence and elicits a potent antitumor memory response against HCC
To investigate the combined effect of CKI and sorafenib, we determined the anti-HCC effect of sorafenib at a subclinical dose (10 mg/kg) and a clinical dose (30 mg/kg) in syngeneic mouse models. Although tumor growth was efficiently suppressed at 30 mg/kg (online supplementary figure 1A), sorafenib led to body weight loss (online supplementary figure 1B) and a significant increase in aspartate aminotransferase (ALT) and alanine aminotransferase (AST) (online supplementary figure 1C), suggesting that side effects, especially those related to liver toxicity, were induced. In contrast, a subclinical dose of sorafenib (10 mg/kg) resulted in compromised antitumor effects, along with no changes in body weight or liver and renal function (online supplementary figure 1B and C).
Supplemental material
To develop a safer but more efficient therapeutic strategy, we assessed the effect of combined treatment of CKI (150 µL per mouse) and subclinical dose of sorafenib in an orthotopic liver tumor model and two subcutaneous models in C57BL/6 mice. Here, CKI alone inhibited tumor growth; however, the combined treatment induced the most marked regression in both orthotopic and subcutaneous tumors (figure 1A-C). As expected, the combined therapy did not cause obvious weight loss in mice, hepatotoxicity or nephrotoxicity (online supplementary figure 2A, B and C), suggesting that this strategy might be potent in the treatment of HCC. Meanwhile, we also compared the therapeutic effect of CKI, as well as the combination treatment with different doses of sorafenib in LPC-H12 subcutaneous tumor model (online supplementary figure 3A). CKI combined with 10 mg/kg sorafenib showed an equivalent anti-HCC effect of clinical 30 mg/kg sorafenib (online supplementary figure 3A). Although CKI combined with 30 mg/kg dose sorafenib possessed the most effective anti-HCC effect (online supplementary figure 3A), this treatment induced a most significant increase in ALT and AST index (online supplementary figure 3E and F), suggesting that CKI could not reduce 30 mg/kg sorafenib-induced side effects. Taking account of the safety and antitumor efficiency, we chose CKI and 10 mg/kg sorafenib for the in vivo combined treatment dose in the following study.
Supplemental material
Supplemental material
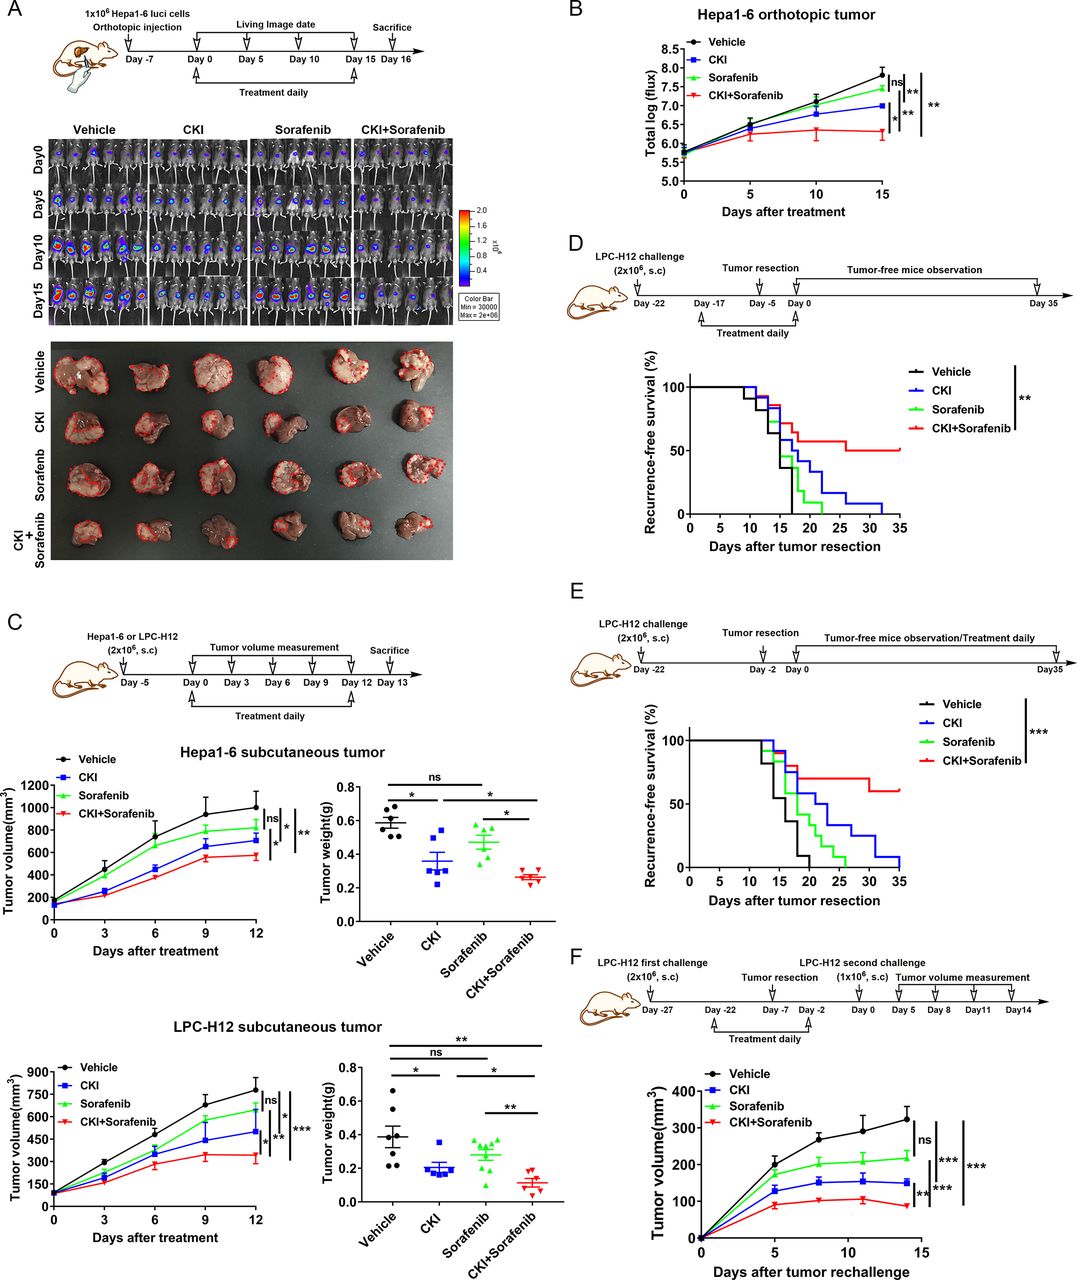
Compound kushen injection (CKI) combined with low-dose sorafenib suppressed liver cancer growth, reduced postsurgical recurrence and the growth of rechallenged tumors in mice. (A) The schedule of orthotopic liver cancer model treatment and imaging (above panel). Representative bioluminescence images of mice with orthotopic Hepa1-6 tumor burden (middle panel). Mice were treated daily with CKI intraperitoneally (150 µL), sorafenib intragastrically (10 mg/kg), CKI combined with sorafenib, or the vehicle (n=6 per group). Representative photographs of liver tumors after the indicated treatments; the red dotted lines indicate the tumor regions (below panel). (B) Relative luminescence changes of liver tumors depicted in (A) during the treatment. (C) The schedule of subcutaneous liver cancer model treatment and tumor measurement (above panel). A total of 2×10⁶ LPC-H12 or Hepa1-6 cells were separately injected into the left flanks of C57BL/6 mice (n=6–8 per group). Mice were treated daily with the indicated drugs in accordance with the orthotopic model. Tumor growth and tumor weight were measured. (D) The schedule of postsurgical cancer treatment and recurrence observation (above panel). Percentage of recurrence-free survival of mice was shown (vehicle, n=11; CKI, n=12; sorafenib, n=12; CKI+sorafenib, n=10). (E) The schedule of postsurgical cancer treatment and recurrence observation (above panel). Percentage of recurrence-free survival of mice was shown (vehicle, n=11; CKI, n=12; sorafenib, n=11; CKI+sorafenib, n=14). (F) The schedule of postsurgical tumor rechallenge model treatment and measurement (above panel). The volume of rechallenged tumor in mice was measured (n=7). Data are presented as means±SEM. NS, p>0.05; *p<0.05; **p<0.01; ***p<0.001.
To explore the influence of CKI and sorafenib combined treatment on the HCC recurrence, two surgical subcutaneous HCC resection and treatment models were established (figure 1D,E). Most mice in the vehicle group had relapses after tumor resection, whereas combined therapy, regardless of starting before or after surgery, significantly reduced postsurgical recurrence (figure 1D,E). Further, we explored whether the mice that received combined treatment had anamnestic responses to the rechallenged tumors. The tumor-bearing mice were operated to resect the tumors, and tumor cells were reimplanted (figure 1F). Although no treatment was performed after the second tumor challenge, the growth of the replanted tumors was inhibited in mice that had received CKI and combined treatment beforehand (figure 1F), suggesting that combined therapy induced the long-lived immunologic memory against HCC in mice.
CKI and low-dose sorafenib combination decreases the level of M2-TAMs and increases the ratio of M1-TAMs and CD8+ T in the tumor microenvironment
To investigate the influence of CKI combined with low-dose sorafenib on the HCC microenvironment, immune cells infiltrating into the tumors or circulating in the blood were examined by flow cytometry. In both orthotopic and subcutaneous tumors, the amount of total infiltrated immune cells was increased after CKI alone or combined treatment (online supplementary figure 4A). Meanwhile, CKI alone and the combined treatment induced a significant increase in the proportions of M1-TAMs and a reduction of M2-TAMs (figure 2A,B). M0 macrophages in Hepa1-6 subcutaneous tumors were also reduced (online supplementary figure 4B). CD8+ cytotoxic T cells were significantly increased in HCC tumors (figure 2A,B). Other immune cells such as CD4+ T cells, myeloid-derived suppressor cells (MDSCs), neutrophils, DC cells, and natural killer (NK) cells were not influenced significantly in the blood or tumor tissues, except that the combination therapy diminished MDSCs in the blood of Hepa1-6-bearing mice (online supplementary figure 4B and C). These phenomena were also observed in CKI and 30 mg/kg sorafenib combined treatment (online supplementary figure 3B-D). Besides the influence of treatment on immune cell populations, the expression of function-inhibitory receptors, including lymphocyte-activation gene 3 (Lag-3), programmed cell death protein 1 (PD-1), T-cell immunoreceptor with Ig and ITIM domains (TIGIT) and T-cell immunoglobulin and mucin-domain containing-3 (Tim-3), on CD8+ T cells were also determined (figure 2C). The combined treatment effectively reduced their surface levels on CD8+ T cells compared with other treatments (figure 2C). These results suggest that CKI and combined therapy resulted in fundamental remodeling of the tumor microenvironment through the action of macrophages and CD8+ T cells. It is notable that immunoregulatory effects are not observed in sorafenib-treated mice, which is consistent with the fact that sorafenib directly targets cancer cells. In immunohistochemical assays, tumor tissues in CKI or combination therapy groups showed a decline in M2-TAMs (Arg-1) as well as an increase in M1-TAMs (INOS) and CD8+ T cells (figure 2D). Besides this, cleaved caspase-3 and terminaldeoxynucleotidyl transferase mediated dUTP nick-end labeling (TUNEL) staining were enhanced (figure 2D), suggesting that the CKI combined treatment promoted the apoptosis of HCC cells in vivo.
Supplemental material

Compound kushen injection (CKI) combined with low-dose sorafenib decreased the distribution of M2-TAMs, increased the ratio of M1-TAMs and CD8+ T cells in the tumor microenvironment. (A) The proportion of tumor-infiltrating immune cells in mice tumor tissues after treatment was quantified by FACS. (B) Representative flow cytometry gating images show the percentages of CD8+ T cells, CD4+ T cells, M1-TAMs and M2-TAMs in mice orthotopic Hepa1-6 tumor tissues. (C) The expression of function exhaustion markers (Lag-3, PD-1, TIGIT and Tim-3) on CD8+ T cells after treatment was detected by flow cytometry. (D) Representative immunohistochemistry of INOS, Arg-1, CD8, cleaved caspase-3 and TUNEL stain in LPC-H12 tumor sections was shown. Data are presented as means±SEM. *p<0.05; **p<0.01; ***p<0.001. Arg-1, arginase 1; INOS, Induced nitric oxide synthase; Lag 3, lymphocyte activation gene 3; PD-1, programmed cell death protein 1; TAMs, tumor-associated macrophages; TIGIT, T-cell immunoreceptor with Ig and ITIM domains; Tim-3: T-cell immunoglobulin and mucin-domain containing-3; TUNEL, terminaldeoxynucleotidyl transferase mediated dUTP nck-end labeling.
Macrophages and CD8+ T cells are responsible for the anti-HCC activity of CKI and the combined treatment
To explore the role of immune microenvironment, we examined the therapeutic effect of CKI and combined treatment on HCC in nude mice. No tumor suppression was observed in any groups (online supplementary figure 5A). In vitro, we investigated whether CKI treatment had a distinct influence on CD8+ T cell proliferation and found that CKI had no effect on the proliferation of CD8+ T cells (online supplementary figure 5D). Moreover, CKI did not enhance the cytotoxicity of sorafenib to HCC cells in vitro (online supplementary figure 5E). Although nude mice lack T cells, there was still a significant increase in M1-TAMs and reduction of M2-TAMs in tumors after combined treatment (online supplementary figure 5B). CKI alone did not increase the M1-TAMs ratio; however, the M1/M2 fold change was still upregulated by CKI treatment, indicating the tumour microenvironment was still improved by CKI or combined treatment (online supplementary figure 5B and C). These results suggest that CKI improves the therapeutic efficiency of sorafenib through an immunomodulatory rather than cytotoxic mechanism.
Supplemental material
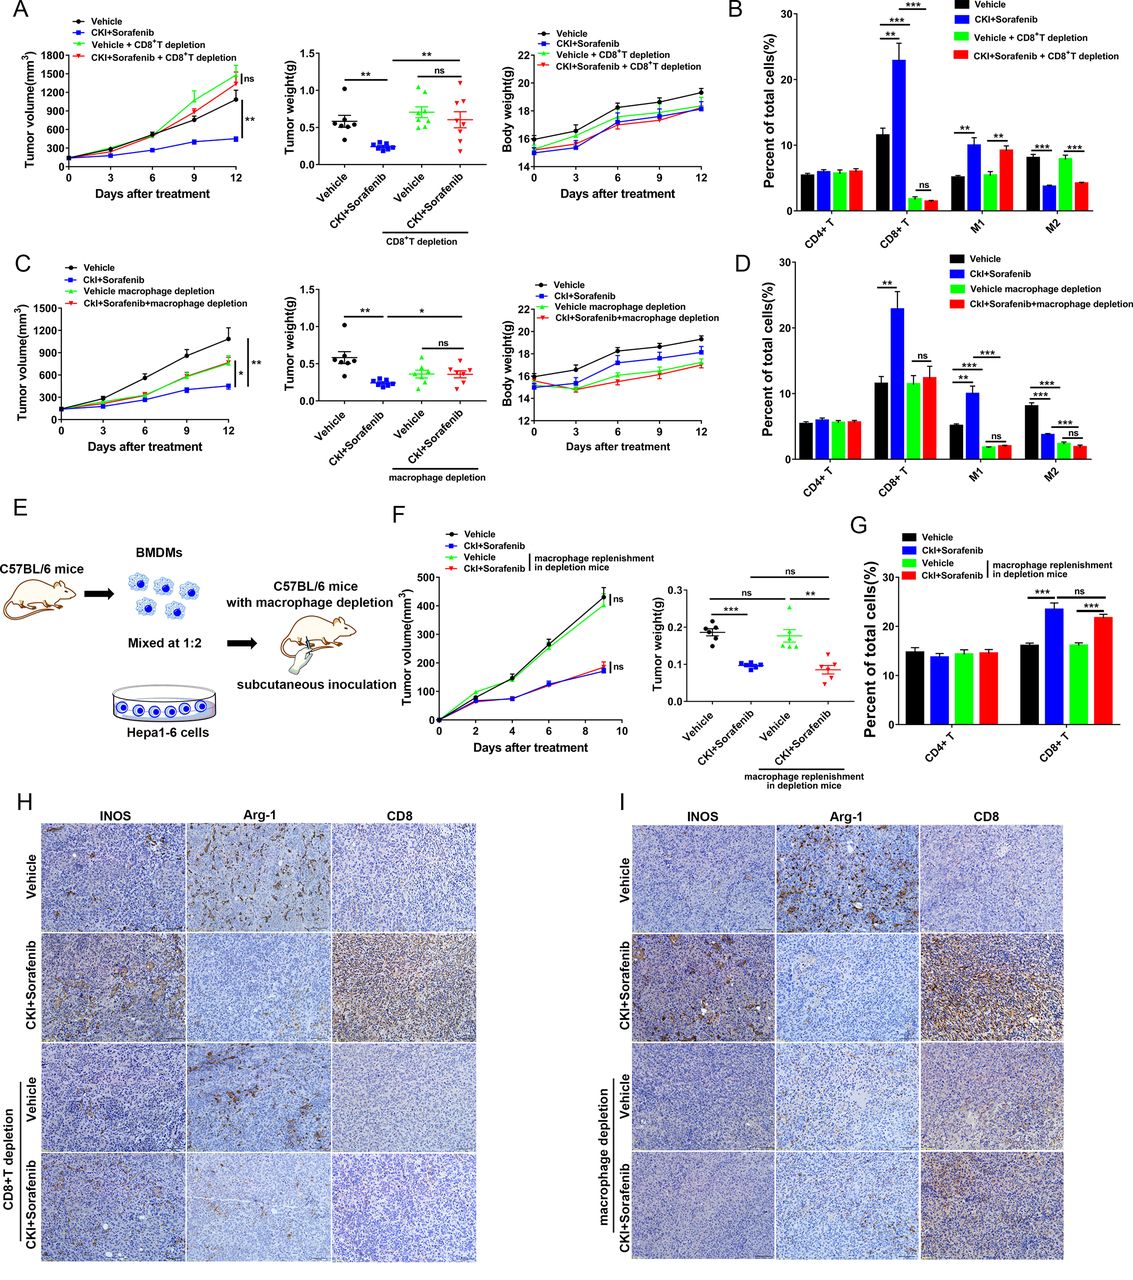
We further used the CD8-neutralizing antibody to block CD8+ T cells in C57BL/6 mice bearing HCC tumors. Here, we first assessed the CD8+ T cell depletion efficiency of CD8a-neutralizng antibody (online supplementary figure 6A). As expected, the Fluorescence Activated Cell Sorting (FACS) results showed that CD8+ T cells were efficiently depleted by anti-CD8 antibody, whereas the proportion of monocytes or macrophages was not changed in murine blood and spleen (online supplementary figure 6B). Then, we found that depletion of CD8+ T cells abolished the anti-HCC effect of CKI and sorafenib combined treatment (figure 3A), confirming the role of CD8+ T cells in combination therapy. After CD8+ T cell blockade, although the amount of intratumoral and blood CD8+ T cells was lower, there was still a significant increase in M1-TAMs and a decrease in M2-TAMs by combined treatment in the tumor tissues (figure 3B and online supplementary figure 7B), whereas the other types immune cells were not changed both in murine tumor or blood (online supplementary figure 7A and B). The M1/M2 fold change was still upregulated after combined treatment with CD8+ T cell depletion (online supplementary figure 7C), indicating that CD8+ T cells mediated the antitumor effect but not the macrophage immunomodulation by combined treatment. Moreover, immunohistochemical assays also showed that CD8+ T cell depletion did not influence the effect of combined treatment on M2-TAMs and M1-TAMs (figure 3H). Based on these results, we speculated that CKI indirectly enhanced CD8+ T cells’ function via activating macrophages in HCC microenvironment.
Supplemental material
Supplemental material

Depletion of macrophages or CD8+ T cells abolished the anti-hepatocellular carcinoma (HCC) effect of compound kushen injection (CKI) combined with low-dose sorafenib. (A) C57BL/6 mice (n=7–8) bearing LPC-H12 subcutaneous tumor were injected with neutralizing anti-CD8 antibody to deplete CD8+ T cells. After drug treatments, tumor growth, tumor weight, and body weight were measured. (B) The proportion of CD4+ T, CD8+ T, M1-TAMs, and M2-TAMs in CD8+ T cell-depleted tumors were determined by FACS. (C) C57BL/6 mice (n=7) were planted with LPC-H12 tumor cells subcutaneously and then treated with clodronate liposomes to deplete macrophages. After the indicated treatments, tumor growth, tumor weight, and body weight were measured. (D) The proportion of CD4+ T, CD8+ T, M1-TAMs, and M2-TAMs in macrophage-depleted tumors were determined by FACS. (E) Schematic diagram of macrophage replenishment in C57BL/6 with macrophage depletion by clodronate liposome. (F) The tumor growth and tumor weight were measured in different groups with the indicated treatments after macrophage replenishment. (G) The proportion of CD4+ T and CD8+ T cells in macrophage replenishment tumor tissues after treatments. (H) Immunohistochemical staining of INOS, Arg-1, and CD8 in CD8+ T cell-depleted LPC-H12 subcutaneous tumors. (I) Immunohistochemical staining of INOS, Arg-1, and CD8 in macrophage-depleted LPC-H12 subcutaneous tumors. Data are presented as means±SEM. NS, p>0.05; *p<0.05; **p<0.01; ***p<0.001. Arg-1, arginase 1; INOS, induced nitric oxide synthase.
Next, we explored the role of macrophages in C57BL/6 mice by using clodronate liposomes in C57BL/6 mice bearing subcutaneous LPC-H12 tumor. Both in murine blood and spleen, clodronate liposomes had an efficient depletion on monocytes or macrophages without effect on CD8+ T cells (online supplementary figure 6A and B). Macrophage depletion inhibited the tumor growth, supporting the facilitative role of tumor-infiltrated macrophages in cancer development (figure 3C). However, in mice with macrophage depletion, CKI and sorafenib combined treatment no longer suppressed the growth of tumors (figure 3C). Similarly, after depletion, the proportion of M1-TAMs, M2-TAMs or monocytes in the tumor microenvironment or murine blood remained low in both vehicle and treatment groups, while the proportion of CD8+ T cells was not elevated by CKI and sorafenib combined treatment (figure 3D and online supplementary figure 7B). In macrophage-depleted tumors, the intratumoral CD8+ T cells could not be induced by combined treatment (figure 3D,I), confirming the indispensability of macrophages for CD8+ T cell expansion, whereas the other types of immune cells were not changed in murine tumor or blood (online supplementary figure 7A and B). Here, we also found that the increased M1/M2 ratio by combined treatment was abolished by macrophage depletion (online supplementary figure 7C), indicating macrophage depletion also eliminated the combined treatment effect on M2 to M1 transition. To further confirm the role of macrophages in boosting CD8+ T cell antitumor function after combined treatment, we used hepa1-6 cells plus BMDMs to establish the macrophage replenishment tumor model in macrophage-depleted mice (figure 3E). Although the tumor growth in macrophage-depleted mice was slower, after replenishment of macrophages, the decreased growth by macrophage depletion was recovered (online supplementary figure 8), suggesting that the observed tumor growth in replenishment group which was comparable with that in control was mediated by macrophages. Importantly, the replenished macrophage-mediated tumor growth recovery from macrophage depletion was further inhibited by combined treatment (figure 3F). Correspondingly, combined treatment upregulated the infiltration of CD8+ T cells in macrophage depletion followed by replenishment group (figure 3G). Thus, CKI enhanced the anti-HCC effect of sorafenib by decreasing the M2-TAM distribution, elevating the level of M1-TAMs, and subsequently activating CD8+ T cells to enhance antitumor immunity.
Supplemental material
CKI induces polarization TAMs to M1 and enhances proinflammatory function
In the HCC microenvironment, macrophages can be primed to different statuses, including tumor-killing M1 activation and tumor-promoting M2 activation.11 Since CKI modulated the proportions of M1-TAMs and M2-TAMs in the HCC microenvironment, we determined the effect of CKI treatment on the polarization of macrophages (figure 4A). First, we assessed whether Hepa1-6 CM could make BMDMs polarize to an immunosuppressive status to mimic HCC microenvironment through coculturing BMDMs with Hepa1-6 CM for 24, 24 and 72 hours (online supplementary figure 9A). The results showed that BMDMs were polarized to a more anti-inflammatory status and acquired a more immunosuppressive function on the proliferation of CFSE-labeled CD8+ T cells with extending the Hepa1-6 CM coculture time (online supplementary figure 9A-D). Then Hepa1-6 CM-educated BMDMs (Mhepa1-6) were incubated with different concentrations of CKI in vitro. Flow cytometric analysis showed that CKI shifted the peak toward M1 polarization and resulted in a significant increase in M1 macrophages and concomitant decrease in M2 macrophages in a dose-dependent manner (figure 4B). Also, mRNA levels of M1 markers, as well as proinflammatory factors, were increased, while expression levels of M2 markers (anti-inflammatory factors) were reduced after CKI treatment (figure 4C and online supplementary figure 10). The same trends were observed in the concentrations of M1 and M2-related inflammatory cytokines or proteins (figure 4D). These results indicate that CKI primes macrophages toward M1 differentiation.
Supplemental material
Supplemental material
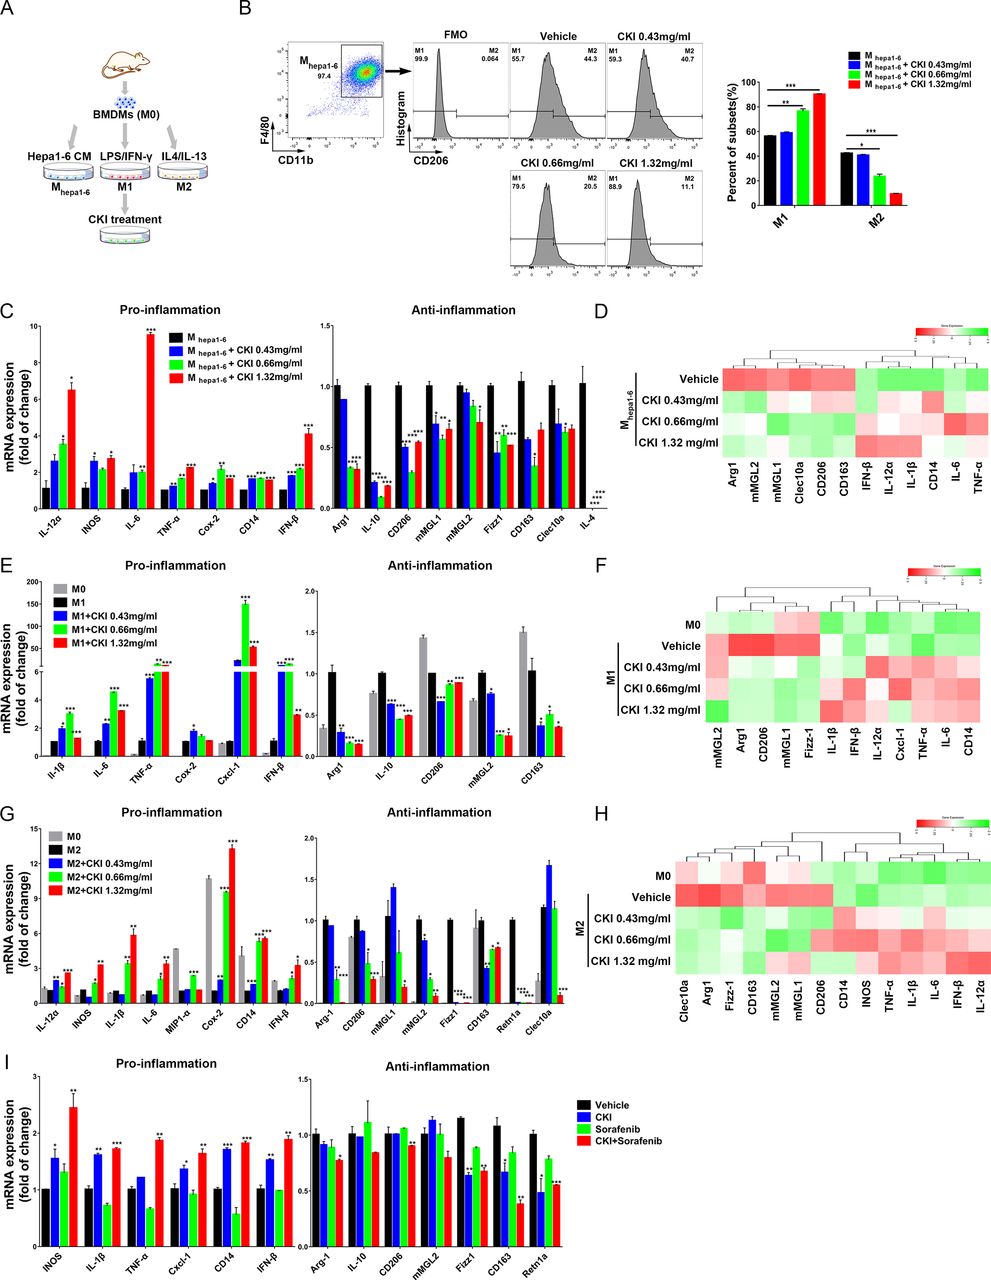
Compound kushen injection (CKI) promoted tumor-educated macrophage polarization to M1 status, enhanced proinflammatory function and reduced anti-inflammatory function. (A) Schematic diagram of bone marrow-derived macrophages (BMDMs) (M0) different polarization status after treatment conditioned medium (CM) for 24 hours (Mhepa1-6), 100 ng/mL LPS and 50 ng/mL IFN-γ for 12 hours (M1) or 10 ng/mL IL-4 and 10 ng/mL IL-13 for 24 hours (M2) followed by CKI treatment. (B) Mhepa1-6 were incubated with different concentrations of CKI for 12 hours. The proportion of M1 and M2 macrophages was determined by FACS. (C) The expressions of M1 (proinflammation) and M2 (anti-inflammation) macrophage markers in Mhepa1-6 with different doses of CKI treatment for 12 hours were determined by quantitative real-time PCR (qRT-PCR). (D) The contents of M1 and M2-related cytokines or proteins were measured by ELISA in CKI-primed Mhepa1-6 cell culture supernatant or cell lysates. (E and F) BMDMs (M0) were polarized to M1 status and treated with different doses of CKI for 12 hours. The expression of proinflammation and anti-inflammation genes was determined by qRT-PCR (E) or ELISA (F). (G and H) BMDMs (M0) were polarized to M2 status and treated with different doses of CKI for 24 hours. The expression of proinflammation and anti-inflammation genes was determined by qRT-PCR (G) or ELISA (H). (I) Tumor-associated macrophages were sorted from LPC-H12 subcutaneous tumors in mice after the indicated treatments. The mRNA levels of proinflammation and anti-inflammation genes were detected by qRT-PCR. Data are presented as means±SEM. *p<0.05; **p<0.01; ***p<0.001.
Next, we examined the influence of CKI on polarized macrophages. BMDMs were induced to M1 or M2 status and then treated with different doses of CKI. The expression of typical inflammatory factors was determined by qPCR and ELISA assays. In both M1 and M2 macrophages, CKI enhanced the levels of proinflammatory genes and downregulated anti-inflammatory factors in a dose-dependent manner (figure 4E–H), suggesting that CKI promoted the macrophages to switch to a dominant proinflammatory polarization. To verify the findings in vivo, we separated the tumor-infiltrating macrophages from HCC tumor burdens in mice and determined the levels of inflammatory factors. In mice treated with CKI and combined therapy, proinflammatory factors in the tumor-infiltrating macrophages were significantly elevated, and anti-inflammatory factors were repressed (figure 4I).
CKI-primed macrophages promote the proliferation and cytotoxic activity of CD8+ T cells, and relieve their exhaustion
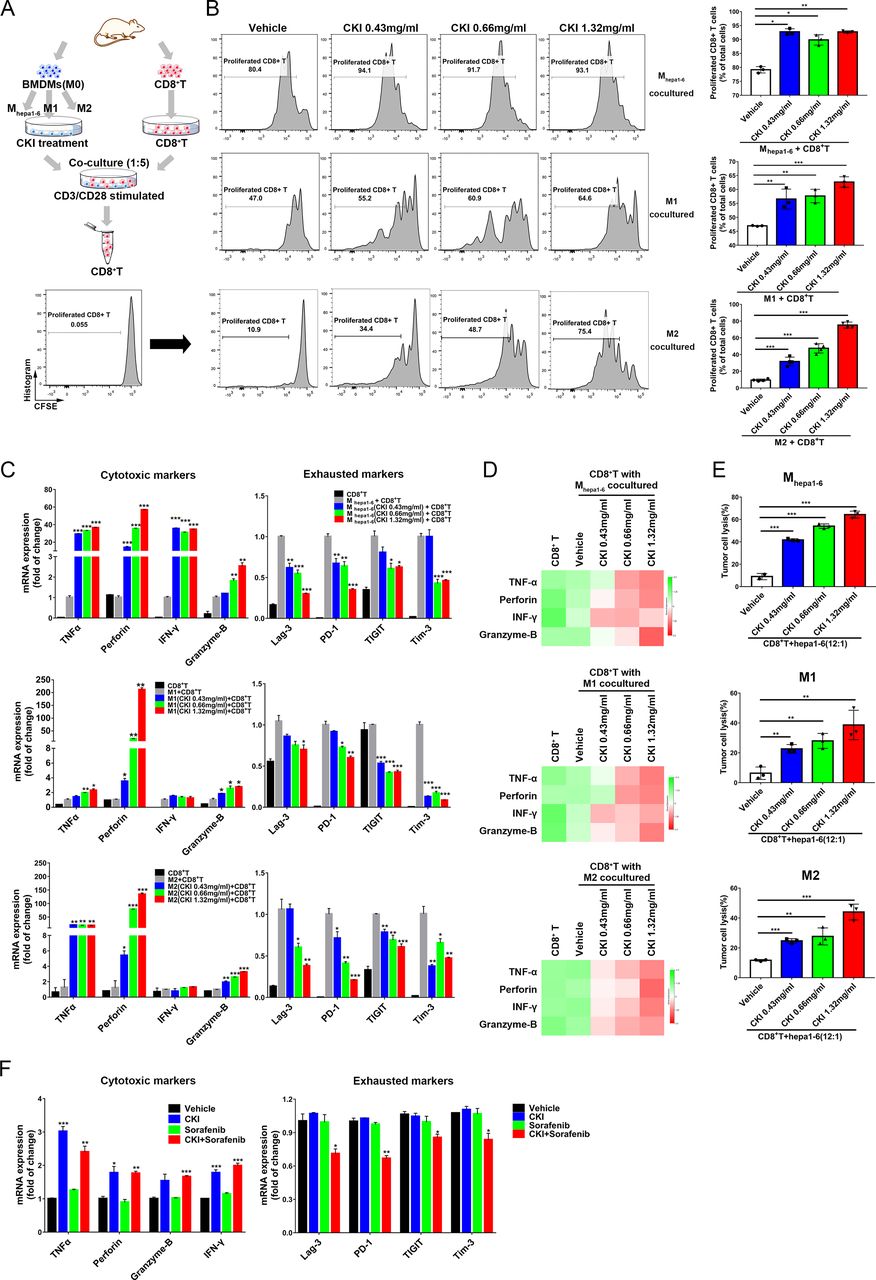
To explore the influence of CKI-primed macrophages on CD8+ T cells, primary CD8+ T cells were cocultured with Mhepa1-6, M1, or M2 macrophages which had previously been incubated with CKI (figure 5A). We found that despite CKI having been removed, CKI-treated Mhepa1-6, M1, and M2 macrophages promoted the proliferation of CD8+ T cells (figure 5B and online supplementary figure 9C and E). Importantly, CKI incubation released the immunosuppressive effect of Mhepa1-6 and M2 macrophages on the proliferation of CD8+ T cells in a dose-dependent manner (figure 5B and online supplementary figure 9C and E). Next, we determined the cytotoxic activity of CD8+ T cells. After coculture with CKI-primed Mhepa1-6, M1 or M2 macrophages, both gene expression and protein secretion of typical cytotoxic cytokines in CD8+ T cells were upregulated (figure 5C,D). To investigate how CKI-primed macrophages act on CD8+ T cells (mediated by contact-dependent effect or macrophage-produced soluble molecules), the CKI-primed Mhepa1-6 cell culture supernatant was collected and cocultured with CD8+ T cells (online supplementary figure 11). The proliferation levels of cytotoxic cytokines in CD8+ T cells, induced by CKI-primed Mhepa1-6 supernatant, were similar to CKI-primed Mhepa1-6(online supplementary figure 11), indicating that macrophage-produced soluble molecules were responsible for the function of CKI-primed macrophages on CD8+ T cells. We further examined the tumor-cell-killing activity of CD8+ T cells, which were cocultured with CKI-primed macrophages (CKI had been removed in advance), separated, and then coincubated with Hepa1-6 cells. The percentage of lysis of Hepa1-6 cells was significantly increased in CKI treatment groups (figure 5E), suggesting that the cytotoxic function of CD8+ T cells was markedly improved by CKI-primed macrophages. Moreover, levels of typical exhaustion-specific genes were diminished in CD8+ T cells that had been cocultured with CKI-primed macrophages previously (figure 5C). Cytotoxicity elevation and exhaustion remission of CD8+ T cells were confirmed in vivo (figures 2C and 5F). Notably, although cytotoxic markers were increased in CD8+ T cells from both CKI and combined treatment HCC tumors, all the levels of CD8+ T cell exhaustion markers were reduced in combined treatment, Lag-3 and Tim-3 decreased in the CKI alone treatment group (figures 2C and 5F), suggesting that sorafenib may contribute to relieving the exhaustion of CD8+ T cells in vivo. These results could partly explain why CKI combined with sorafenib treatment reduced tumor recurrence and elicited a potent antitumor memory response against HCC.
Supplemental material

Compound kushen injection (CKI)-primed macrophages improved the proliferation and tumor-killing ability of CD8+ T cells, and relieved exhaustion. (A) Schematic diagram of CKI-primed macrophage and CD8+ T cell coculture system (macrophages: CD8+ T ratio=5:1, CD8+ T number=2×10⁵) with anti-CD3 (2.5 µg/mL) and anti-CD28 (5 µg/mL) stimulation for 72 hours. (B) CD8+ T cells were labeled with carboxyfluorescein succinimidyl amino ester (CFSE) and cocultured with CKI-primed macrophages (Mhepa1-6, M1 and M2) for 72 hours. Representative plots of CFSE signal intensity of CD8+ T cells were described for CD8+ T stimulated by CD3/CD28 antibody and cocultured with vehicle or CKI-primed macrophages (left panel). The quantification of proliferated CD8+ T cells was calculated in different groups (right panel). (C) The expression of cytotoxic and exhausted markers in CD8+ T cells cocultured with CKI-primed macrophages (Mhepa1-6, M1 and M2) was determined by quantitative real-time PCR (qRT-PCR). (D) The contents of cytotoxic cytokines were measured in coculture supernatants by ELISA. (E) CD8+ T cells (cocultured with CKI-primed Mhepa1-6, M1, and M2 before) were coincubated with luciferase-labeled-Hepa1-6 cells for 24 hours (CD8+T: Hepa1-6 ratio=12:1, total cells number=5000). The lysis degree of Hepa1-6 tumor cells was monitored by fluorescence values. (F) CD8+ T cells were sorted from LPC-H12 subcutaneous tumors in mice with the indicated treatments. The mRNA levels of cytotoxic and exhausted genes in CD8+ T cells were determined by qRT-PCR. Data are presented as means±SEM. *p<0.05; **p<0.01; ***p<0.001.
CKI activates macrophages via triggering TNFR1 and its downstream NF-κB p65 and MAPK p38 signaling cascades
Macrophages can polarize to proinflammatory M1 status on stimulation by GM-CSF, IFN-β, IFN-γ, LPS, or TNFα through the corresponding receptors CSF2Rα, IFN-α/βR, IFN-γR, TLR4, or TNFR1.26 27 To elucidate the attribution of the effects of CKI on macrophages, we detected the expression of these receptors in TAMs from HCC tumor tissues. In mice treated with CKI, TAMs showed upregulated expression of IFN-γR, TLR4 and TNFR1 (figure 6A). This finding was confirmed in CKI-primed Mhepa1-6, M1, and M2 macrophages (figure 6B and online supplementary figure 12A). To explore the receptor responsible for the education of CKI to macrophages, we blocked TNFR1, TLR4, or IFN-γR with R-7050, Sparstolonin B, and anti-IFN-γR antibody in Mhepa1-6 cells. TLR4 or IFN-γR blockade did not affect CKI-mediated proinflammatory function and TNFR1 upregulation in macrophages (online supplementary figure 12B and C), whereas CKI-induced elevation of proinflammatory cytokines and TNFR1 was prevented by TNFR1 blockade (figure 6C and online supplementary figure 12C), suggesting that CKI primed macrophages by targeting TNFR1.
Supplemental material

Compound kushen injection (CKI) facilitated TNFR1 complex interaction and NF-κB p65 and MAPK p38 signaling cascade to play a proinflammatory function. (A) Tumor-associated macrophages were FACS sorted from LPC-H12 subcutaneous tumors in mice with the indicated treatments, and the mRNA levels of proinflammatory polarization-related receptors genes were detected by quantitative real-time PCR (qRT-PCR). (B) The expression of proinflammatory polarization-related receptors in Mhepa1-6 with 0.66 mg/mL CKI incubation for 12 hours was measured. (C) The expression of proinflammation and anti-inflammation genes in Mhepa1-6 exposed to 0.66 mg/mL CKI for 12 hours with TNFR1 blockade (R7050, 10 µM) was measured. (D) Cell surface level of TNFR1 in 0.66 mg/mL CKI-primed Mhepa1-6 was measured by FACS. (E) Mhepa1-6 cells were treated with 0.66 mg/mL CKI for 12 hours, and the binding between TNFR1 with TRADD, RIP1 and TRAF2 was determined by coimmunoprecipitation. (F) Mhepa1-6 cell were exposed to 0.66 mg/mL CKI for 12 hours and 10 ng/mL TNF-α for different time intervals, and the protein expression was determined by western blotting. (G) Mhepa1-6 were treated with 25 µg/mL anti-TNFR1 antibody (left panel) or 10 µM R7050 (right panel) for 4 hours before 0.66 mg/mL CKI treatment for another 12 hours, then stimulated by 10 ng/mL TNF-α for 30 min. The amount of TRAF2, phosphorylated and total TAK1, P65 and P38 expression were quantified by western blotting. (H) Mice with subcutaneous LPC-H12 tumor burden were treated with CKI and sorafenib daily (CKI, 150 µL; sorafenib, 10 mg/kg), anti-TNFR1 antibody (100 µg per mouse, every 4 days), R-7050 (10 mg/mL, every 3 days) or the vehicle (n=7 per group). Tumor growth and tumor weight were measured. Data are presented as means±SEM. NS, p>0.05; *p<0.05; **p<0.01; ***p<0.001. TNF-α, tumor necrosis factor α; TNFR1, TNF receptor superfamily member 1.
On this basis, we determined the influence of CKI on TNFR1 activation and its downstream signaling. Flow cytometry analysis showed the expression of TNFR1 on Mhepa1-6 cell surface was increased by CKI incubation (figure 6D). Besides this, the association of TNFR1 with TRADD, RIP1, and TRAF2 was enhanced (figure 6E), suggesting that CKI facilitated the formation of protein complexes necessary for TNFR1 activation. The protein level of TRAF2, which eventually bridges the TNFR1 complex to trigger the downstream signaling, was also upregulated (figure 6E). These results indicate that CKI enhances the activation of TNFR1 signaling. Consistently, the amounts of p-TAK1, p-IKKα/β, p-IκBα, p-P65, and p-P38 were induced more intensely in Mhepa1-6 after CKI incubation (figure 6F), whereas CKI treatment had little effect on JNK and ERK (online supplementary figure 12D). When cell-surface TNFR1 was neutralized by anti-TNFR1 antibody or the formation of TNFR1/TRADD/RIP1 complex was inhibited by R-7050, the enhanced expression of TRAF2, p-TAK1, p-P65, and p-P38 induced by CKI was also blocked (figure 6G).
CKI sensitizes HCC to the therapeutic effects of subclinical dose sorafenib through TNFR1
Mice bearing LPC-H12 subcutaneous tumors were injected with anti-TNFR1 antibody or R-7050 intraperitoneally during CKI and sorafenib combined treatment. Anti-TNFR1 antibody or R-7050 abolished the anti-HCC effect of CKI combined with sorafenib (figure 6H and online supplementary figure 12E), indicating that TNFR1 mediates the therapeutic effects of CKI. In summary, CKI acts on macrophages to facilitate the association of TNFR1 with TRADD/RIP1/TRAF2 and trigger downstream NF-κB and MAPK p38 pathways which plays proinflammatory functions, tunes TAM status toward M1 activation, and reverses the polarization of M2-TAMs. CKI-primed macrophages further promote the proliferation and tumor-killing activity of CD8+ T cells to induce HCC cells apoptosis, protect functional CD8+ T cells from exhaustion to maintain anti-HCC immunologic memory activity, and finally suppress HCC tumor growth and recurrence. Owing to the anti-tumor mechanisms of two drugs that mutually reinforce each other, combined treatment of CKI with a subclinical dose of sorafenib could greatly strengthen therapeutic efficacy against HCC while increasing safety (figure 7).

Schematic depiction of the reconstruction of the hepatocellular carcinoma (HCC) microenvironment by compound kushen injection (CKI) and its therapeutic effects when combined with low-dose sorafenib. INOS, induced nitric oxidesynthase; IFN-β, interferon-β; IL, interleukin; Lag-3, lymphocyte-activation gene 3; Tim-3, T-cell immunoglobulin and mucin-domain containing-3; TIGIT, T-cell immunoreceptor with Ig and ITIM domains; TNF-α, tumor necrosis factor α.
Discussion
CKI, as a TCM formula, has been approved by NMPA to treat cancer-induced pain.17 The application of CKI for the treatment of a variety of cancer types has also been studied in breast cancer,19 colon cancer,20 non-small cell lung cancer,21 acute leukemia,22 and HCC.23–25 Sorafenib, the first frontline drug, has been widely used for advanced HCC therapy for a long time. However, only 30% of patients with HCC can benefit from sorafenib due to severe adverse effects, acquired resistance, tumor heterogeneity, and an immunosuppressive microenvironment.28 29 In this study, we combined CKI with a subclinical dose of sorafenib to treat HCC. This new strategy represents significant progress. First, lowering the dosage of sorafenib could drastically reduce the adverse effect of sorafenib, which overcomes the toxicity issues. Second, CKI modulated the microenvironment, while sorafenib directly targeted the tumor cells. These distinct modes of action promoted of anticancer activity and achieved significant tumor suppression. Third, CKI protected CD8+ T cells with immunologic memory against HCC, thus preventing recurrence and achieving better prognosis than using sorafenib alone. The depletion of macrophages or CD8+ T cells abolished the anticancer effect of combined treatment, confirming the importance of these immune cells for the therapy.
HCC is aggressive, and effective therapeutic treatments are still limited.4 Immunotherapy has been investigated as an option for cancer treatment.30 Promising approaches to activate therapeutic antitumor immunity have been designed to expand the infiltration of cytotoxic CD8+ T cells into the tumor microenvironment and inhibit immune suppressor molecules such as CTLA-4, PD-1, Tim-3, Lag-3, and TIGIT, also known as immune checkpoint blockade.31–33 Among them, the anti-CTLA-4 antibody, ipilimumab, and two anti-PD-1 antibodies, Pembrolizumab and Nivolumab, have been approved by the FDA to treat cancers.32 However, for some types of tumors, owing to the complexity of the immunosuppressive microenvironment, targeting CD8+ T cells alone is unlikely to be sufficient for cancer treatment in the clinic.34
The established HCC microenvironment develops an anti-inflammatory stroma and recruits immunosuppressive immune cells such as MDSCs and TAMs, which block the process of antigen presentation and directly inhibit the proliferation and cytotoxic functions of CD8+ T cells.35 Notably, TAMs are the primary immunosuppressive cells in the liver cancer microenvironment.36 TAM-based anti-HCC therapies include the inhibition of macrophage recruitment, suppression of TAM survival, enhancement of the M1 tumoricidal activity of TAMs, and the blockade of M2 tumor-promoting activity.13 36 37 Our results showed that CKI and sorafenib polytherapy reduced the ratio and polarization toward M2-TAMs, while enhanced the distribution and polarization of M1-TAMs in the tumor microenvironment. In Hepa1-6 CM-educated macrophages, CKI dose-dependently elevated the production of M1-TAM-specific cytokines (IL-12α, INOS, IL-1b, IL-6, TNF-α, Cox-2, CD14 and IFN-β) and eliminated factors related to M2-TAMs (Arg-1, IL-10, CD206 mMGL1, mMGL2, Fizz-1, CD163, Retn1a, and Clec10a). In addition, CKI-primed macrophages also alleviated the immunosuppressive effect on CD8+ T cells. In the macrophages and CD8+ T cell coculture system, the proliferation of CD8+ T cells was improved by macrophages pretreated with CKI, suggesting the activation of CD8+ T cells. Cytotoxic factor secretion (TNF-α, Perforin, Granzyme-B, and IFN-γ) and the lysis of tumor cells by CD8+ T cells were enhanced by CKI-primed macrophages, suggesting that cytotoxic activity against cancer was reawakened.
In addition, under conditions of chronic antigen exposure and inflammation, T cells become functionally incapable of performing effector activities, a state termed T-cell exhaustion.38 Most T cells in the tumor microenvironment are exhausted,31 which can be induced by diverse cell populations including regulatory T cells, M2-TAMs, MDSCs, and tumor cells.32 39–41 In our study, following CKI and sorafenib combined treatment in vivo or coincubation with CKI-primed macrophages in vitro, the exhaustion statuses of CD8+ T cells were relieved, represented as reduced levels of inhibitory receptors (Lag-3, PD-1, TIGIT, and Tim-3). The activated immune system can generate the persistence of tumor-antigen specialized memory T cells which allows efficient recall response against tumor recurrence.32 Consistent with this, combined treatment with CKI and sorafenib inhibited tumor formation and growth in our postsurgical recurrence models as well as our tumor rechallenge model. Because CKI alone or combined treatment does not completely eradicate the tumor growth, it was possible that more HCC recurrence would happen even after combined treatment because of the complexity of tumor microenvironment.
The NF-κB pathway is a central orchestrator of liver carcinogenesis.42 During the early phase of tumorigenesis, NF-κB pathway activation in M1 macrophages is critical for cancer-related inflammation.43 However, at the late phase of tumorigenesis, TAMs are educated to M2 polarization in the tumor microenvironment displaying low NF-κB pathway activation but increased immunosuppressive capacity.44 As a result, switching M2-TAMs to M1-TAMs to promote NF-κB pathway activation represents a promising strategy for tumor microenvironment remodeling.44 We found that CKI could switch M2 to M1 status and play a proinflammatory function in macrophages via the TNFR1/NF-κB and MAPK axis in vivo and in vitro, providing evidence of how CKI acts on TAMs to reverse TAM-mediated immunosuppression.
In summary, CKI decreased the distribution and polarization of M2-TAMs, promoted the proportion and polarization toward M1-TAMs in the HCC tumor microenvironment, subsequently alleviated the immunosuppressive effect on CD8+ T cells, and eventually enhanced tumor cytotoxicity and anti-tumor memory effects. The combination of CKI with a subclinical dose of sorafenib efficiently suppressed the growth and recurrence of HCC with no obvious toxicity. Our findings provide preclinical evidence to show that the combination of TCMs with chemotherapy may have important implications in human HCC therapy, and that CKI could be a promising candidate.
Supplemental material
Supplemental material
Acknowledgments
We thank Dr Haiwei Zhang and Dr Zhimin Hu (CAS Key Laboratory of Nutrition, Metabolism and Food safety, Shanghai Institute of Nutrition and Health, Shanghai Institutes for Biological Sciences, University of Chinese Academy of Sciences, Chinese Academy of Sciences, Shanghai, China) for the helpful discussions. We would also like to thank Mrs Yu Lu and Mr Hao Wang (School of Public Health, Shanghai Jiao Tong University School of Medicine, Shanghai, China) for the assistance in conducting murine experiments.
References
Footnotes
Contributors YY, CY, QB and HW conceived and designed the experiments. YY, CY, QB and HW analyzed data and wrote the manuscript. HW supervised the project. YY, MS, WY, FW and ZG performed the in vitro and in vivo studies. XL and JQ provided writing assistance. RY and WW provided assistance in pharmacological mechanisms. LQ provided flow cytometry assistance.
Funding This work was supported by grants from the National Key R&D Program of China (2018YFC2000700), the National Natural Science Foundation of China (81630086 and 81973078), the Key Research Program of the Chinese Academy of Sciences (ZDRW-ZS-2017-1), Shanghai Municipality Health Commission (2017YQ0059), Shanghai Municipal Human Resources and Social Security Bureau (2018060), the Major Science and Technology Innovation Program of Shanghai Municipal Education Commission (2019-01-07-00-01-E00059), and Shanghai Jiao Tong University (YG2017MS85).
Competing interests None declared.
Patient consent for publication Not required.
Ethics approval All animals used in the present study was approved by the Animal Care and Use Committee of Shanghai Institute of Nutrition and Health, SIBS, CAS.
Provenance and peer review Not commissioned; externally peer reviewed.
Data availability statement All data relevant to the study are included in the article or uploaded as supplementary information.