Article Text

Abstract
Background Adaptive CD19-targeted chimeric antigen receptor (CAR) T-cell transfer has become a promising treatment for leukemia. Although patient responses vary across different clinical trials, reliable methods to dissect and predict patient responses to novel therapies are currently lacking. Recently, the depiction of patient responses has been achieved using in silico computational models, with prediction application being limited.
Methods We established a computational model of CAR T-cell therapy to recapitulate key cellular mechanisms and dynamics during treatment with responses of continuous remission (CR), non-response (NR), and CD19-positive (CD19+) and CD19-negative (CD19−) relapse. Real-time CAR T-cell and tumor burden data of 209 patients were collected from clinical studies and standardized with unified units in bone marrow. Parameter estimation was conducted using the stochastic approximation expectation maximization algorithm for nonlinear mixed-effect modeling.
Results We revealed critical determinants related to patient responses at remission, resistance, and relapse. For CR, NR, and CD19+ relapse, the overall functionality of CAR T-cell led to various outcomes, whereas loss of the CD19+ antigen and the bystander killing effect of CAR T-cells may partly explain the progression of CD19− relapse. Furthermore, we predicted patient responses by combining the peak and accumulated values of CAR T-cells or by inputting early-stage CAR T-cell dynamics. A clinical trial simulation using virtual patient cohorts generated based on real clinical patient datasets was conducted to further validate the prediction.
Conclusions Our model dissected the mechanism behind distinct responses of leukemia to CAR T-cell therapy. This patient-based computational immuno-oncology model can predict late responses and may be informative in clinical treatment and management.
- immunotherapy
- computational biology
Data availability statement
All data relevant to the study are included in the article or uploaded as online supplemental information. The code and data for the computational model are available on Github (https://github.com/Lunan12/CAR-T-model).
This is an open access article distributed in accordance with the Creative Commons Attribution Non Commercial (CC BY-NC 4.0) license, which permits others to distribute, remix, adapt, build upon this work non-commercially, and license their derivative works on different terms, provided the original work is properly cited, appropriate credit is given, any changes made indicated, and the use is non-commercial. See http://creativecommons.org/licenses/by-nc/4.0/.
Statistics from Altmetric.com
WHAT IS ALREADY KNOWN ON THIS TOPIC
Anti-CD19 chimeric antigen receptor (CAR) T-cell therapy has become a promising treatment for leukemia, but patient responses vary across different clinical trials, illustrating the need for reliable methods to dissect and predict patient responses.
WHAT THIS STUDY ADDS
This study provides a new computational immuno-oncology model of CAR T-cell therapy to predict late responses from early-stage clinical data, and reveals key determinants leading to remission, resistance, and relapse responses.
HOW THIS STUDY MIGHT AFFECT RESEARCH, PRACTICE OR POLICY
We provide a precision medicine tool to dissect and predict leukemia patient responses to CAR T-cell therapy that may be informative in personalized clinical treatment and management.
Introduction
By modifying autologous T-cells to express a chimeric antigen receptor (CAR)-targeting CD19 antigen on B-cells, anti-CD19 CAR T-cell therapy has become a promising immunotherapy for B-cell acute lymphoblastic leukemia (B-ALL).1–3 However, clinical B-ALL cases have demonstrated stochastic responses and non-response (NR) to CAR T-cell therapy.4 Continuous/complete remission (CR) is achieved in 70%–90% of pediatric and adult patients, whereas long-term studies have shown that 30%–60% of patients encounter either CD19-positive (CD19+) or CD19-negative (CD19−) relapse.5 Although various CAR T-cell products and combinational therapies have been tested in clinical trials to improve patient response,5 6 numerous questions remain and the need persists to systematically understand the causes of the varied therapeutic responses. Thus, new clinical models that can predict patient responses to CAR T-cell treatment is critical for screening the most effective treatment protocol for individual patients.
Recently, computational models, based on empirical rationales and mathematic simulations with input of clinical data, have provided valuable tools for in silico and systematical analysis of key biological mechanisms and patient responses in cancer immunotherapy.7 8 Up-to-date computational modeling of CAR T-cell therapy are in the early stages of development, with applications of model-informed response prediction still being limited. For example, a multiscale physiological-based, pharmacokinetic-pharmacodynamic model has been developed for a quantitative study of the relationship between CAR-affinity, antigen abundance, tumor cell depletion, and CAR T-cell expansion using data collected from xenograft mouse models.9 Other approaches have focused on modeling factors underlying CAR T-cell dynamics, such as how ecological dynamics that regulate CAR T-cells explain expansion10 and exhaustion,11 signaling-induced cell state variability,12 and CAR T-cell expansion owing to lymphodepletion and competitive growth between CAR T-cells and normal T-cells.13 Recently, Liu et al developed a model to characterize clinical CAR T-cell kinetics across response statuses, patient populations, and tumor types, but only in a retrospective manner.14 However, these computational models typically fail to provide a collective analysis and effective interpretation of clinical trial data from different clinical studies to reveal the key cellular mechanisms underlying the heterogeneous patient outcomes observed in different clinical trials. Critically, a clinical data-based prognostic model that can predict patient responses to CAR T-cell treatment at an early stage is largely absent.
In this study, we developed a mathematical framework of CAR T-cell therapy structured with a matrix of ordinary differential equations for a quantitative study and in silico modeling of key biological mechanisms in CAR T-cell therapy, such as leukemia cell growth and apoptosis, CAR T-cell activation, expansion, cytotoxic efficiency, and CD19 antigen-mediated relapse mechanisms. After calibration and validation with clinical data from 209 leukemia patients, our computational model revealed key determinants that depicted the heterogeneous clinical responses between the responders, non-responders, and patients with CD19+/CD19− relapse. Clinical trial simulation is used to study the effects of a therapy in virtual patient cohorts using mathematical models of physiological systems, which, to some extent, enlarges sampling for clinical trials and applies a full range of mechanistic testing.15 16 Incorporating this concept, we performed a clinical trial simulation of CAR T-cell therapy using virtual patient cohorts generated based on real clinical patient datasets. It was demonstrated with the input of early-stage clinical data that our model successfully predicted the late therapeutic outcomes of most patients under CAR T-cell treatment, which may be informative in clinical therapy and lead to a more customized and targeted treatment with superior outcomes.
Methods
Model construction
CD19+ B-ALL Cell
It is assumed that the proliferation of CD19+ B-ALL cell subjects to logistic growth,17 and they are eliminated by activated CAR T-cells as follows:
 (1)
(1)
where nP (P represents positive) is the number of CD19+ B-ALL cells, nC is the carrying capacity of B-ALL cells in the tumor microenvironment, nTA is the number of activated CAR T-cells, and e is their killing rate. The efficacy of the elimination of B-ALL cells is based on Michaelis-Menten kinetics with a Michaelis constant, KP, denoting the saturation effect from B-ALL cells to killing efficacy. Among the CAR T-cell therapy outcomes, CR is defined as a decrease in bone marrow tumor burden that remains below 5%, whereas for NR cases, the tumor burden increases without control.
CAR T-cell activation
CAR T-cells kill B-ALL cells after being activated by CD19+ B-ALL cells from an initial non-activated status. The generation of activated CAR T-cell can be expressed as follows:
 (2)
(2)
where rTA is the growth rate of activated CAR T-cells, kA is the activation rate from initial non-activated CAR T-cells, nTN is the number of non-activated CAR T-cells, and lTA is the apoptosis rate of activated CAR T-cells. The growth and activation rates of CAR T-cells are affected by CD19+ B-ALL cells with saturation constants Kr and KA, respectively.
Thus, the variation of non-activated CAR T-cell can be expressed as follows:
 (3)
(3)
where the first term represents the conversion to activated status, and lTN is the apoptosis rate of non-activated CAR T-cells.
CD19+ and CD19− relapse
Relapse is defined as the bone marrow tumor burden increasing above 25% within 2 years after initially decreasing below 5%.18 In CD19+ relapse, CD19 antigens are still present on the surface of B-ALL cells and can be detected using flow cytometry; thus, the model of CD19+ relapse can still be described by equations (1)–(3). However, the response of CD19+ relapse is different from that of CR, and the key mechanism lies in the poor function (expansion, cytotoxicity, and persistence) of CAR T-cells.19 For CD19+ relapse patients, CAR T-cell parameters in the model, such as the growth, killing, activation, and apoptosis rates, should be inferior to those of CR patients.20
In CD19− relapse, CD19 antigen absent B-ALL cells exist, causing tumor cells to evade CAR-mediated recognition and clearance irrespective of CAR T-cell persistence.5 The mechanism of CD19 loss is attributed to immune pressure selection (CD19-negative tumor cells have existed before CAR T-cell therapy) and CD19 gene mutation (eg, alternative slicing with loss of exon 2).21 In CD19− relapse, although CAR T-cells cannot eliminate CD19− tumor cells through antigen recognition, activated CAR T-cells can mediate tumor lysis against the antigen-negative fraction in an antigen-independent, cell-cell contact-mediated manner in the vicinity of the target cells, known as the bystander killing effect.22 Thus, the variation of CD19− tumor cells can be expressed as follows:
 (4)
(4)
where nN (N represents ‘negative’) is the number of CD19− tumor cells, km is the mutation factor causing CD19 loss from CD19+ B-ALL cells, kb is the bystander killing scaling factor to the CD19+ killing efficacy, and KN is the saturation constant depicting the effect of bystander killing on CD19− B-ALL cells.
Collecting and processing clinical data
Real-time data of CAR T-cells and tumor burden, including the information of 209 patients, were collected from clinical studies.20 23–31 For some studies, clinical data are available on individual patients; however, for other studies, individual data had been preprocessed and only statistical values such as medians were provided. Thus, we referred to one piece of available clinical data (containing one or several individuals) as a group. The reliability of the calibration process and the rationality of the computational model are maintained since statistical values were regarded as representative individuals. After summarizing the data in references, we had 32 groups (14 for CR, 7 for NR, 7 for CD19+ relapse, and 4 for CD19− relapse) including the clinical information of 209 individuals (148 for CR groups, 24 for NR groups, 20 for CD19+ relapse groups, and 17 for CD19− relapse groups) (online supplemental tables S1–4). After merging individual data into groups, we converted data from peripheral blood to bone marrow and unified the units of B-ALL cells and CAR T-cells. Details can be found in online supplemental methods.
Supplemental material
Parameter estimation
Parameter estimation at population (based on fixed effects) and individual (based on random effects) levels were conducted using the stochastic approximation expectation maximization (SAEM) algorithm for nonlinear mixed-effect modeling (NLME) using the MonolixSuite (version 2020R1, Lixoft, France) software. The MonolixSuite algorithm ensures repeatability and consistency in multiple fits. The estimated population level-parameters, initial values, and individual level-parameters related to CAR T-cells and tumor cells of different responses are listed in online supplemental table S5 and S6. We conducted identifiability analysis to evaluate the reliability of parameter estimation. Structural identifiability was accessed using the Structural Identifiability Toolbox (https://maple.cloud/app/6509768948056064) based on the SIAN (Structural Identifiability ANalyser) algorithm.32 The outputs indicated that all the parameters are globally identifiable. Practical identifiability analysis was based on correlation matrices33 34 obtained from Fisher information using Monolix. The maximal correlation coefficients of different parameters are summarized in online supplemental figure S1. The highest correlation coefficient was approximately 0.8 (not close to 1), exhibiting good identifiability.35
Generating virtual patient cohorts
We first confirmed that the clinical parameters could be largely fitted into Gaussian distribution (online supplemental figure S2). The parameters of virtual patient cohorts were thus generated in adherence to Gaussian distribution with mean value μ equaling the population level-parameters (online supplemental table S5) of CR, CD19− relapse, CD19+ relapse, and NR patients. The rationality was confirmed as the mean of the Gaussian distribution of virtual patients was close to the mean of the Gaussian distribution of clinical patients (online supplemental figure S2). The SD was 1/3 μ, ensuring the parameters are larger than 0.
For each population level-parameter of each response, we generated 400 sets of parameters for CR (online supplemental table S7), CD19− relapse (online supplemental table S8), CD19+ relapse (online supplemental table S9), and NR (online supplemental table S10), respectively.
Statistics
Data were first analyzed for normality and then compared with unpaired Student’s t-test or Welch’s t-test by using Prism V.8.4.3 (GraphPad). *p<0.05, **p<0.01, and ***p<0.001 were considered significant. The results, including the error bars in the graphs, were provided as the mean±SE of mean (SEM) or boxplots with whiskers of min-max values. Details are reported in each figure caption.
Results
A computational model of CAR T-cell immunotherapy
To construct a computational model of CAR T-cell therapy that reproduces the pathophysiological processes and immunological interactions, we framed a matrix of ordinary differential equations and calibrated the model as defined in the Methods section. To fit and calibrate our model, we searched and collected clinical data of 209 B-ALL patients from ten clinical trials of anti-CD19 CAR T-cell therapies and sampled them into 32 groups (online supplemental tables S1–4). The clinical data were assigned into different patient cohorts, that is, CR, NR, CD19+ relapse, and CD19− relapse (figure 1), based on flow cytometry and quantitative PCR (qPCR) monitoring of CAR T-cells in the blood, as well as morphological testing of leukemia burden in the bone marrow. To minimize the variation across different batches and clinical trials, we unified and transformed all the clinical data at a scale equivalent to the bone marrow level. Model fitting and parameterization processes were provided accordingly. For a dataset including different individuals, SAEM first fits the data as a group and estimates parameters on population level (population-level parameters). Random effect is then adopted to estimate the parameters of each individual (individual-level parameters) based on population-level parameters.
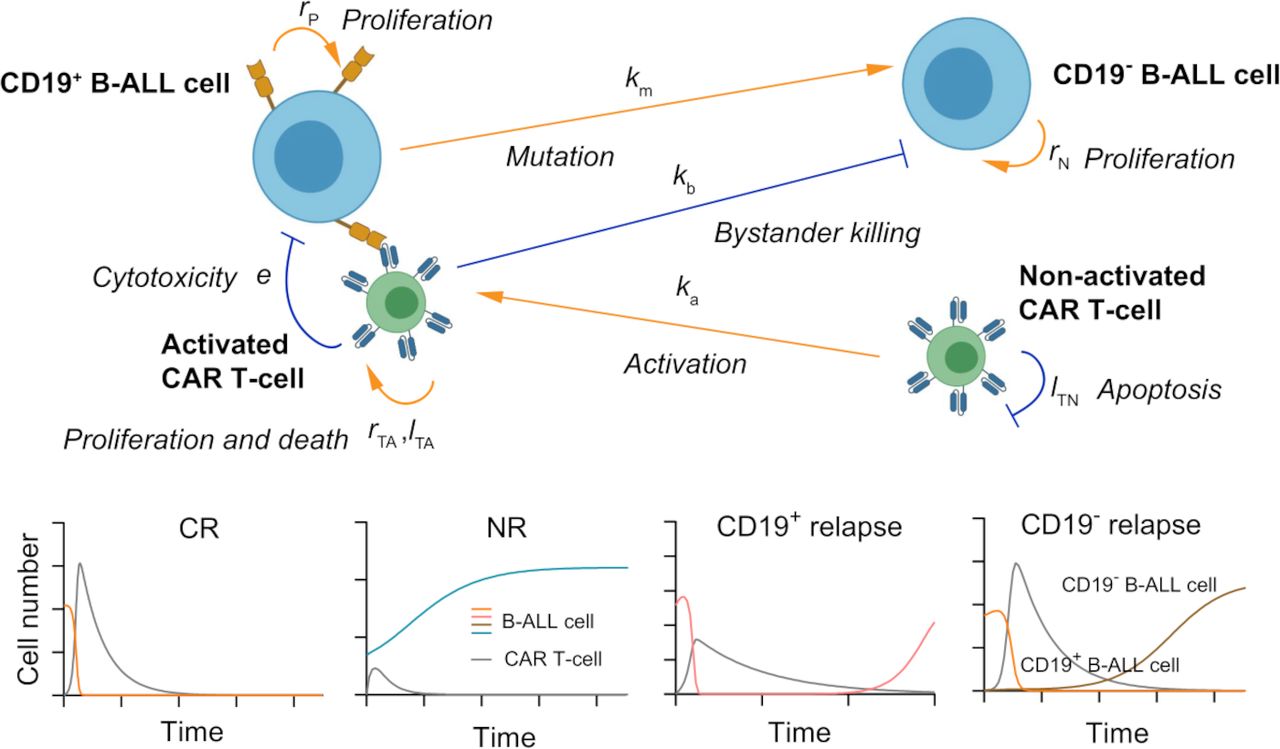
A schematic showing the key cellular components and their dynamic interactions in the computational CAR T-cell therapy model. Based on the computational model, four types of responses (bottom panel): CR, NR, CD19+ relapse, and CD19− relapse can be recapitulated with the outputs of dynamics of CAR T-cells and B-ALL cells. CAR, chimeric antigen receptor; B-ALL, B-cell acute lymphoblastic leukemia; CR, continuous remission; NR, non-response.
We first calibrated the proposed computational model with clinical data of CAR T-cell and tumor burden of 148 CR patients (online supplemental table S1 and figure S3), and simulated the dynamic behaviors of CAR T-cells and tumor cells during the treatment. After being activated by the CD19+ B-ALL cells, CAR T-cells rapidly expanded and peaked within the first 1–2 weeks, then gradually decreased after tumor cells were rapidly depleted. The results showed a strong correlation between clinical statistics and simulation data (figure 2A,B). We found that the peak value of CAR T-cells during treatment increased as initial tumor burden increased, which was consistent with clinical observation (figure 2C). This is largely because of the rapid in vivo CAR T-cell expansion stimulated by CD19+ tumor cells as verified through the real-time simulation results with increasing initial tumor burden (figure 2D). Similar correlation was observed between the peak value and activation rate of CAR T-cells (figure 2E). Moreover, the day when the CAR T-cells peaked correlated with the day when the patients achieved minimal residual disease (tumor burden <0.01%) (figure 2F).
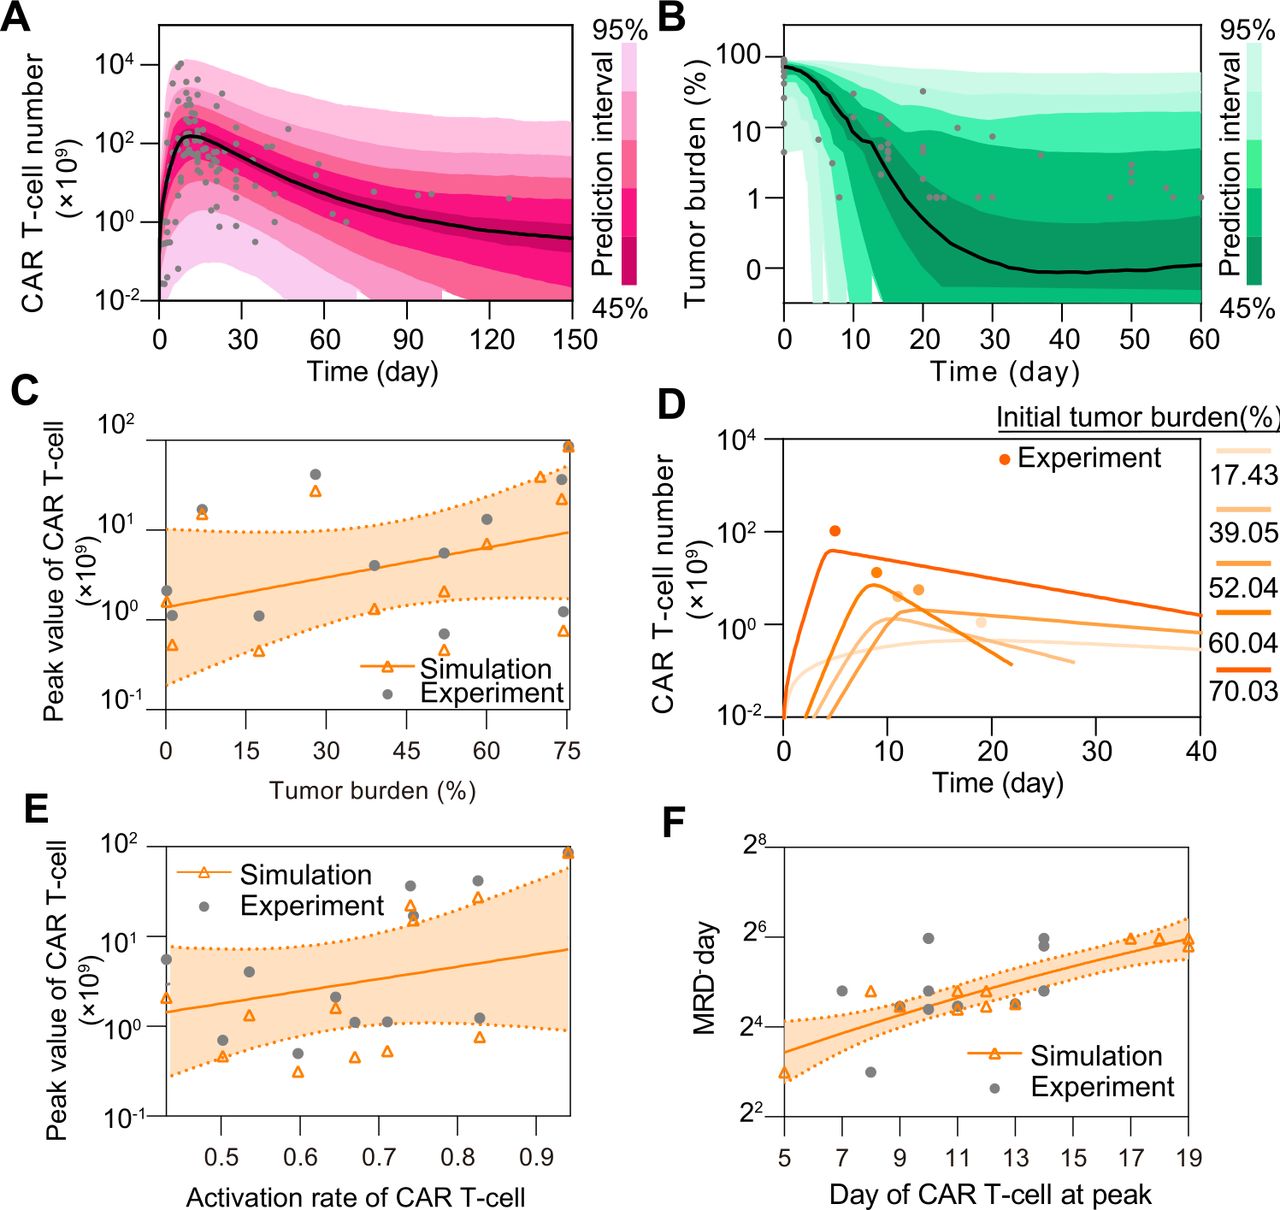
In silico analysis of CR in CAR T-cell therapy. (A, B) Calibration results of CAR T-cell (A) and tumor burden (B) of remission patients with median (solid line) and 95% prediction interval (color bands). The dots represent the experimental data. Prediction interval was automatically generated using the predefined algorithm of Monolix software during calibration. (C) Relationship between tumor burden and peak value of CAR T-cells and (D) corresponding real-time results. Simulation results of different patient groups were calculated and fitted with dashed lines, and compared with experimental results in (D). The band in (C) represents the 95% confidence interval (the same below). (E, F) Relationships between the activation rate and peak value of CAR T-cell (E), and day of CAR T-cell at peak and MRD− day (F). CAR, chimeric antigen receptor; CR, continuous remission; MRD, minimal residual disease.
In parallel, we calibrated the model with clinical data of 24 NR patients to model the scenario of NR, which again confirmed its validity (figure 3A,B, online supplemental figure S4 and table S2). For instance, significant differences were reproduced as observed in CR and NR patients in terms of CAR T-cell and tumor cell dynamics (figure 3C). In particular, the peak value and AUC28 (area under the curve from days 0 to 28, a common clinical marker to evaluate CAR T-cell expansion and function) of CAR T-cells in NR patients were less than those of CAR T-cells in CR patients at population level. Similar trends were further confirmed at individual level through experimental and simulation data (figure 3D,E). Notably, although the inherent heterogeneity in clinical patient groups led to several extreme values and caused the overlap between confidence intervals, the difference of the absolute magnitudes between the CR and NR groups was statistically significant. To further understand such differences, we conducted a sensitivity analysis of population level parameters and found that those related to CAR T-cell functionality, such as growth rate rTA, killing rate e, activation rate kA, and apoptosis rate lTA, critically influence CAR T-cell therapy outcomes (online supplemental figure S5). Our model indicated that the median values of these factors significantly differed between CR and NR patients (figure 3F–I). CAR T-cell in CR patients, but not those in NR patients, generally have higher growth rate rTA, killing rate e and activation rate kA but lower apoptosis rate lTA, suggesting an impaired CAR T-cell functionality in NR patients. These results together demonstrate the capability of our computational model to recapitulate the clinical dynamics during CAR T-cell therapy.
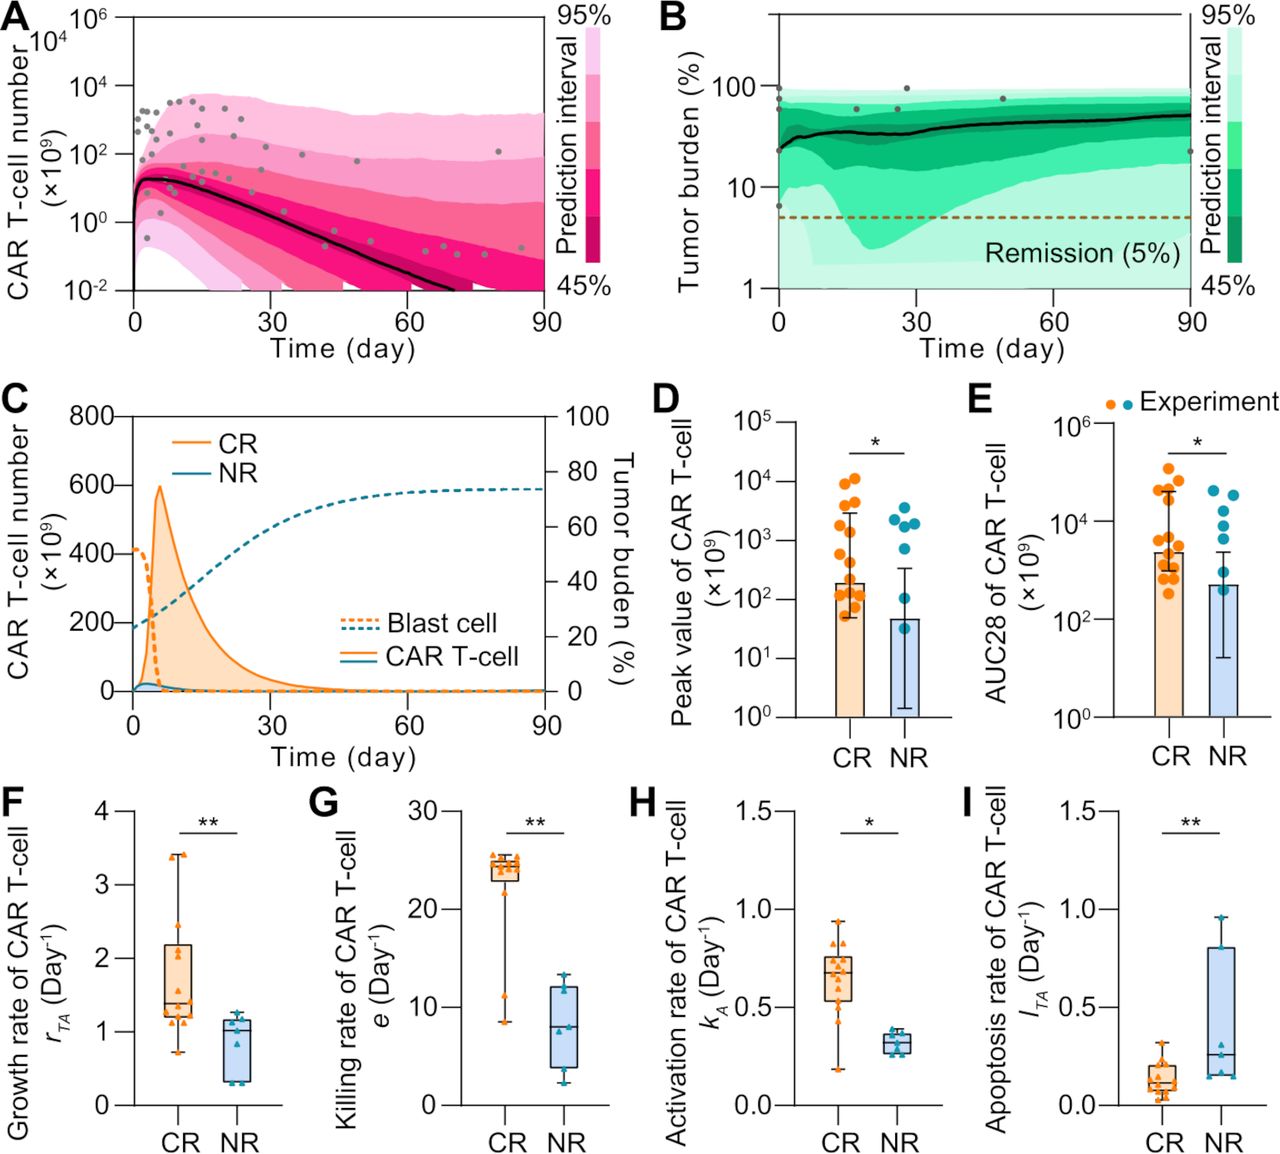
Comparative analysis of CR and NR patients in silico. (A, B) Calibration results of CAR T-cell (A) and tumor burdens (B) of NR patients with median (solid line) and 95% prediction interval (color bands). The dots represent the experimental data. (C) Variations of CAR T-cell and tumor burden of CR and NR patients. (D, E) Comparisons of the peak value (D) and AUC28 of CAR T-cell (E) between CR and NR patients. Bars represent simulated results and dots are experimental results. Error bars represent means with 95% confidence interval. (F–I) The median growth rate of CAR T-cells of CR patients is 1.38 per day, comparing with 1.02 per day of NR (F); the killing rate is 24.25 per day vs 8.03 per day (G); the activation rate is 0.70 day per day vs 0.32 per day (H); and the apoptosis rate is 0.12 per day vs 0.26 per day (I). Whiskers of boxplots represent min-max values. P values were calculated using Student’s t-test or Welch’s t-tests. *p<0.05, **p<0.01. CAR, chimeric antigen receptor; CR, continuous remission; NR, non-response; AUC28, area under the curve from day 0 to 28.
In silico modeling reveals distinct CAR T-cell patterns in CD19+ and CD19− relapse scenarios
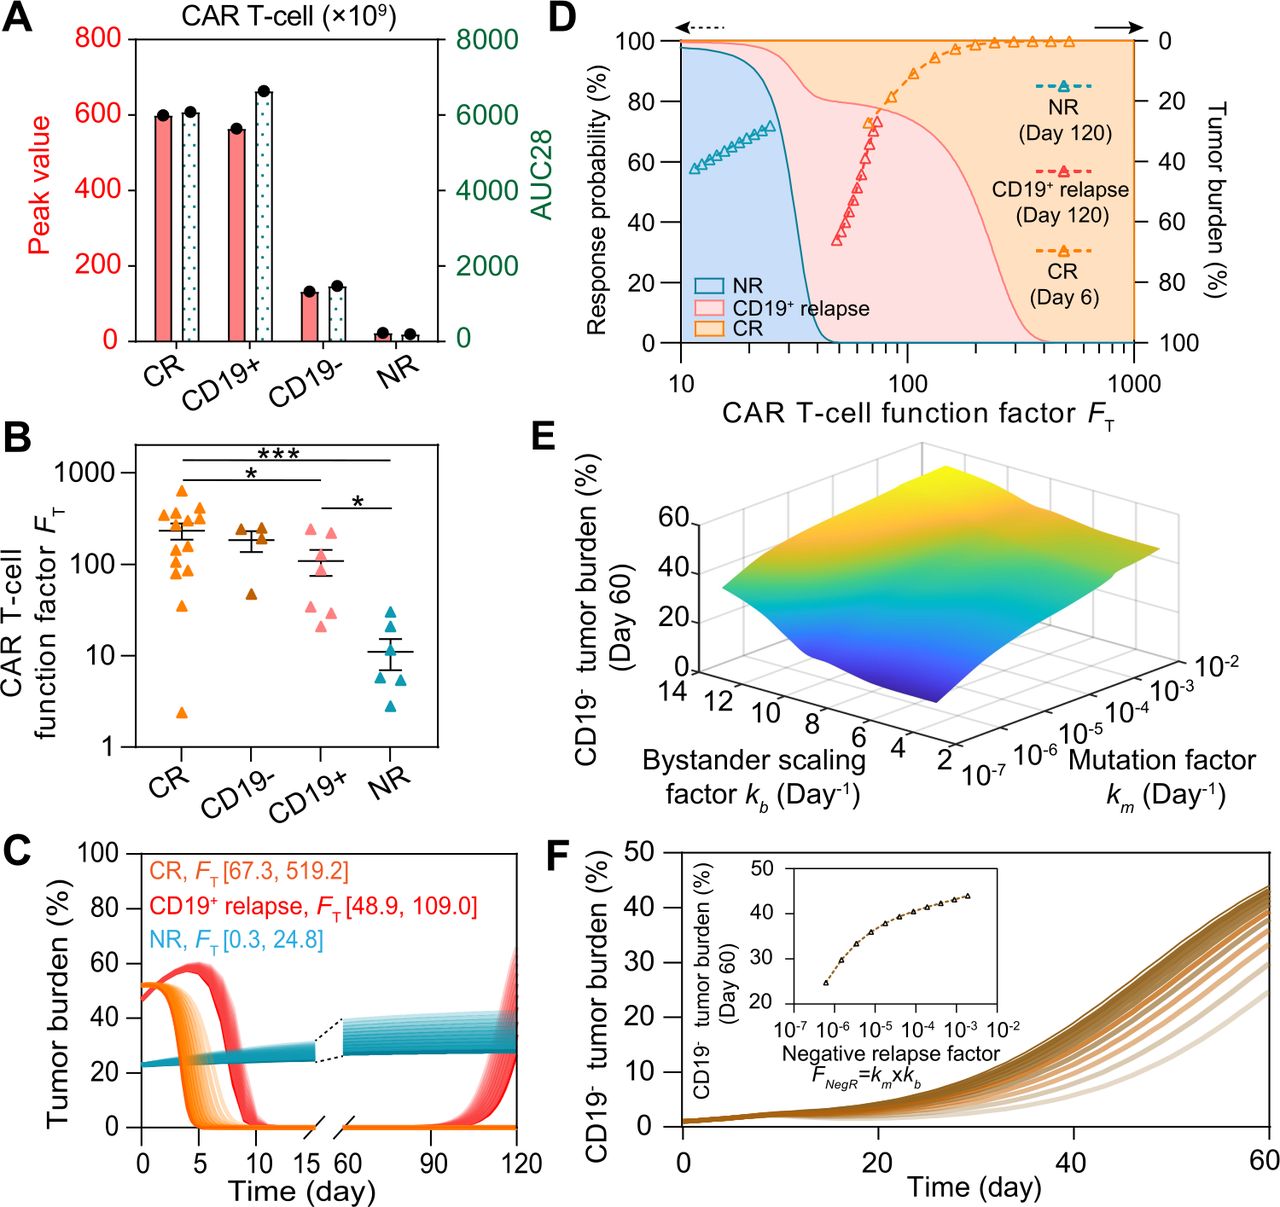
In addition to those achieving CR and showing NR, some patients showed either CD19+ or CD19− relapse after CAR treatment (6). To understand the heterogeneity between these two main relapse scenarios, we recalibrated the model with respective clinical data (figure 4A,B, online supplemental figures S6&S7A–C and tables S3&S4). As illustrated by the individual level-calibration results, our computational model successfully mimicked the relapse progress at different days of relapse (figure 4C,D). Furthermore, we found that correlation exists between the day of CD19+ relapse and AUC28 of CAR T-cell (online supplemental figure S7D), whereas this is not the case for CD19− relapse scenario (online supplemental S7E). To better explain this distinct pattern, we defined CAR T-cell function factor FT as follows:
 (5)
(5)
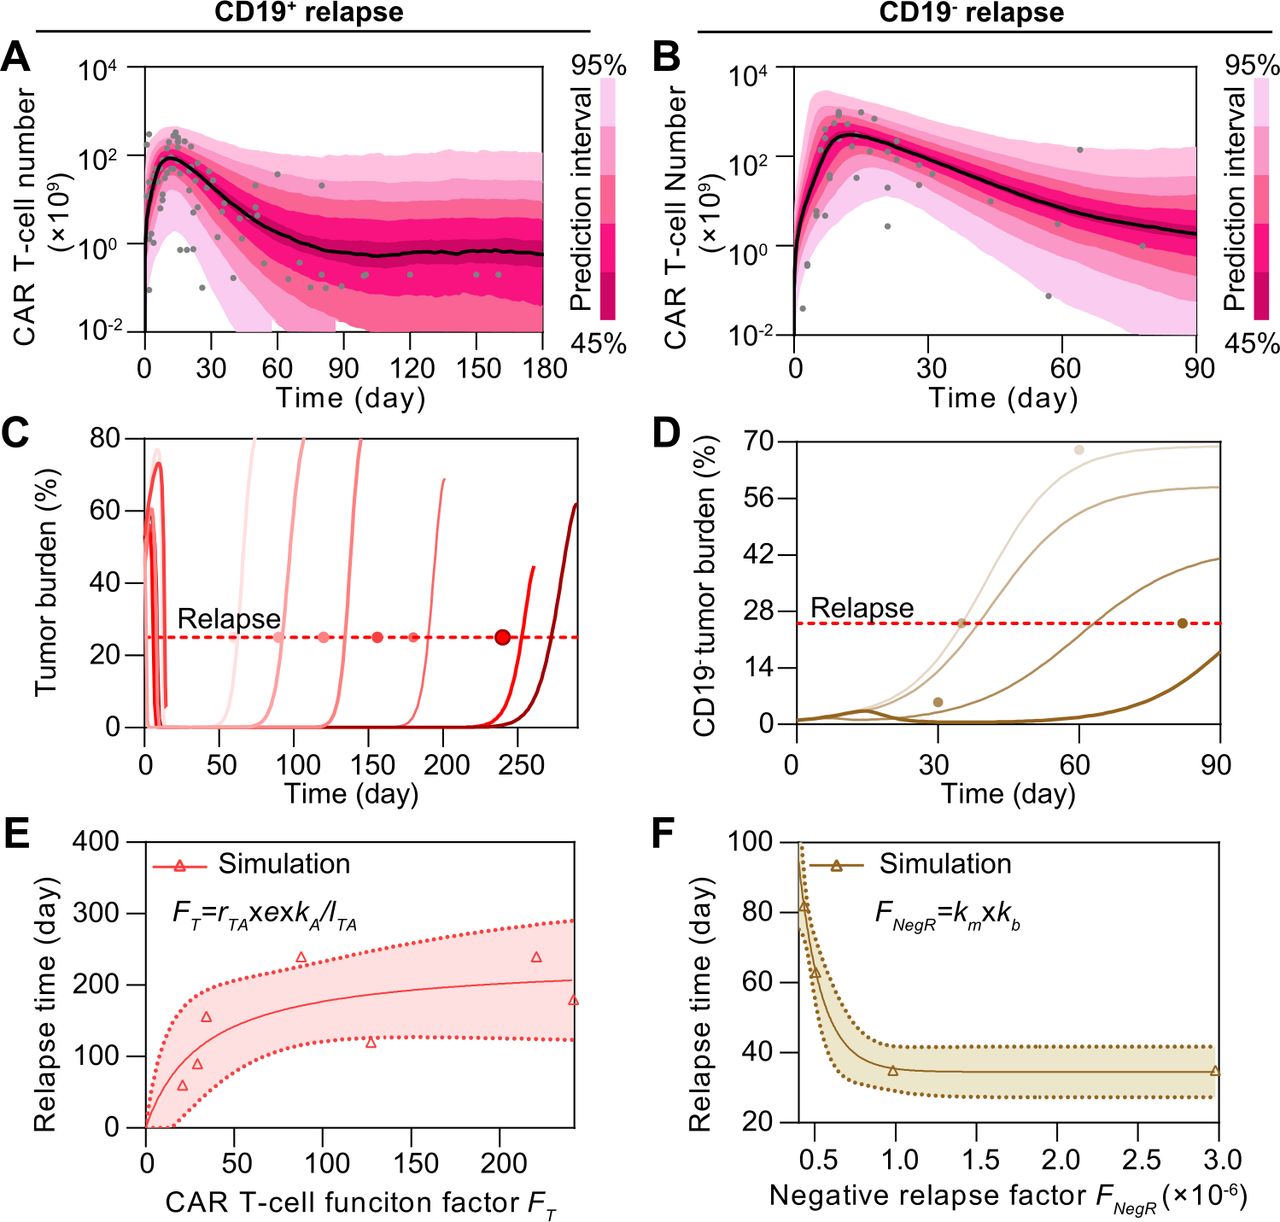
Comparative analysis of CD19+ and CD19− relapse to CAR T-cell therapy in silico. (A, B) Calibration results of CAR T-cells of CD19+ (A) and CD19− (B) relapse with median (solid line) and 95% prediction interval (color bands). (C, D) Individual fitting results of tumor burden of CD19+ (C) and CD19− (D) relapse. In (A–D), the dots represent the experimental data and the lines represent the fitted curves. (E) Variation of the day of CD19+ relapse as CAR T-cell function factor FT changes. (F) Variation of the day of CD19− relapse as negative relapse factor FNegR changes. The band in (E, F) represents the 95% confidence interval. CAR, chimeric antigen receptor.
to quantitatively describe the overall CAR T-cell functionality consisting of growth, cytotoxicity, and persistence where rTA is the growth rate, e is the killing rate, kA is the activated rate, and lTA is the apoptosis rate of CAR T-cell. These four parameters included in our differential equations model depict the four fundamental physiological processes of CAR T-cells. All showed abilities in differentiating response and NR groups (figure 3F–I) with high sensitivity to the model (online supplemental figure S5) and no single parameter could differentiate all four scenarios (online supplemental figure S8), making it reasonable to combine them and synergistically describe the functions of CAR T-cells among different responses. For clarity, all defined factors and prediction methods in the paper are summarized in online supplemental table S11. Simulation results demonstrated that the increase of FT extended the day of CD19+ relapse (figure 4E), but not that of CD19− relapse (online supplemental figure S7F). Such difference can be partially explained by the presence of CD19− B-ALL cells before infusion of CAR T-cells and the following selective pressure by CAR T-cells.5 In addition, the genetic mutation causing loss of surface expression of CD19 and the bystander killing of CAR T-cells may further determined the progression of CD19− B-ALL cells.21 22 To dissect the CD19− relapse scenario, we integrated these two key effects in our model and defined the negative relapse factor FNegR as follows:
 (6)
(6)
where km is the mutation factor considering the rate of gene mutation like alternative slicing with loss of exon 2 and the probability of lineage switch, and kb is the bystander killing scaling factor depicting the killing efficacy of CAR T to CD19− tumor cells comparing with to CD19+ tumor cells. Both parameters are positively related to the progression of CD19− relapse according to their definitions in equation 4. As a result, FNegR demonstrated a high correlation with the day of CD19− relapse, confirming its validity in depicting the mechanism of CD19− relapse (figure 4F). Collectively, our results reveal a distinct pattern of relapse across the CD19+ and CD19− scenarios.
Key determinants underlie heterogeneous responses to CAR T-cell therapy
To understand the key factors determining the heterogeneous responses to CAR T-cell therapy, we systematically and comparatively analyzed the clinical data, including the initial tumor burden and peak value of CAR T-cell in CR, NR, CD19+ relapse, and CD19− relapse patients after CAR T-cell therapy. No significant difference (p≥0.398) was observed in initial tumor burden among patients with different responses (online supplemental figure S9A), suggesting that using initial tumor burden alone cannot determine CAR T-cell response. Next, we calculated the peak value and AUC28 of CAR T-cells for the four types of responses at the population level and found that CR and CD19− relapse patients demonstrated higher values than did CD19+ relapse patients, whereas NR patients exhibited minimum values (figure 5A). We then tuned the values of the individual parameters (rTA, e, kA, and lTA) of CAR T-cell function factor FT in silico and found that, as expected, the FT parameter regulated the therapeutic effect of CAR T-cell treatment (online supplemental figure S9B,C). These results collectively indicated the potential of FT in differentiating these outcomes, such as CR, CD19+ relapse and NR after CAR T-cell therapy, although this was not the case for CD19− relapse (figure 5B). Furthermore, we scaled the population-level calibrated parameters in FT of different responses (±25% for CR, ±10% for CD19+ relapse, and ±5% for NR), which again confirmed the usefulness of FT (figure 5C). Based on the clinical response and the distribution of FT of patients (figure 5B), the probability distribution of FT of different responses were fitted with the MATLAB Distribution Fitter Toolbox (online supplemental figure S9D). According to the probability distribution, the occurrence probabilities of CR, CD19+ relapse, and NR at certain FT, that is, Pi (FT) can be determined as follows:
 (7)
(7)

Key determinants in regulating CAR T-cell therapy response. (A) Comparisons of the peak value and AUC28 of CAR T-cells, and (B) CAR T-cell function factors FT across patients of different responses. Error bars in B represent mean±SE of mean (SEM). (C) Variations of tumor burden as FT changes. (D) Variation of the response probability as FT changes (left y-axis) and tumor burden under FT in (C) (right y-axis). For a specific FT, the response probabilities of different responses are represented by different colors (blue for NR, red for CD19+ relapse, and orange for CR) on the direction of y-axis; the sum of the response probabilities is 100%. As FT changes, areas with different colors are generated. (E) Variations of CD19− tumor burden as the bystander scaling factor kb and mutation factor km change. (F) Variations of CD19− tumor burden as the negative relapse factor FNegR changes. P values were calculated using Welch’s t-test. *p<0.05, ***p<0.001. CAR, chimeric antigen receptor; CR, continuous remission; NR, non-response; AUC28: area under the curve from days 0 to 28.
where p is the probability distribution of different responses (online supplemental figure S9C). We found that as FT increased, the most likely response to CAR T-cell therapy changed from NR to CD19+ relapse, and further to CR (figure 5D). In addition, the distribution of scaled FT (figure 5C) fell into the range of corresponding response (figure 5D). Similarly, as FT cannot determine the characteristics of CD19− relapse, we found instead that FNegR determined the efficacy of CAR T-cell therapy in the scenario of CD19− relapse (figure 5E) and in silico experiments of changing FNegR (by scaling km and kb) confirmed such observation (figure 5F). Collectively, our model helped to identify critical determinants underlie heterogeneous responses to CAR T-cell therapy.
In silico prediction of late response at early stage of CAR T-cell treatment
Prediction of the late response of patients to CAR T-cell therapy during early treatment stage will greatly improve patient outcomes by guiding the treatment regimen that follows, especially for patients with acute disease progression.36–38 Having demonstrated that our computational model accurately recapitulated the cellular dynamics of CAR T-cell therapy, we found that the response can be differentiated by the actual function level and dynamics of CAR T-cells in individual patients. Thus, we hypothesized that such responses can be predicted using our computational immuno-oncology model with input of clinically measurable and available patient information related to CAR T-cell dynamics, such as the peak value and AUC7 (area under the curve from days 0 to 7) of CAR T-cells, at the early stage of CAR T-cell treatment.
We first mapped the real-time results of the four typical patient groups with different responses (figure 6A). Unexpectedly, neither the peak value nor the AUC7 index alone demonstrated statistical differences among different groups, implicating that a single parameter is not proficient for clinical prediction (online supplemental figure S10). Thus, we considered combining these two indices and defined the prediction factor FP as follows:
 (8)
(8)
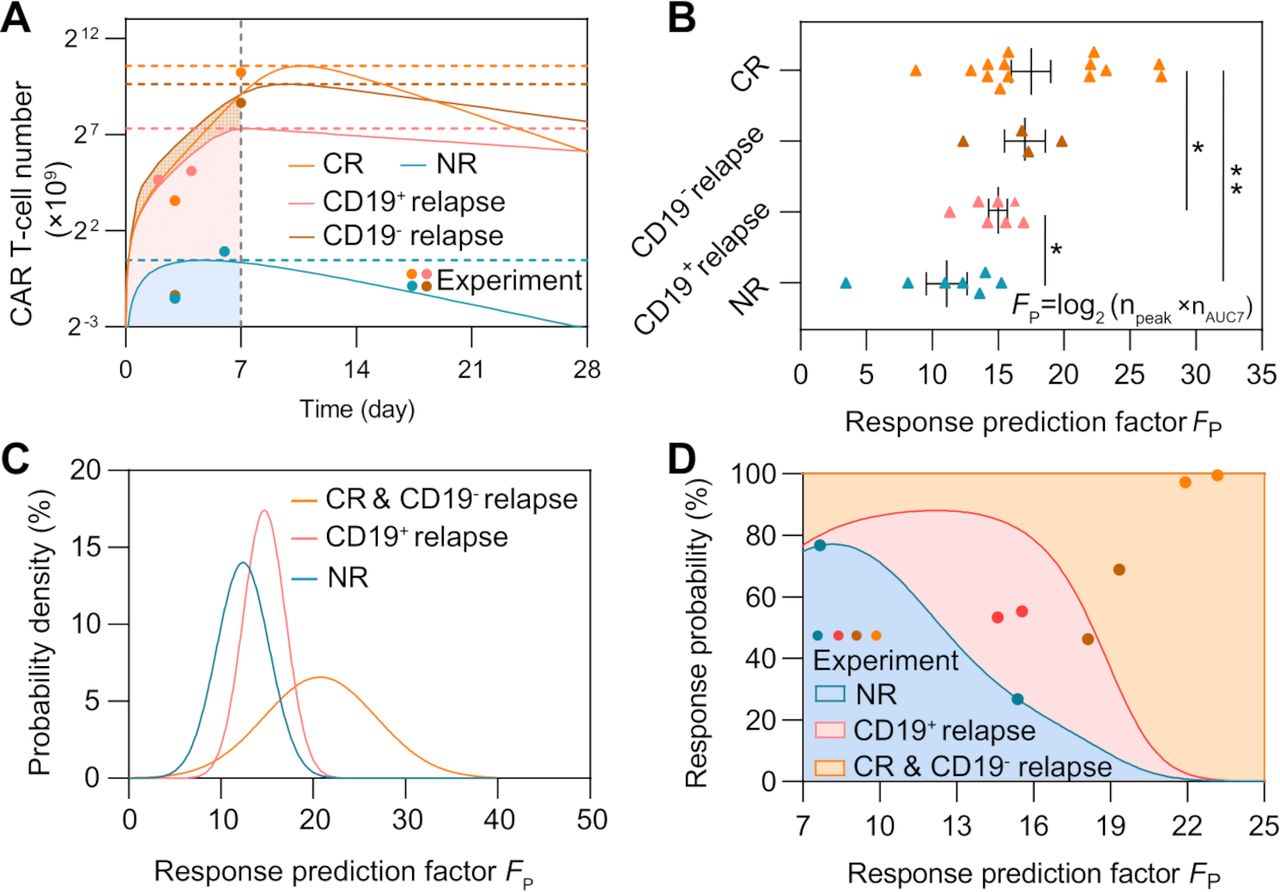
Prediction of CAR T-cell therapy response based on the peak value and AUC7 of CAR T-cells. (A) Variations of CAR T-cell number of typical patient groups with different responses (group 8 of CR, group 1 of CD19− relapse, group 7 of CD19+ relapse, and group 1 of NR). (B) Comparisons of the response prediction factor FP. Error bars represent mean±SEM. (C) Probability density of different responses as FP changes. (D) Variations of response probability as FP changes. For a specific FT, the response probabilities of different responses are represented by different colors (blue for NR, red for CD19+ relapse, and orange for CR&CD19− relapse) on the direction of y-axis; the sum of the response probabilities is 100%. As FT changes, areas with different colors are generated. The blue, red, brown, and orange dots represent experimental results of NR, CD19+ relapse, CD19− relapse and CR patients, respectively, to validate prediction ability. P values were calculated using Student’s t-est or Welch’s t-test. *p<0.05, **p<0.01. CAR, chimeric antigen receptor; CR, continuous remission; NR, non-response; AUC7: area under the curve from days 0 to 7.
where npeak is the peak value of CAR T-cell and nAUC7 is its AUC7 value. For different responses, we calculated FP based on calibrated results of individual patients and found that FP showed statistical significance across the CR, NR, and CD19+ relapse groups (figure 6B). The results showed that early-stage CAR T-cell dynamics of CR and CD19− relapse within the first month were similar in terms of the peak value, AUC7 of CAR T-cells, and FP comparing with NR and CD19+ relapse. Considering the similarity of CAR T-cell dynamics at the early stage between CR and CD19− relapse, these two response groups were combined at this stage of the prediction and referred to as the CR&CD19− relapse response.
To further validate the prediction ability of FP, for CR&CD19− relapse, we selected seven patients to calibrate the relationship between FP and the response, and four (two CR and two CD19− relapse) for prediction; for NR and CD19+ relapse, we selected five patients for calibration and two for prediction. The probability distributions of FP of different responses were fitted using the MATLAB Distribution Fitter Toolbox (figure 6C). Based on the probability distribution, the occurrence probabilities of each response at certain FP, that is, Pi (FP) was be determined as follows:
 (9)
(9)
where p is the probability distribution of different responses. We found that as FP increased, the most likely response to CAR T-cell therapy changed from NR to CD19+ relapse, and then to CR&CD19− relapse (figure 6D). The FP of each patient was calculated for prediction and the corresponding probabilities of different responses can be determined (figure 6D). The FP of the two NR patients was 15.4 and 7.7 and the predicted probabilities of NR were 26.7% and 76.7%; the FP of the two CD19+ relapse patients was 14.6 and 15.5 and the predicted probabilities of CD19+ relapse were 53.3% and 55.3%; the FP of the two CD19− relapse patients was 18.1 and 19.3 and the predicted probabilities of CR&CD19− relapse were 46.3% and 68.9%; and the FP of the two CR patients was 21.9 and 23.2 and the predicted probabilities of CR&CD19− relapse were 97.2% and 99.5%.
Because FP prediction depended on the peak value of CAR T-cells, which requires clinical monitoring of patients up to 2 weeks, we aimed to predict patient outcomes with only input of the first 7-day clinical data of CAR T-cell dynamics and the initial tumor burden of a patient. We then calibrated the computational model based on the early-stage CAR T-cell dynamics (equations 1–3) and obtained the subsequent time-series results of CAR T-cell and tumor cells (figure 7A–C). To validate the feasibility of the proposed method, we first tested one representative patient for different response group and found that the responses of clinical patient cohort can be correctly predicted (figure 7A–C).

Prediction of patient responses to CAR T-cell therapy based on the CAR T-cell dynamics within first 7 days of treatment. (A–C) Prediction results based on clinical of CR (A), CD19+ relapse (B), and NR (C) of clinical patients. The minor graph in B shows CAR T-cell dynamics observed and predicted in the first 7 days in a smaller y-axis scale for better display. (D) Median peak value and (E) AUC28 of CAR T-cells of virtual cohort patients and comparisons with clinical cohort patient data. (F) CAR T-cell function factors of virtual patients and comparisons with clinical data. No significant differences between virtual and clinical patients of the same response, and between CR and CD19− relapse patients were observed. Whiskers of boxplots represent min-max value. (G–I) Real-time prediction results based on virtual patient cohorts. The prediction method was used for the CR (G), CD19+ relapse (H), and NR (I) of CAR T-cell therapy, as observed. (J) Overall prediction accuracy (74.38%). (K) Prediction accuracy of different responses: 65.63% for CR and CD19- relapse, 75.50% for CD19+ relapse, and 90.75% for NR. (L) Threshold values of initial CD19− tumor burden to induce CD19− relapse. Dotted lines indicate the values of initial CD19− tumor burden with the occurrence probability (25, 50, and 75%) of CD19− relapse obtained from population level statistics. P-values were calculated using Student’s t-test or Welch’s t-test. ***p<0.001. CAR, chimeric antigen receptor; CR, continuous remission; NR, non-response; AUC28: area under the curve from days 0 to 28.
To test the accuracy of our prediction method on a larger scale with higher reliability, we generated clinical-derived virtual patient cohorts for a clinical trial simulation to complement the present clinical data which is of small quantity and density. In general, 400 sets of virtual patient data points for CR, CD19− relapse, CD19+ relapse, and NR cohorts were generated separately (online supplemental tables S7–10), based on Gaussian distribution of the population level parameters calibrated from present clinical patient cohort data (online supplemental table S5). To validate the applicability of those virtual patient cohorts, we first compared the peak values (figure 7D) and AUC28 (figure 7E) of CAR T-cells between virtual and clinical patient cohorts of different responses (figure 5A). The results showed good consistency in both absolute and relative values, indicating the quantity and quality of virtual patient cohorts matched those of the clinical patients. We further calculated FT of virtual patient cohorts and found no significant differences between clinical patient cohorts and virtual patient cohorts (figure 7F), again confirming the usability of virtual patient cohorts. As a result, our clinical trial simulation with virtual patient cohorts successfully reproduced real-time results of corresponding clinical patient cohorts and predicted patient responses (figure 7G–I, online supplemental figure S11–14). Overall, our prediction method reached a prediction accuracy of 74.38% for a total of 1600 virtual patients with respective prediction accuracy of 65.63% (525/800) for CR&CD19− relapse, 75.50% (302/400) for CD19+ relapse, and 90.75% (363/400) for NR (figure 7J,K). For CR and CD19− relapse, CAR T-cell dynamics at early stage are similar; thus, their responses were combined as CR&CD19− relapse (figure 7A, online supplemental figure S15). The high prediction accuracy of NR can be partially explained by the lower differences between the predicted and observed values of FT and ΔFT (online supplemental figure S16).
To better understand the effect of clinical observation endpoint on the accuracy of our prediction method, we further generated the receiver operator characteristics (ROC) of different responses at various clinical timepoints (online supplemental methods and tables S12–14). The analysis suggested that as clinical observation extended, the sensitivity of prediction for CR&CD19− relapse decreased slightly and specificity increased, whereas the opposite occurred for CD19+ relapse. For NR, the prediction results were stable as the clinical endpoint increased. Unlike CD19+ relapse, CR&CD19− relapse, and CR that had a similar early response, the unique dynamics of NR led to steady sensitivity and specificity in ROC.
To further differentiating CR and CD19− relapse patients in the group of CR&CD19− relapse response, we selected the initial CD19− tumor burden nN0 as an index to predict the occurrence of CD19− relapse (equation 4). Parameters designated to the model were based on the calibration of CR and CD19− relapse response combining with parameters related to CD19− relapse (online supplemental table S5). Based on the model including equation of CD19− relapse, the response varies from CR to CD19− relapse by increasing the initial CD19− tumor burden; therefore, its threshold value nN0T of each individual and population-level results with certain occurrence probabilities to induce CD19− relapse could be determined (figure 7L, online supplemental figure S17). These results together confirm the prediction power of our computational CAR T-cell immuno-oncology model, which can provide guidance for clinical treatment and regimen.
Discussion
Computational models of immunotherapy provide a valuable tool for in silico clinical modeling and patient stratification.7 8 In this study, we constructed a mathematical model of the critical leukemia-immune interactions with clinical dataset, determined key factors effecting treatment efficacy, and predicted patient response to CAR T-cell therapy with early-stage CAR T-cell dynamics data. We systematically explored dynamic interactions between B-ALL and CAR T-cells and found that CAR T-cell function index FT inferred patient outcomes ranging from CR, NR, to CD19+ relapse. Contrastingly, a negative relapse index FNegR, including the mutation rate and the bystander killing rate to CD19− B-ALL cells, determined the probability and day of relapse for CD19− relapse cases. Through the application of our computational model, we were able to define the prediction factor FP using early-stage CAR T-cell expansion data including the peak and AUC7 values of adoptively transferred CAR T-cells. By introducing FT and FNegR, our model realized to systematically characterize heterogeneous responses and dissect underlying mechanisms, positioning it as a clinically relevant, translationally innovative tool that impacts decision making. With our modeling approach, we were able to effectively predict CAR T-cell treatment outcomes for individual patients.
Most other data evaluation models rely on end-point data, often coinciding with, or even after, clinical outcomes. Importantly, our model predicted prognosis at early time points following infusion. Most current methods rely on the detection of certain prognostic biomarkers, for example, inducible COStimulator, CD27+PD-1–CD8+T cell population, lactate dehydrogenase, and C reactive protein.37 39–41 However, current biomarkers fail to accurately predict the prognosis of patients who underwent CAR T-cell therapy before clinical endpoints are reached. With input of quantitative data available at early stage of treatment like the initial tumor burden, the peak value and first 7-day data of CAR T-cell, our prediction method provides insight into the actual bioactivity and functional competence of CAR T-cells soon after infusion. All these quantities used in our prediction method can be obtained from clinical practice by reliably measure sampling the bone marrow tissue and blood of patients, positioning it as a clinically relevant, translationally innovative tool that impacts decision making. Identifying contexts where CAR T-cells are performing suboptimally may permit personalized treatment and management, that is, inclusion of targeted biologics or checkpoint inhibitors to limit disease progression and amplify the overall immune response accordingly. In addition, because the model profiles the whole dynamics of disease progression like the date of reaching peak tumor burden, the estimated timetable will assist clinicians to design and adjust their treatment regimens accordingly. Based on the predicted long-term CAR T-cell dynamics, tumor burden progression and treatment outcome, for patients with inferior responses (NR or relapse), further treatment such as allogeneic hematopoietic stem cell transplantation therapy,42 or a second-dose CAR T-cell infusion43 can be considered and prepared in advance for the relapse or refractory patients after the first CAR T-cell therapy.
As our computational immune-oncology model involves multiple parameters in several ordinary differential equations to synthetically depicts the fundamental physiological processes during CAR T-cell therapy, a proper parameter estimation based on measured clinical data is an important step toward building up an accurate and reliable prediction model. In study, we conducted parameter estimation using standard NLME which is a particularly useful approach in settings where there are multiple parameter measurements involved. This parameter estimation took consideration of both systematic and random effects, ensuring repeatability and consistency of the fitting results and thus reliability and reproductivity of the model. A larger dataset and more reasonable range of parameter supported by clinical literatures will further improve the credibility of parameter estimation.
The accuracy and reliability of the prognostic model highly depend on the quantity and quality of clinical data to establish and calibrate it. Computational models usually adopt clinical data from different literatures acquired by different measuring methods (eg flow cytometry, qPCR, and morphological testing) of different biopsies took from different tissue samples (for example, saliva, peripheral blood, and bone marrow). These datasets are associated with large variance, making it difficult for model fitting using a single set of parameters that would work for all patients under different treatment conditions. Thus, unifying the data from different sources and formats before fitting in silico models is particularly important. Accordingly, we built up a unifying code to interpret the relationship between clinical data with different units coming from different body parts with assumptions13 and data.23 This unifying process of clinical data highlights a novel way to accurately recapitulate the patient/clinical process, which previous strategies are limited to offer. Moreover, the current model tried to fully use clinical data obtained from different trials with a uniform and reasonable standard, but it can be improved with more considerations of interpatient variability. For example, lymphodepletion pretreatment seems to affect CAR T-cell expansion44 and second-generation CAR T-cell products with CD28 or 4-1BB costimulatory domains exhibit differences in magnitude and persistence,45 although both showed well treatment efficacy to B-ALL. Future extension of the computational model including these factors will develop its potential in exploring new insights.
Critically, limited availability of clinical data prevents large-scale validation of computational models including ours. We, therefore, conducted clinical trial simulation studies expanding the patient cohorts from 209 to 1600 individuals. The generation of virtual patient cohorts was based on calibration results of clinical patient cohorts, and the similarity of these two cohorts was carefully confirmed, both ensuring the credibility of clinical trial simulations. The proposed methods to unify and expand clinical data have been proven to be practical and feasible, but it has to be admitted that original clinical data with large amount and uniformed standard are optimal,46 necessitating collaboration with clinicians on designing the scheme of data collection before the start of clinical trials for a better validation and translation of the model.
Relapse scenarios, which were less discussed in current computational models, were included in our model. Our simulation results demonstrated a prediction of the prognosis of CD19+ relapse based on early-stage CAR T-cell dynamics data, but not that of CD19− relapse. The clinical responses of CD19− relapse patients were found very similar to CR patients at the early stage of CAR T-cell treatment. In our model, the index of initial CD19− tumor burden demonstrated a good potential in predicting CD19− relapse. However, such index of CD19− tumor burden is not currently measured clinically, which if available could provide more sufficient information to calibrate our model for real-world clinical prediction. In addition, CD19− relapse-related clinical data of larger quantity and more types for different responses will enable a global model unifying all four responses together and contribute to a deeper insight into distinct responses and a better accuracy of prediction. Although it is clear that presence of CD19− tumor cell population caused the CD19− relapse47 and our model identified the potential threshold of the CD19− cell population for CD19− relapse, the mechanisms causing the loss of surface expression of CD19 remain poorly understood. Thus, more insightful studies about the mechanism of CD19− relapse will also enable us to include more factors in the model with improved knowledge to achieve a better description and prediction of CD19− relapse. At the present stage, the prediction of relapse of the model is mainly qualitative, providing the clinicians with a dichotomous answer. In the future, by introducing more kinds of clinical data and improving the structure of the model, an enhanced model capable of quantitively predicting the date of relapse is promising.
In addition to the direct interactions between CAR T-cell and B-ALL cell, microenvironmental cues, for example, immune cells like myeloid-derived suppressor cells, regulatory T-cells and tumor-associated macrophages, and their secreted immunosuppressive cytokines in the bone marrow, may explain the distinct functionalities of CAR T-cell for patients with different response rates.48 As demonstrated by our recent studies,49 an in silico model of the heterogeneous tumor microenvironments would be particularly valuable for dissecting and screening of immunotherapies. Incorporation of these immune cell components into our computational immuno-oncology model may help dissecting out these immunological mechanics involved in the tumor microenvironment affecting treatment outcomes, although it is currently impractical owing to highly limited clinical data. Computational models were also applied to study cytokine release syndrome (CRS), an adverse side effect elicited by CAR T-cell therapy.50 51 However, most of existing CRS models lack clinical data and failed to dissect actual cellular factors affecting the severity of CRS and corresponding treatments. We believe that modeling of cytokines with our computational CAR T-cell therapy model would help to determine the biological mechanisms and the risk to develop severer CRS and their potential relationships with the varied therapeutic outcomes.
In conclusion, we have established a computational immuno-oncology model of CAR T-cell therapy by recapitulating key cellular dynamics observed in clinical trials, revealed key determinants of treatment efficacy, and predicted patient outcomes with early-stage clinical data. We believe that this patient-based computational platform can serve as precision medicine tool to aid clinicians with quantitative and reliable prognosis in early-stage of CAR T-cell therapy, thus contributing to personized treatment of leukemia patients with optimized clinical outcomes.
Data availability statement
All data relevant to the study are included in the article or uploaded as online supplemental information. The code and data for the computational model are available on Github (https://github.com/Lunan12/CAR-T-model).
Ethics statements
Patient consent for publication
References
Supplementary materials
Supplementary Data
This web only file has been produced by the BMJ Publishing Group from an electronic file supplied by the author(s) and has not been edited for content.
Footnotes
Twitter @SabaGhassemi
LL and CM contributed equally.
Contributors LL, CM and WC designed the study. WC, IA and SG supervised the study. LL and ZZ constructed the computational model and performed experiments. LL, ZZ and CM analyzed the data. LL, ZZ, CM, MTW, SG, and WC wrote the manuscript. WC is responsible for the overall content as guarantor.
Funding This work was supported by the National Science Foundation (CBET 2103219 to WC), the US National Institutes of Health (R35GM133646 to WC; R01CA216421, R01CA173636, R01CA228135, P01CA229086, R01CA242020 to IA). IA was also supported by the EvansMDS Foundation, AstraZeneca and the Leukemia and Lymphoma Society. CM was supported by the Cancer Research Institute Irvington Postdoctoral Fellowship (CRI4018). ZZ was supported by the New York University Tandon School of Engineering Dean’s PhD Fellowship. MTW was a Fellow of The Leukemia & Lymphoma Society.
Competing interests None declared.
Provenance and peer review Not commissioned; externally peer reviewed.
Supplemental material This content has been supplied by the author(s). It has not been vetted by BMJ Publishing Group Limited (BMJ) and may not have been peer-reviewed. Any opinions or recommendations discussed are solely those of the author(s) and are not endorsed by BMJ. BMJ disclaims all liability and responsibility arising from any reliance placed on the content. Where the content includes any translated material, BMJ does not warrant the accuracy and reliability of the translations (including but not limited to local regulations, clinical guidelines, terminology, drug names and drug dosages), and is not responsible for any error and/or omissions arising from translation and adaptation or otherwise.