Article Text

Abstract
Background Despite PD-L1 (Programmed death receptor ligand-1) expression on tumor cells and cytotoxic T lymphocytes tumor infiltration in the tumor microenvironment, human pancreatic cancer stands out as one of the human cancers that does not respond to immune checkpoint inhibitor (ICI) immunotherapy. Epigenome dysregulation has emerged as a major mechanism in T cell exhaustion and non-response to ICI immunotherapy, we, therefore, aimed at testing the hypothesis that an epigenetic mechanism compensates PD-L1 function to render pancreatic cancer non-response to ICI immunotherapy.
Methods Two orthotopic pancreatic tumor mouse models were used for chromatin immunoprecipitation-Seq and RNA-Seq to identify genome-wide dysregulation of H3K4me3 and gene expression. Human pancreatic tumor and serum were analyzed for osteopontin (OPN) protein level and for correlation with patient prognosis. OPN and PD-L1 cellular location were determined in the tumors using flow cytometry. The function of WDR5-H3K4me3 axis in OPN expression were determined by Western blotting. The function of H3K4me3-OPN axis in pancreatic cancer immune escape and response to ICI immunotherapy was determined in an orthotopic pancreatic tumor mouse model.
Results Mouse pancreatic tumors have a genome-wide increase in H3K4me3 deposition as compared with normal pancreas. OPN and its receptor CD44 were identified being upregulated in pancreatic tumors by their promoter H3K4me3 deposition. OPN protein is increased in both tumor cells and tumor-infiltrating immune cells in human pancreatic carcinoma and is inversely correlated with pancreatic cancer patient survival. OPN is primarily expressed in tumor cells and monocytic myeloid-derived suppressor cells (M-MDSCs), whereas PD-L1 is expressed in tumor cells, M-MDSCs, polymorphonuclear MDSCs and tumor-associated macrophages. WDR5 is essential for H3K4me3-specific histone methyltransferase activity that regulates OPN expression in tumor cells and MDSCs. Inhibition of WDR5 significantly decreased OPN protein level. Inhibition of WDR5 or knocking out of OPN suppressed orthotopic mouse pancreatic tumor growth. Inhibition of WDR5 also significantly increased efficacy of anti-PD-1 immunotherapy in suppression of mouse pancreatic tumor growth in vivo.
Conclusions OPN compensates PD-L1 function to promote pancreatic cancer immune escape. Pharmacological inhibition of the WDR5-H3K4me3 epigenetic axis is effective in suppressing pancreatic tumor immune escape and in improving efficacy of anti-PD-1 immunotherapy in pancreatic cancer.
- immune evation
- immunotherapy
- myeloid-derived suppressor cells
- tumor escape
Data availability statement
Data are available in a public, open access repository. NA.
This is an open access article distributed in accordance with the Creative Commons Attribution Non Commercial (CC BY-NC 4.0) license, which permits others to distribute, remix, adapt, build upon this work non-commercially, and license their derivative works on different terms, provided the original work is properly cited, appropriate credit is given, any changes made indicated, and the use is non-commercial. See http://creativecommons.org/licenses/by-nc/4.0/.
Statistics from Altmetric.com
Background
Immune checkpoint inhibitor (ICI) immunotherapy has made breakthroughs in many human cancers.1 However, pancreatic cancer is refractory to ICI immunotherapy.2–4 Only patients with the mismatch repair deficiency pancreatic cancer, which account for about 0.8% of all human pancreatic cancer cases, have an objective response to ICI immunotherapy.5–7 The lack of response of human pancreatic cancer to ICI immunotherapy has been linked to the low tumor mutation burden (TMB). Human pancreatic tumor has a median mutational load of 4, much lower than the more immunogenic melanoma and lung cancer.8 However, despite the low TMB, human pancreatic carcinoma has a low to moderate level of cytotoxic T lymphocyte (CTL) tumor infiltration,9–11 suggesting that the CTL tumor infiltration level may not be a major mechanism underlying pancreatic cancer non-response to ICI immunotherapy. It is possible that functional suppression of the tumor-infiltrating CTLs in the pancreatic tumor microenvironment may underlies pancreatic cancer non-response to ICI immunotherapy,10 12–14 which raises the possibility that other immune checkpoints and/or immune suppressive mechanisms compensate PD-L1 function to render pancreatic cancer non-response to ICI immunotherapy,15–17 which remains to be determined.
In the tumor microenvironment, T cells become dysfunctional and eventually acquire an exhaustion phenotype usually through regulation by exhaustion-specific epigenetic enhancers.18 A largely underappreciated mechanism that may also contribute to tumor immune escape and non-response to ICI immunotherapy in pancreatic cancer is the dysregulation of epigenome in the tumor cells.19–21 H3K4me3 is known to regulate pancreatic cancer immune suppression and response to therapy.14 22 23 We aimed at testing the hypothesis that H3K4me3 regulates pancreatic carcinoma epigenome dysfunction to render pancreatic cancer non-response to ICI immunotherapy and performed genome-wide H3K4me3 chromatin immunoprecipitation (ChIP)-Seq of orthotopic pancreatic mouse tumor. To this end, we determined that H3K4me3 deposition is highly enriched through pancreatic tumor genome and identified Spp1, the gene that encodes osteopontin (OPN) protein, and its receptors as the targets of H3K4me3 in promotion of pancreatic cancer immune escape and non-response to anti-PD-1 immunotherapy.
Methods
Human pancreatic cancer patient specimens
The non-neoplastic human pancreas and human pancreatic tumor tissues were obtained from the Cooperative Human Tissue Network Southern Division (University of Alabama at Birmingham, AL) (online supplemental tables 1 and 2). Serum specimens of healthy donors and human pancreatic cancer patients were provided by Georgia Cancer Center Biorepository.
Supplemental material
Patient dataset analysis
OPN mRNA datasets of non-neoplastic human pancreas and human pancreatic tumor were extracted from TCGA database. For determination of patient survival time correlation with OPN expression level, TCGA pancreatic cancer patient survival and OPN expression datasets were extracted from OncoLnc database. The Kaplan-Meier survival curves were generated from the datasets with a cutoff-high 60% (n=105) and cutoff-low 40% (n=70) using the website’s default program. The significance was determined by log rank p value. The patient survival and OPN expression data are presented in online supplemental table 3.
Mice
Female and male C57BL/6 mice were purchased from the Jackson Laboratory (Bar Harbor, Maine, USA). All mice used in this study were between 2 and 3 months old at the start of the experiment.
Cell lines
The mouse pancreatic tumor UN-KC-6141 cell line was provided by Surinder K Batra at the University of Nebraska Medical Center (Omaha, NE). UN-KC-6141 cell line was characterized previously.24 PANC02-H7 cells were provided by Dr. Min Li at the University of Oklahoma Health Sciences Center (Oklahoma City, OK). PANC02-H7 cell line were characterized previously.25 J774M cells were sorted from J774 parent cells for CD11b+Gr1+ cells and characterized as previously described.26 Cell lines were tested bimonthly for mycoplasma contamination and are mycoplasma-free at the time of use.
The orthotopic pancreatic cancer mouse models
PANC02-H7 and UN-KC-6141 cells (1×10⁴ cells/mouse) were surgically injected to the pancreas of C57BL/6 mice as previously described.10
Compound synthesis
WDR5-47 and WDR5-0102 were synthesized and characterized as previously described.27 Cpd23 was synthesized and characterized as previously described.28 In short, for the synthesis of WDR-47 and WDR5-0102, 2-amino-4-nitrofluorobenzene was reacted with the requisite benzoyl chloride in dichloromethane in the presence of pyridine, and the amide thus obtained was then reacted with N-methylpiperidine in DMF (dimethylformamide) in presence of anhydrous potassium carbonate. To synthesize Cpd23, 2-nitro-4-bromofluorobenzene was first reacted with N-methylpiperidine in DMF in presence of anhydrous potassium carbonate and the nitro group then converted to the amine by catalytic hydrogenation. The aromatic amine was then reacted with the appropriate substituted benzoyl chloride in dichloromethane in presence of pyridine. The aromatic bromide was finally coupled with four pyridylboronic acid in dioxane using Pd(PPh3)2Cl2 catalyst and cesium carbonate base. The purity of the compounds is determined by 1H-NMR spectroscopy as >98%. All three compounds were then validated for activity in inhibition of histone methyltransferase activity inhibition in Reaction Biology Corp (Malvern, Pennsylvania, USA).
Histone methyltransferase activity assay
Inhibition of MLL1 enzymatic activity by WDR5-47, WDR5-0102 and Cpd23 was determined in a 10-dose IC50 mode with 3-fold serial dilution starting at 10 µM with HotSpot format at Reaction Biology Corp. MLL1-WDR5 protein complexes and nucleosome were used. Reactions were initiated by the addition of 3H-S-adenosyl-methionine (1 µM).
OPN knockout tumor cell line generation and mouse tumor model
HEK293FT cells were cotransfected with pCMV-VSV-G (Addgene #8454), psPAX2 (Addgene #12260) and lentiCRISPRv2 (Genscript, Piscataway, NJ) plasmids containing scramble (GGAAGACTTAGTCGAATGAT) or Spp1-specific (GCAAATCACTGCCAATCTCA) sgRNA-coding sequence using Lipofectamine 2000 (Life Technologies) to produce CRISPR lentivirus.29 PANC02-H7 cells were transduced with the lentivirus particle. Cells were selected with puromycin to generate stable cell lines PANC02-H7.Scramble and PANC02-H7.Spp1 KO, respectively. Cells were cultured in 24-well plate (2.5×10⁵ cells/well in 1 mL medium) for 24 hours. Culture supernatants were collected for OPN protein measurement by ELISA as described below. PANC02-H7.Scramble and PANC02-H7.Spp1 KO cells (2×10⁴ cells/mouse) were surgically injected to pancreas of C57BL/6 mice as previously described.10 The tumor-bearing mice were treated 5 days after tumor cell injection with IgG or anti-PD-1 (clone RMP1-14, 200 µg/mouse, Bio X Cell, Lebanon, New Hampshire, USA) every 2 days via i.p. injection. Mice were sacrifice 20 days after tumor cell injection to analyze tumor.
OPN protein analysis by ELISA
Human serum was analyzed for OPN protein level using the human OPN ELISA kit (Cat# DOST00, R&D Systems, Minneapolis, MN) according to the manufacturer’s instructions. Tumor cell culture supernatant and mouse serum was analyzed for OPN protein level using the mouse OPN ELISA kit (Cat # DY441, R&D System) according to the manufacturer’s instructions.
WDR5 therapy and anti-PD-1 immunotherapy
The orthotopic PANC02-H7 tumor-bearing mice were treated 5 days after tumor cell injection. The treatment groups include: solvent control (n=8), WDR5-47 (60 mg/kg body weight in PEG300), anti-PD-1 (clone RMP1-14, 200 µg/mouse). WDR5-47 was administered daily via i.p. injection. Anti-PD-1 was administered every 2 days via i.p. injection. Mice were sacrifice 20 days after tumor cell injection to analyze tumor.
Immunohistochemistry
Tissue sections were stained as previously described.14 The sections were stained with anti-human OPN antibody (Cat # AF1433. R&D System) and mounted in VectaMount Permanent Mounting Medium (Vector Lab, Burlingame, California, USA).
Chromatin immunoprecipitation
Tumor tissues were collected from orthotopic PANC02-H7 and UN-KC-6141 tumor-bearing mice. Normal whols pancreas were dissected from tumor-free C57BL/6 mice. The normal pancreas and tumor tissues were rinsed in PBS and used immediately for chromatin preparation using the SimpleChIP Plus Enzymatic Chromatin IP Kit (Cat# 9004. Cell Signaling Tech, Danvers, MA). ChIP was performed using anti-H3K4me3 (Cat# 9751. Cell Signaling Tech) and the SimpleChIP Plus Enzymatic Chromatin IP Kit according to the manufacturer’s instructions. The immunoprecipitated genomic DNA fragments were analyzed qPCR using PCR primers covering the region of Spp1 promoter regions (online supplemental table 4).
ChIP-Sequencing
Chromatin fragments were prepared from pancreas of tumor-free C57BL/6 mice and tumors and immunoprecipitated as described above and used to construct the DNA library for next-generation sequencing (NGS) by NGS service provider Novogene Corp (Chula Vista, CA). The quality of raw sequencing reads was examined by FastQC and the adaptor and low quality sequences were trimmed and clean by Trim Galore. The cleaned reads were mapped to mouse reference genome (mm10) using Bowtie2. PCR duplicates were identified and removed by Picard tool. H3K4me3 enriched peaks were identified by MACS2 and annotated using ChIPseeker. Differential peaks between orthotopic pancreatic tumor and normal pancreas were identified by DiffBind. The analysis described above were performed in Galaxy server (use.galaxy.org). The entire dataset is deposited in GEO database (Accession # GSE178677).
Flow cytometry
Tumor tissues were collected and digested in collagenase solution (1 mg/mL collagenase, 0.1 mg/mL hyaluronidase, and 30 U/mL DNase I) and passed through a 100 µm cell filter. Cells were then lysed with red cell lysis buffer, stained with fluorescent dye-conjugated antibodies (online supplemental table 5) and analyzed in a LSRFortessa. All flow cytometry data were analyzed using FlowJo program.
Gene expression analysis
RNA was isolated from tissues using GeneJET RNA Purification Kit (Cat# K0732. Thermo Fisher Scientific) according to manufacturer’s instructions. cDNA was synthesized from total RNA and used for analysis of gene expression by qPCR using gene-specific primers (online supplemental table 4) in a StepOne Plus Real-Time PCR System (Applied Biosystems, Foster City, California, USA).
RNA sequencing
Tumor tissues were collected from orthotopic PANC02-H7 and UN-KC-6141 tumor-bearing mice. Normal pancreas were dissected from tumor-free C57BL/6 mice. The normal pancreas and tumor tissues were rinsed in PBS and used for total RNA isolation using the GenJet RNA Isolation Kit (ThermalFisher Scientific). Total RNA was used to construct the cDNA library for high throughout DNA sequencing by Novogene. The cleaned reads were mapped to reference genome (mm10) using STAR aligner. The sequence counts for each gene were collected by featureCounts and annotated using annotateMyIDs function. The differential expression analysis between tumor and normal samples was performed using DESeq2. The above-mentioned analysis were performed in Galaxy server (use.galaxy.org). The heatmaps were generated using ComplexHeatmap in R V.3.6.3. KEGG pathway enrichment analysis was performed using clusterProfiler. The entire dataset is deposited in GEO database (Accession # GSE178677).
Western blotting analysis
Cells were cultured in the presence of various concentrations of WDR5-47, WDR5-0102 and Cpd23 for 24 hours. Cells were then lysed, blotted, and probed with anti-mouse OPN antibody (Cat# AF808, R&D Systems and Cat#691302, Biolegend) using procedures as previously described.26
Cell viability assay
Cell viability assays were performed using CellTiter 96 Aqueous One Solution Cell Proliferation Assay Kit (Cat# G3582, Promega, Madison WI) according to the manufacturer’s instructions.
Statistical analysis
A two-factor analysis of variance was used to examine whether there was a synergistic effect of WDR5-47 and OPN (WDR5-47/Control or Scramble/Spp1 KO) with anti-PD-1 immunotherapy (anti-PD-1 vs control) for tumor growth control (tumor size and weight). Each model contained fixed effects of WDR5-47 and OPN, anti-PD-1 status, and the two-factor interaction between these two effects. Of statistical interest was the F-test for the two-factor interaction between WDR5-47/OPN and anti-PD-1. If this F-test is statistically significant, this will indicate that a synergistic effect is evident. A Tukey-Kramer multiple comparison procedure was used to examine post hoc pairwise differences between groups.
Results
The expression of Spp1 is activated by its promoter H3K4me3 deposition in pancreatic carcinoma in vivo
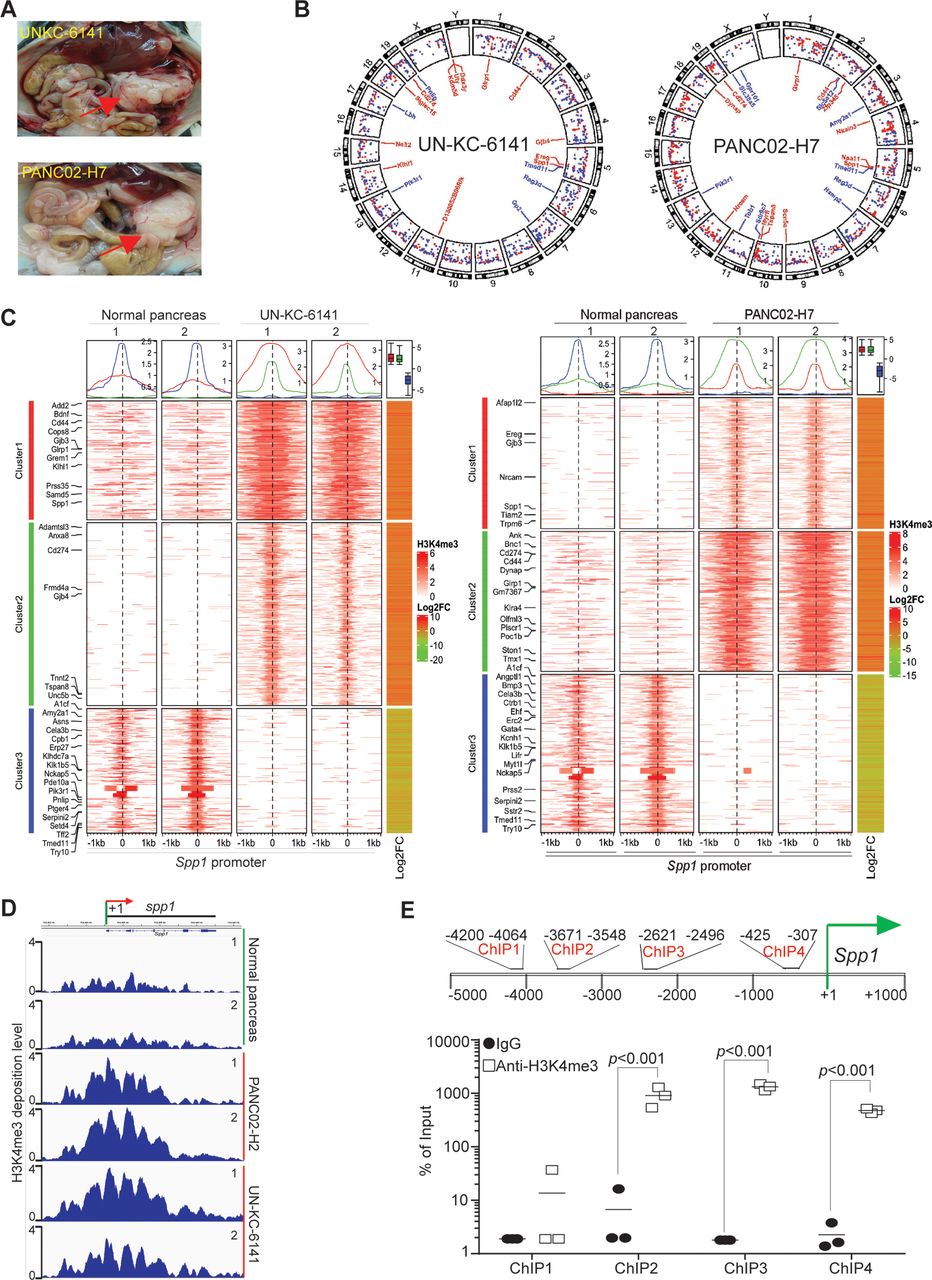
To profile H3K4me3 deposition change in pancreatic carcinoma genome, we surgically transplanted UN-KC-6141 and PANC02-H7 cells to mouse pancreas to establish orthotopic pancreatic tumor mouse models (figure 1A). Pancreas of UN-KC-6141 and PANC02-H7 tumors were collected and subjected to ChIP and high throughout sequencing. H3K4me3 deposition is enriched throughout the entire genome in both UN-KC-6141 and PANC02-H7 tumors as compared with the normal pancreas (figure 1B,C). As expected, the promoter region of Cd274, the gene encoding PD-L1, has increased H3K4me3 deposition (figure 1B,C). Of interest is the finding that Spp1 and its receptor Cd44 have increased H3K4me3 deposition in their promoter regions (figure 1B). H3K4me3 deposition is enriched in a region flanking the Spp1 transcription start site (figure 1D). Individual ChIP analysis validated that H3K4me3 is enriched around the Spp1 transcription start site in mouse pancreatic carcinoma in vivo (figure 1E).

The promoter of Spp1 and Cd44 are enriched with H3K4me3 deposition in mouse pancreatic carcinoma in vivo. (A) Orthotopic pancreatic UN-KC-6141 and PANC02-H7 tumor mouse models. the red arrows indicate the tumors. (B) Normal pancreas and the orthotopic pancreatic tumors as shown in A were collected for chromatin preparation and immunoprecipitation using H3K4me3-specific antibody. The CHIP DNA libraries were sequenced by illumina NGS sequencing and analyzed using bioinformatics pipeline described in the methods. Shown is the circos plot of the genome-wide distribution of differential H3K4me3 peaks between normal and tumor samples along all chromosomes. The differential peaks with log2 fold change >1 are shown and peaks associated several genes with known functions in immune suppression and tumor progression are mapped in the inner circle. (C) The left two heatmaps illustrate differential H3K4me3 signals within the 2 kb window from the center of each peak. The H3K4me3 ChIP-Seq data from two biological replicates were merged and used to plot the heatmap. The line graphs on top of the heatmap demonstrate the average accessibility profiles of three clusters with increased or decreased H3K4me3 signals. The column on the right which shows matched average expression log2FC of 2 replicates, and the results are summarized in the box plot shown on top of the column. Representative genes with significant changes in both H3K4me3 and gene expression are listed beside the heatmap. (D) H3K4me3 deposition profile in the Spp1 gene region. (E) Spp1 promoter structure showing CHIP PCR-amplified regions (top panel). UN-KC-6141 tumors were analyzed by H3K4me3 CHIP and qPCR (bottom panel) using the PCR primer pairs as indicated in the top panel ChIP-Seq, chromatin immunoprecipitation sequencing.
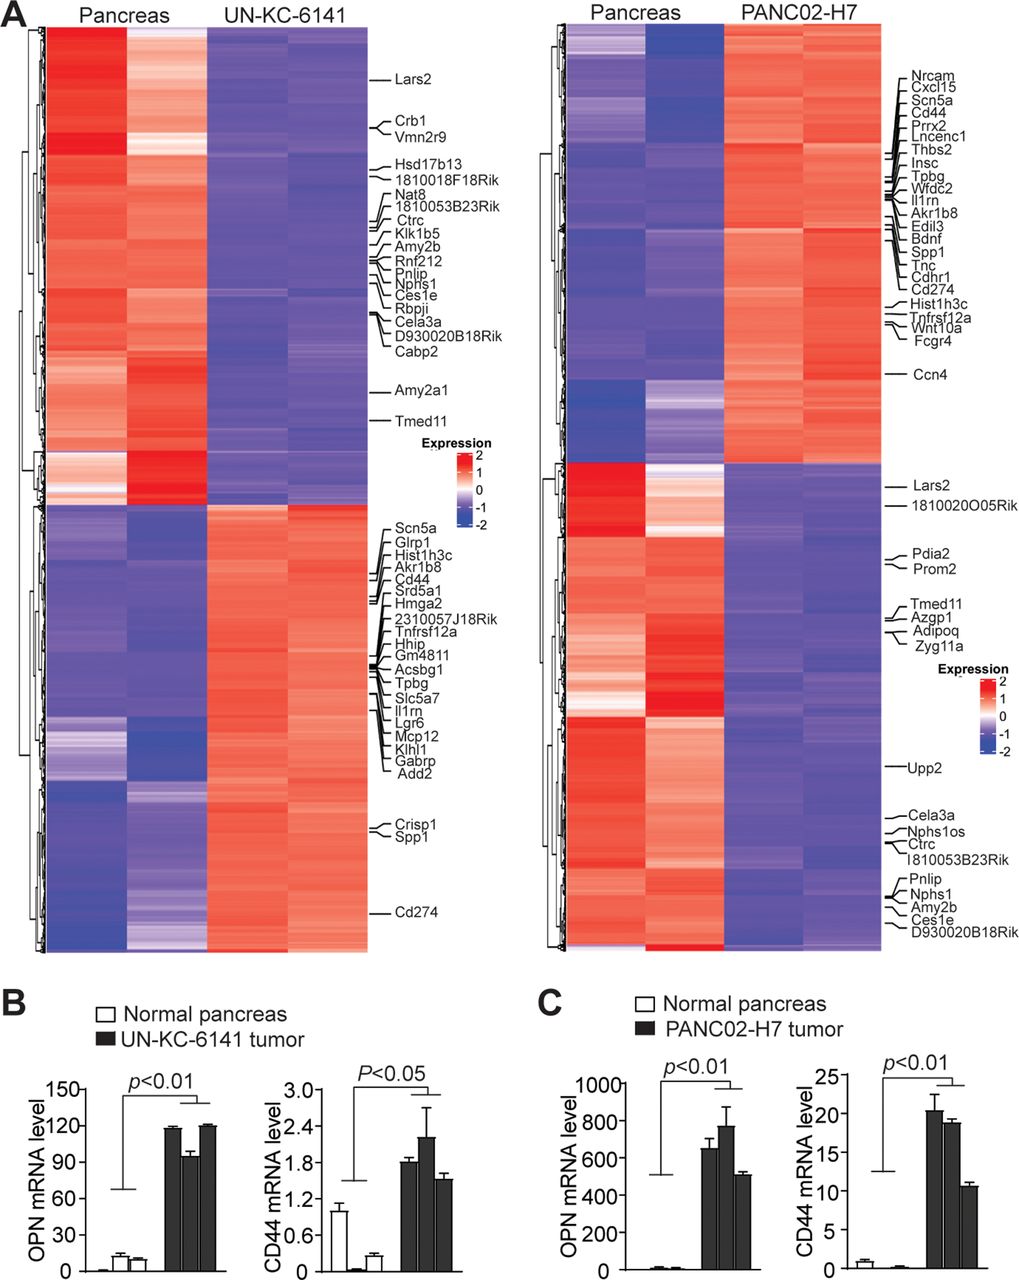
Consistent with increased H3K4me3 deposition, RNA-Seq analysis determined that Spp1 and Cd44 expression levels are increased in both UN-KC-6141 and PANC02-H7 tumors (figure 2A). Increased Spp1 and Cd44 expression in both pancreatic mouse tumor was validated by qPCR analysis (figure 2B,C). Pathway analysis revealed multiple pathways, including PI3K-Akt, MAPK signaling, proteoglycans in cancer, focal adhesion, phagosome, pancreatic secretion, ECM (Extracellular matrix)-receptor interaction, gap junction are enriched in the tumors (online supplemental figure 1). Among these enriched pathways, PI3K-Akt pathway has a large set of genes with increased expression (online supplemental figure 2). Spp1 and Cd44 are enriched in the ECM-receptor and focal adhesion pathways (online supplemental figure 2). Furthermore, several integrins that function as OPN receptors are also enriched in the ECM-receptor pathways in both tumors in vivo (online supplemental figure 3).

Transcriptome analysis of mouse pancreatic tumor in vivo. (A) RNA was extracted from normal pancreas and the orthotopic mouse pancreatic tumors as shown in figure 1A and analyzed by RNA-seq. Differentially expressed genes were extracted and displayed in heatmap. The gene expression level was displayed in color gradient as indicated in the right. Several genes with known functions in immune suppression and tumor progression are indicated at the right. (B, C) qPCR analysis of OPN and CD44 expression in normal pancreas as compared with UN-KC-6141 (B) and PANC02-H7 (C) tumors. Each column indicates data from one mouse. OPN, osteopontin.
OPN protein is increased in human pancreatic cancer patients and is correlated with poor patient prognosis
To determine the human relevance of the above finding, we analyzed OPN protein level in no-neoplastic human pancreas and pancreatic tumors. OPN protein level is higher in pancreatic tumors than in non-neoplastic pancreas in all five pancreatic patients analyzed (figure 3A–C). Analysis of OPN mRNA datasets from TCGA (The Cancer Genome Atlas) database also determined that OPN expression level is significantly higher in human pancreatic tumor than in normal pancreas (figure 3D). OPN exists as a secreted protein, analysis of serum OPN determined that OPN protein level is significantly higher in serum from pancreatic cancer patients as compared with serum from healthy donors (figure 3E). Furthermore, OPN expression level is inversely correlated with pancreatic cancer patient survival time (figure 3F).

OPN protein level in non-neoplastic human pancreas and human pancreatic carcinoma. (A) Human non-neoplastic pancreas (n=5) and pancreatic tumor (n=5) were stained with OPN-specific antibody. brown color indicates OPN staining intensity. shown are representative images. (B) Quantification of OPN+ cells in the pancreas and pancreatic tumor as shown in A. (C) OPN protein intensity in normal pancreas and pancreatic tumor as shown in A. The relative OPN staining intensity is set at 1–5. (D) OPN mRNA level datasets of non-neoplastic pancreas (n=182) and pancreatic tumor (n=167) were extracted from TCGA database and plotted. (E) Serum specimens were collected from healthy donors (n=20) and pancreatic cancer patients (n=20) and measured for OPN protein level by ELISA. (F) OPN mRNA expression level and pancreatic cancer patient survival datasets were extracted from OncoLnc database. Kaplan-Meier survival curve was generated with a 40% low OPN cut-off and 60% high OPN cut-off using log rank test. OPN, osteopontin.
OPN is expressed in monocytic myeloid-derived suppressor cells in pancreatic tumor microenvironment
OPN protein is present in both tumor cells and tumor-infiltrating immune cells in human pancreatic carcinoma (figure 3A). Myeloid cells are major populations of immune cells in pancreatic carcinoma that act as potent immune suppressors. We then sought to determine OPN expression profiles in tumor-infiltrating myeloid cells. A subset of CD11b+Gr1+ myeloid-derived suppressor cells (MDSCs) are OPN+ in both UN-KC-6141 and PANC02-H7 tumors (figure 4B,C). Further analysis of MDSCs into monocytic MDSCs (M-MDSCs) and polymorphonuclear MDSCs (PMN-MDSCs) indicates that tumor-infiltrating OPN+ MDSCs are primarily M-MDSCs in both UN-KC-6141 and PANC02-H7 tumors in vivo (figure 4B,C).
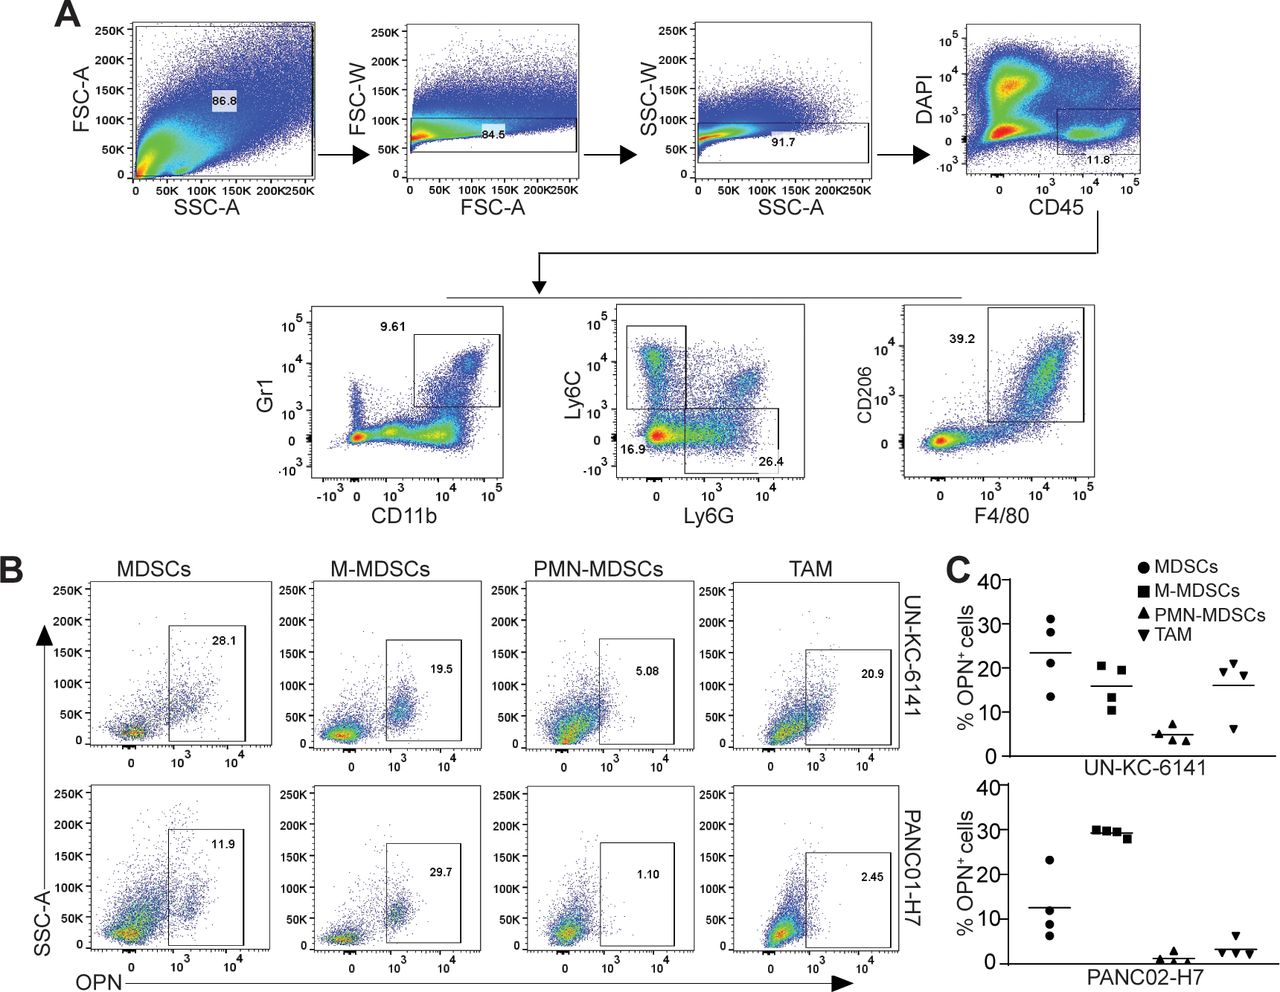
OPN cellular expression profiles in myeloid cells in pancreatic mouse tumors in vivo. (A) UN-KC-6141 and PANC02-H7 tumors were collected, digested with collagenase, stained with the indicated antibodies, and analyzed by flow cytometry. Shown is the gating strategy. (B) Subsets of tumor-infiltrating myeloid cells were analyzed for OPN+ cells in the two mouse tumor models. (C) Quantification of OPN+ subsets of tumor-infiltrating myeloid cells in the two pancreatic tumors. OPN, osteopontin.
PD-L1 is expressed in PMN-MDSCs and tumor-associated macrophage
We next sought to determine PD-1 and PD-L1 expression profiles in pancreatic tumor. CD4+ and CD8+ T cells are present in both UN-KC-6141 and PANC02-H7 tumors (figure 5A–C, 5G-I). Approximately 39%–49% tumor-infiltrating CD4+ T cells are PD-1+ and 50%–61% CD8+ T cells express PD-1 (figure 5D,J). More than 50% tumor-infiltrating MDSCs express PD-L1. About 41%–44% M-MDSCs express PD-L1 and almost all PMN-MDSCs are PD-L1+ (figure 5E,F,K,L). About 83%–93% of tumor-associated macrophages are PD-L1+ cells (figure 5E,F,K,L). Furthermore, all pancreatic tumor cells express high level of PD-L1 in vivo (figure 5E,F,K,L).
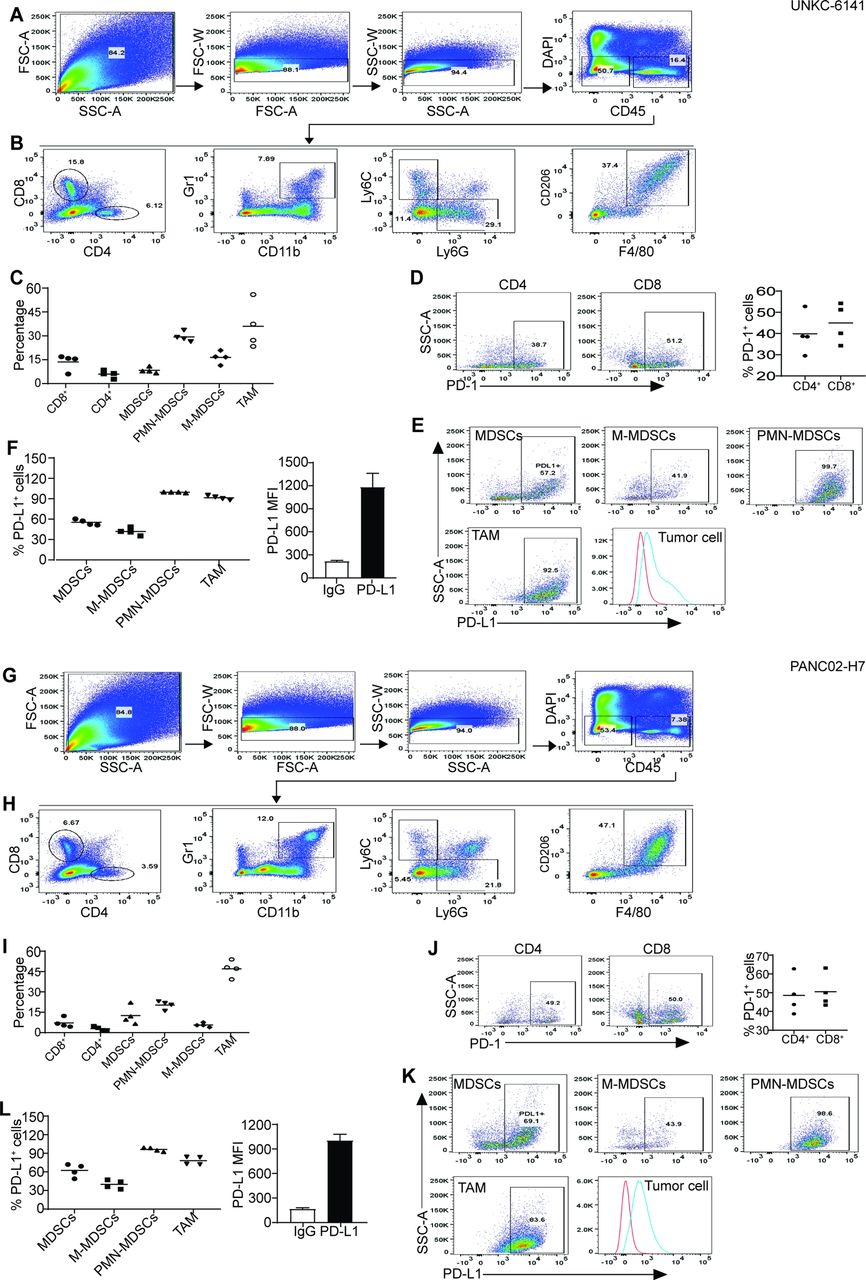
Tumor-infiltrating immune cell profiles and PD-1/PD-L1 cellular profiles in pancreatic mouse tumors in vivo. (A, G) Tumors were collected from UN-KC-6141 (A–F) and PANC02-H7 (G–L) tumor-bearing mice and processed as in figure 4A. Shown is the gating strategy. (B, H) Analysis of tumor-infiltrating T cells and myeloid cells. (C, I) Quantification of T cells and myeloid cell subsets as shown in (B, H). (D, J) PD-1 expression in tumor-infiltrating T cells. (E, K) Analysis of PD-L1 expression in subsets of tumor-infiltrating myeloid cells and tumor cells. (F, L) Quantification of PD-L1+ subsets of tumor-infiltrating myeloid cells (left panel) and PD-L1 MFI in tumor cells (right panel). M-MDSCs, monocytic myeloid-derived suppressor cells; PMN, polymorphonuclear; TAM, tumor-associated macrophage; FSC:forward scatter; SSC: side scatter.
The WDR5-H3K4me3 epigenetic axis regulates OPN expression in pancreatic tumor cells and MDSCs
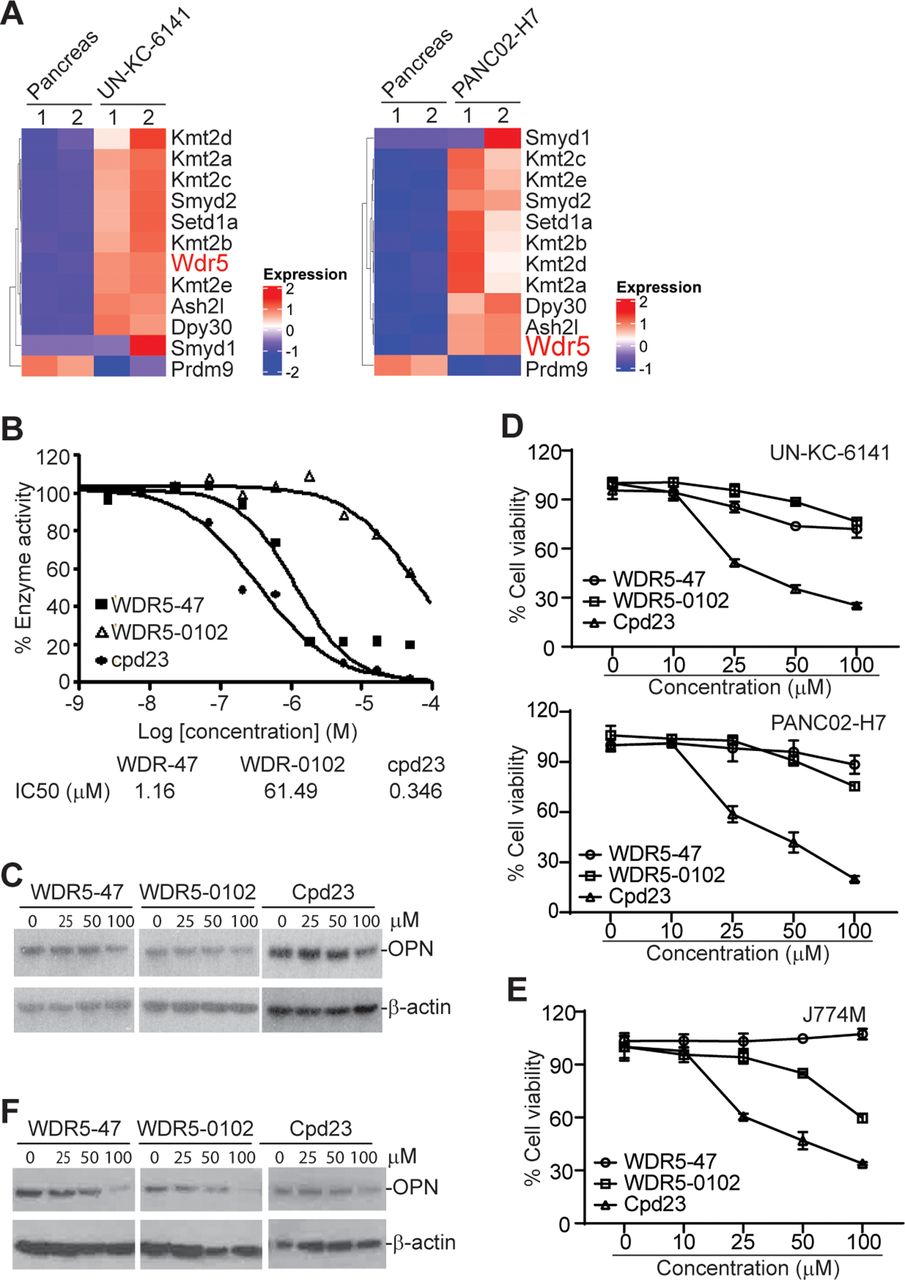
The mixed lineage leukemia family of proteins (Mll1-4/Kmt2a-d, SET1A and SET1B, Set1, and Smyd) selectively methylate histone 3 Lys4 (H3K4). The enzyme activity of these histone methyltransferases requires adaptor proteins WDR5, RBBP5 and ASH2L.30 Histone methyltransferase Smyd2/Kmt3c has been shown to be up-regulated in pancreatic cancer to render resistance to chemotherapy.31 RNA-seq analysis revealed a large set of histone lysine methyltransferases, including H3K4me3-selective methyltransferase, are highly upregulated in both UN-KC-6141 and PANC02-H7 tumors in vivo as compared with normal pancreas (figure 6A). WDR5 forms a protein complex with these methyltransferases and is essential for enzyme activity of all H3K4me3-specific histone methyltransferases.27 28 We, therefore, pursued WDR5 inhibition to suppress H3K4me3 in pancreatic tumors. WDR5-47, WDR5-0102, and cpd23 are well-characterized small molecule WDR5 inhibitors for H3K4 trimethylation.27 28 Analysis of MLL1-WDR5 histone methyltransferase activity in the presence of WDR-47, WDR5-0102, and cpd23 determined that all these three compounds inhibit MLL1-WDR5 enzymatic activity in a dose-dependent manner (figure 6B). We then cultured pancreatic tumor cells in the presence of these inhibitors and analyzed OPN protein level. All these three WDR5-selective inhibitors decrease OPN protein level in pancreatic tumor cells in vitro (figure 6C). WDR5-47 and WDR5-0102 exhibit minimal cytotoxicity to pancreatic tumor cells, whereas cpd23 showed significant cytotoxicity to pancreatic tumor cells (figure 6D). We next sought to determine whether these WDR5-selective inhibitors inhibit OPN expression in MDSCs. J774M is a CD11b+Gr1+ MDSC-like cell line established from the parent J774 monocytic leukemia cell lines. J774M cells have potent inhibitory activity against T cell activation in vitro and thus mimic MDSCs in vitro.26 We treated J774M cells with these WDR5-selective inhibitors and analyzed OPN protein level. All three inhibitors decrease OPN protein level in J774M cells in a dose-dependent manner (figure 6F). Analysis of cell viability determined that WDR5-47 has no cytotoxicity to J774M, and WDR5-0102 and cpd23 exhibit a dose-dependent cytotoxicity to J774M cells (figure 6E).

The WDR5-H3K4me3 axis regulates OPN expression in tumor cells and MDSCs. (A) Heatmap of differentially expressed histone methyltransferases. Shown are ratios of tumor versus normal pancreas with red indicates upregulation in tumor cells and blue indicates downregulation in tumor cells. (B) WDR5 inhibitors were tested in a 10-dose IC50 mode with threefold serial dilutions using [3H]S-adenosyl-methionine as substrate with recombinant human MLL1-WDR5 complex. The enzyme activity was plotted against inhibitor concentrations. IC50s were calculated using the GraphPad prism program. (C) UN-KC-6141 cells were cultured in the presence of WDR5 inhibitors at the indicated concentrations for 24 hours and analyzed by Western blotting. (D) Tumor cells were cultured in the presence of WDR5 inhibitors at the indicated concentrations for 24 hours and analyzed for cell viability. (E) J774M cells were cultured in the presence of WDR5 inhibitors at the indicated concentrations for 24 hours and analyzed for cell viability. (F) J774M cells were cultured in the presence of WDR5 inhibitors at the indicated concentrations for 24 hours and analyzed by Western Blotting. MDSCs, myeloid-derived suppressor cells; OPN, osteopontin.
Inhibition of WDR5 represses OPN production and enhances efficacy of anti-PD-1 immunotherapy
We then reasoned that targeting pancreatic tumor with a WDR5 inhibitor should be effective in suppression of pancreatic tumor growth in vivo. To test this hypothesis, we made use of the orthotopic pancreatic tumor mouse models. Both UN-KC-6141 and PANC02-H7 tumor-infiltrating T cells express FasL and granzyme B (online supplemental figure 4A-C), two essential effectors of the host T cells.32 Analysis of tumor cells revealed that PANC02-H7 express the death receptor Fas while UN-KC-6141 tumor cells lack Fas expression on its surface in vivo (online supplemental figure 4D). We therefore made use of PANC02-H7 tumor model in this proof-of-principle study. WDR5-47 was used as the WDR5 inhibitor due to its minimal direct cytotoxicity and low IC50. Tumor-bearing mice were treated with WDR5-47 and anti-PD-1 either alone or in combination. OPN is secreted protein. Consistent with the in vitro observation that WDR5-47 treatment decreases OPN protein level in tumor cells and MDSCs (figure 6C,F). Treatment of tumor-bearing mice with WDR5-47 significantly decreased OPN protein level in the peripheral blood (figure 7A).

Targeting WDR5 decreases OPN level and increases efficacy of anti-PD-1 immunotherapy in suppression of pancreatic tumor growth in vivo. (A) PANC02-H7 cells (1×10⁴ cells/mouse) were surgically transplanted into mouse pancreas. The tumor-bearing mice were treated 5 days later with solvent, WDR5-47 (60 mg/kg body weight) daily, anti-PD-1 every 2 days, or WDR5−47+ anti-PD-1. Mice were sacrificed on day 20. Serum was collected and measured for OPN protein level by ELISA. (B) Tumors were dissected and measured for tumor size and weight. A Tukey-Kramer multiple comparison test was used to determine statistical significance. (C) PANC02-H7.Scramble and PANC02-H7.Spp1 KO cell culture supernatants were analyzed by ELISA for OPN protein concentration. (D) PANC02-H7.Scramble and PANC02-H7.Spp1 KO cells (2×10⁴ cells/mouse) were surgically transplanted to mouse pancreas. The tumor-bearing mice were treated 5 days later with IgG and anti-PD-1 (200 µg/mouse) every 2 days. Mice were sacrificed on day 20. Tumors were dissected and measured for tumor size and weight. A Tukey-Kramer multiple comparison test was used to determine statistical significance. KO, knock out; OPN, osteopontin.
Consistent with the decreased OPN protein level by WDR5-47 treatment in tumor-bearing mice, a statistically significant interaction between WDR5-47 and anti-PD-1 was detected for tumor weight (F(1,28)=6.97, p=0.0134) (online supplemental table 6, figure 7B). The control group had the highest tumor weight, followed by WDR5-47, anti-PD-1 alone, and then WDR5−47+ anti-PD-1 with the lowest tumor weight (online supplemental table 6). The Tukey-Kramer multiple comparison test on the interaction effect indicated that tumor weights were significantly lower for the WDR5−47+ anti-PD1 when compared with the control (p<0.0001) and anti-PD-1 (p=0.0010). The control group had significantly higher tumor weights than all other groups (p<0.0001 for each comparison to anti-PD-1, WDR5-047, and WDR5+ anti-PD-1). There were no statistically significant differences between anti-PD-1 and WDR-47 (p=0.3161) nor WDR-47 compared with WDR5−47+anti-PD-1 (p=0.0756). A statistically significant interaction between WDR5-47 and anti-PD-1 was also detected for tumor size (F(1,28)=14.29, p=0.0008) (online supplemental table 6, figure 7B). The control group had the largest tumor size, followed by anti-PD-1, WDR5-47, and then WDR5−47+ anti-PD-1 with the smallest tumor size. The Tukey-Kramer multiple comparison test on the interaction effect indicated that the control group had significantly greater tumor size than all other groups (p<0.0001 for each comparison to anti-PD-1, WDR5-47, and WDR5−47+ anti-PD-1. There were no other statistically significant differences between groups (anti-PD-1 vs WDR5-47: p=0.4640; anti-PD-1 vs WDR5−47+anti-PD-1: p=0.0504; WDR5-47 vs anti-PD-1: p=0.6016). Taken together, these findings indicate that combined WDR5-47 and anti-PD-1 therapy has a significantly higher efficacy in suppression of the orthotopic PANC02-H7 tumor growth than either WDR5-47 or anti-PD-1 therapy alone.
H3K4me3 also regulates PD-L1 expression.14 To determine the direct effect of OPN on pancreatic tumor growth and response to anti-PD-1 immunotherapy, we knocked out Spp1, the gene that encodes OPN (figure 7C), in PANC02-H7 cells. ELISA analysis confirmed that Spp1 is knocked out (figure 7C). PANC02-H7.Scramble and PANC02-H7.Spp1 KO cells were then surgically transplanted to C57BL/6 mice to establish orthotopic tumor. A higher tumor cell dose was used in this model due to the increased immunogenicity of the tumor cells after lentiviral vector transduction. The OPN WT and KO tumor-bearing mice were then treated with anti-PD-1 mAb. A statistically significant interaction between OPN status and anti-PD-1 was detected for tumor weight (F(1,21)=5.28, p=0.0319) (online supplemental table 7, figure 7D). OPN WT (Scramble) had the highest tumor weight, followed by WT +anti-PD1, Spp1 KO, and then Spp1 KO +anti-PD1 (the lowest tumor weight). The Tukey-Kramer multiple comparison test on the interaction effect indicated that tumor weights were significantly higher for the WT tumor when compared with all other groups (Spp1 KO: p<0.0001, Spp1 KO+ anti-PD1: p=0.0010, WT +anti-PD1: p=0.0041). There were no statistically significant differences between Spp1 KO and Spp1 KO+ anti-PD1 (p=0.6576), Spp1 KO and WT +anti-PD1 (p=0.7371), or Spp1 KO+ anti-PD1 and WT+ anti-PD1 (p=0.2115).
Unlike the patterns in tumor weight, there was no statistically significant interaction between OPN status and anti-PD-1 in terms of tumor size (online supplemental table 7, figure 7D). However, the Tukey-Kramer multiple comparison test on the interaction effect indicated that WT tumor had significantly higher tumor size when compared with all other groups (Spp1 KO: p<0.0001, Spp1 KO+ anti-PD1: p=<0.0001, WT+ anti-PD1: p=0.0031). Spp1 KO+ anti-PD-1 had significantly lower tumor size when compared with WT+ anti-PD1 (p=0.0017). There were no statistically significant differences in tumor size for Spp1 KO and Spp1 KO+ anti-PD1 (p=0.1092) or Spp1 KO and WT +anti-PD1 (p=0.1478). Taken together, these findings indicate that knocking out OPN significantly reduced both tumor size and weight and there is a statistically significant interaction between OPN status and anti-PD-1 efficacy in terms of tumor weight in tumor-bearing mice.
Discussion/conclusion
Histone methylation is one of the major histone modifications that plays a critical role in regulating gene transcription.33 34 H3K4me3 is a key histone modification that often selectively localizes to target gene promoters and downstream transcription start sites to activate target gene transcription.34 In this study, we determined that H3K4me3 deposition is altered at the promoters and downstream transcription start sites in a wide range of genes throughout the entire genome in pancreatic tumor as compared with normal pancreas in vivo. This finding suggests that H3K4me3 might play a broad role in gene transcription regulation in the pancreatic cancer genome and that the H3K4me3 epigenome dysregulation plays a critical role in pancreatic cancer pathogenesis and development. ChIP-Seq and RNA-Seq screening identified the ECM-receptor interaction pathway as a major H3K4me3-regulated pathways in pancreatic tumor. Among the genes in this pathway that are up-regulated in pancreatic tumors as compared with normal pancreas are Cd44 and one of its ligands Spp1, the gene that encode OPN protein. CD44 is expressed on tumor cells, myeloid cells, and T cells.35–37 OPN is known for its function in direct promotion of tumor growth and progression.38 Emerging experimental data indicate that OPN also functions in immune suppression through interaction with its receptors on myeloid cells and T cells.37 39–42 We, therefore, focused on OPN in this study, we determined that both CD44 and OPN are upregulated in mouse pancreatic tumors as compared with the normal pancreas. Furthermore, we determined that H3K4me3 deposition in the Cd44 and Spp1 promoter regions are increased in pancreatic tumors in vivo. These findings indicate that H3K4me3 may promote pancreatic tumor growth and progression through activating the OPN-CD44 axis to promote pancreatic cancer immune escape.
Despite the low TMBs in pancreatic cancer, there are low to moderate CTL tumor infiltration in human pancreatic cancer,9–11 suggesting that human pancreatic cancer is not a completely immunologically ‘cold’ cancer. On the other hand, PD-L1 is expressed in pancreatic tumor cells in the tumor microenvironment.10 13 14 Furthermore, ICI immunotherapy efficacy can be improved by combined therapies with other immunotherapeutic agents.43 44 These observations suggest that other immune checkpoints and immune suppressive mechanisms might compensate PD-L1 function in pancreatic cancer immune escape. Our findings indicate that OPN is such an immune checkpoint that may compensate PD-L1 function to promote immune escape in pancreatic cancer.
Human OPN is encoded by a single copy gene SPP1, but it has at least five splicing variants and three of these alternative variants translate into proteins.45 Furthermore, these protein isoforms have different functions and may contribute to cancer-specific tumor promotion.46 47 In addition to binding to CD44 through its CD44 hairpin domain, OPN also binds to its integrin receptors αvβ1, αvβ3, αvβ5, αvβ6, α8β1, α5β1 through its RGD domain, and to α9β1, α4β1, α4β7 through its SVVYGLR domain.48 These observations suggest that OPN neutralization antibody may be efficient to block OPN function in certain types of cancer,49 it may not be efficient to block all OPN-receptor interactions in the tumor microenvironment. Because all OPN variants are encoded by a single copy gene, targeting OPN expression is potentially a more effective approach. Our finding indicates that targeting H3K4me3 is effective in repression of OPN expression in pancreatic tumors and MDSCs. WDR5 is essential for all histone methyltransferase activity in catalyzing H3K4me3.30 WDR5-47, WDR5-0102, and Cpd23 were originally designed and developed for leukemia therapy.27 30 50 We determined in this study that these WDR5 inhibitors have different cytotoxicity to pancreatic tumor cells and MDSCs. WDR5-47 is relatively less cytotoxic but is effective in repressing OPN expression to suppress pancreatic tumor growth in vivo. Furthermore, inhibition of WDR5 also significantly improved the efficacy of anti-PD-1 immunotherapy in suppression of pancreatic tumor growth in vivo. However, knocking out OPN significantly suppressed pancreatic tumor growth, knocking out OPN is less effective than inhibiting the WDR5-H3K4me3-OPN axis in augmentation of anti-PD-1 efficacy. This phenomenon indicates that, in addition to OPN, the WDR5-H3K4me3 pathway likely also regulates other immune checkpoints and immune suppressors. Further studies are needed to identify these potential immune checkpoints and immune suppressors.
One limitation of this study is the phenomenon that the mouse pancreatic carcinomas used in this study are responsive to anti-PD-1 immunotherapy, whereas human pancreatic cancer does not respond to anti-PD-1 immunotherapy. The findings made in these mouse tumor models may not be fully translational. Further validation of our findings in a more human pancreatic cancer relevant mouse tumor model, such as the human pancreatic cancer patient-derived xenograft humanized NSG mouse model, is needed before translating WDR5 inhibition as an enhancer of ICI immunotherapy in human pancreatic cancer patients.
Data availability statement
Data are available in a public, open access repository. NA.
Ethics statements
Ethics approval
All studies with human specimens were approved by Augusta University Institutional Review Board (Approval # 9 33 148–1). All studies with mice were approved by Augusta University Institutional Animal Care and Use Committee (Protocol # 2008–0162).
Acknowledgments
We thank Dr. Roni Bollag at Georgia Cancer Center for providing human serum specimens. This work was supported by the National Cancer Institute grants R01CA227433 and R01CA133085 (to KL), F30CA236436-01 (to JDK), F31CA257212-01 (to ADM), National Natural Science Foundation of China grant 81802858 (to CL), and US Department of Veterans Affairs Award CX001364 (to KL).
References
Supplementary materials
Supplementary Data
This web only file has been produced by the BMJ Publishing Group from an electronic file supplied by the author(s) and has not been edited for content.
Footnotes
Contributors CL, ZL, JDK, DY, ADM, DP and TA performed experiments, collected data, and analyzed data. JLW performed statistical analysis. CL, JLW, HS and KL designed the studies and wrote the manuscript.
Competing interests No, there are no competing interests.
Provenance and peer review Not commissioned; externally peer reviewed.
Supplemental material This content has been supplied by the author(s). It has not been vetted by BMJ Publishing Group Limited (BMJ) and may not have been peer-reviewed. Any opinions or recommendations discussed are solely those of the author(s) and are not endorsed by BMJ. BMJ disclaims all liability and responsibility arising from any reliance placed on the content. Where the content includes any translated material, BMJ does not warrant the accuracy and reliability of the translations (including but not limited to local regulations, clinical guidelines, terminology, drug names and drug dosages), and is not responsible for any error and/or omissions arising from translation and adaptation or otherwise.